
What Is RSI? Understanding the Relative Strength Index
If you've spent any time exploring technical analysis, you've almost certainly encountered the term RSI. Short for Relative Strength Index, RSI is one of the most widely used momentum indicators in trading — and for good reason. Whether you're analyzing stocks, crypto, forex, or ETFs, understanding what RSI is and how to read it can dramatically sharpen your ability to time entries and exits.
In this beginner's guide, we'll break down everything you need to know about RSI: what it measures, how it's calculated, how to interpret its signals, and how professional traders use it as part of a complete trading strategy. By the end, you'll have a clear, practical understanding of one of technical analysis's most powerful tools.
The Origins of RSI: Who Created It?
The Relative Strength Index was developed by J. Welles Wilder Jr. and introduced in his landmark 1978 book, New Concepts in Technical Trading Systems. Wilder was a mechanical engineer turned commodities trader, and his work produced several indicators that remain essential to this day — including the Average True Range (ATR) and the Parabolic SAR.
Wilder designed RSI to solve a specific problem: measuring the speed and magnitude of price movements in a way that could be consistently compared across different assets and timeframes. His solution was an oscillator that moves between 0 and 100, giving traders a normalized view of whether an asset is gaining or losing momentum.
How Is RSI Calculated?
While most modern trading platforms calculate RSI automatically, understanding the math behind it helps you interpret its signals more confidently.
The RSI Formula
The standard RSI formula is:
RSI = 100 − [100 / (1 + RS)]
Where RS (Relative Strength) = Average Gain over N periods ÷ Average Loss over N periods
The default look-back period is 14 periods — meaning the indicator looks at the last 14 candles (days, hours, or minutes, depending on your chart). Here's a simplified step-by-step breakdown:
- Step 1: Identify each period's price change (close minus previous close).
- Step 2: Separate gains (positive changes) from losses (negative changes).
- Step 3: Calculate the average gain and average loss over 14 periods.
- Step 4: Divide average gain by average loss to get the RS ratio.
- Step 5: Apply the formula above to normalize the result between 0 and 100.
The result is a single line oscillating between these two extremes, with 50 acting as the neutral midpoint. A rising RSI indicates increasing upward momentum; a falling RSI signals growing selling pressure.
How to Read RSI: Key Levels Explained
Now that you understand how RSI is calculated, let's focus on the most important part: how to actually read and use it in your trading decisions.
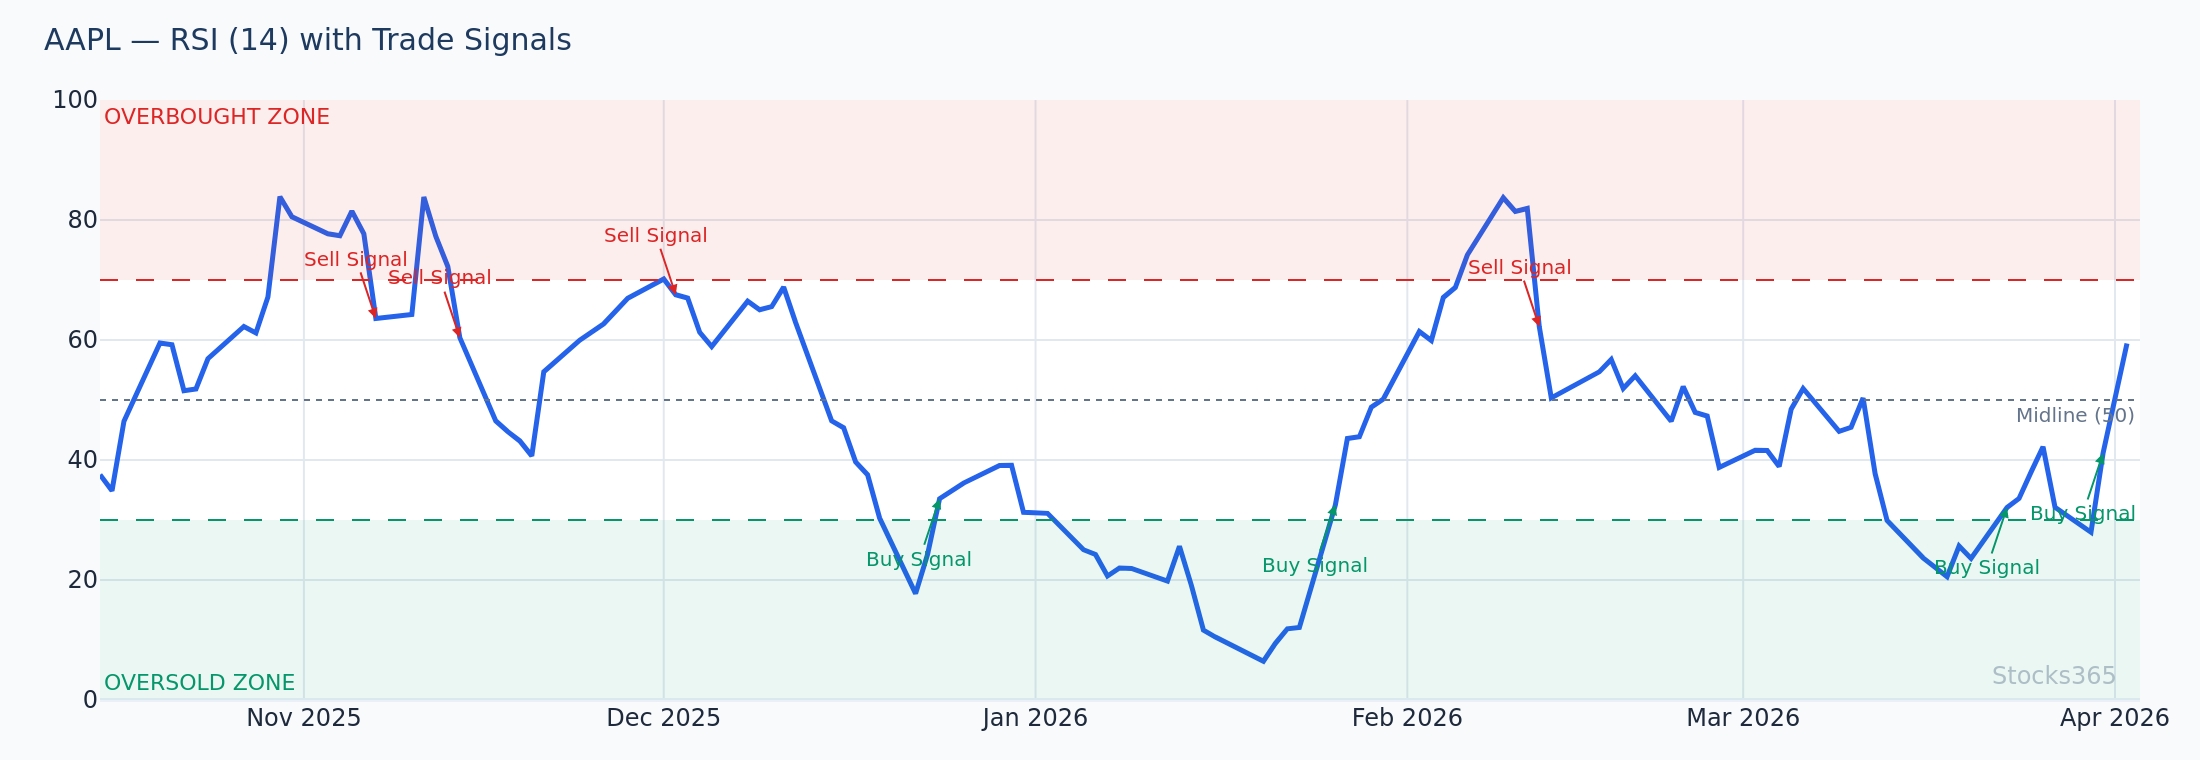
The Overbought Zone (RSI Above 70)
When RSI climbs above 70, the asset is considered overbought. This means price has risen rapidly relative to recent history, and buying momentum may be getting exhausted. Traders often look at this level as a potential warning sign that a pullback or reversal could be approaching.
Example: Imagine TSLA is trading at $280, and its 14-day RSI reads 78. This suggests the stock has surged significantly in a short period. A trader might tighten their stop-loss, take partial profits, or watch for confirmation of a reversal before entering a new long position.
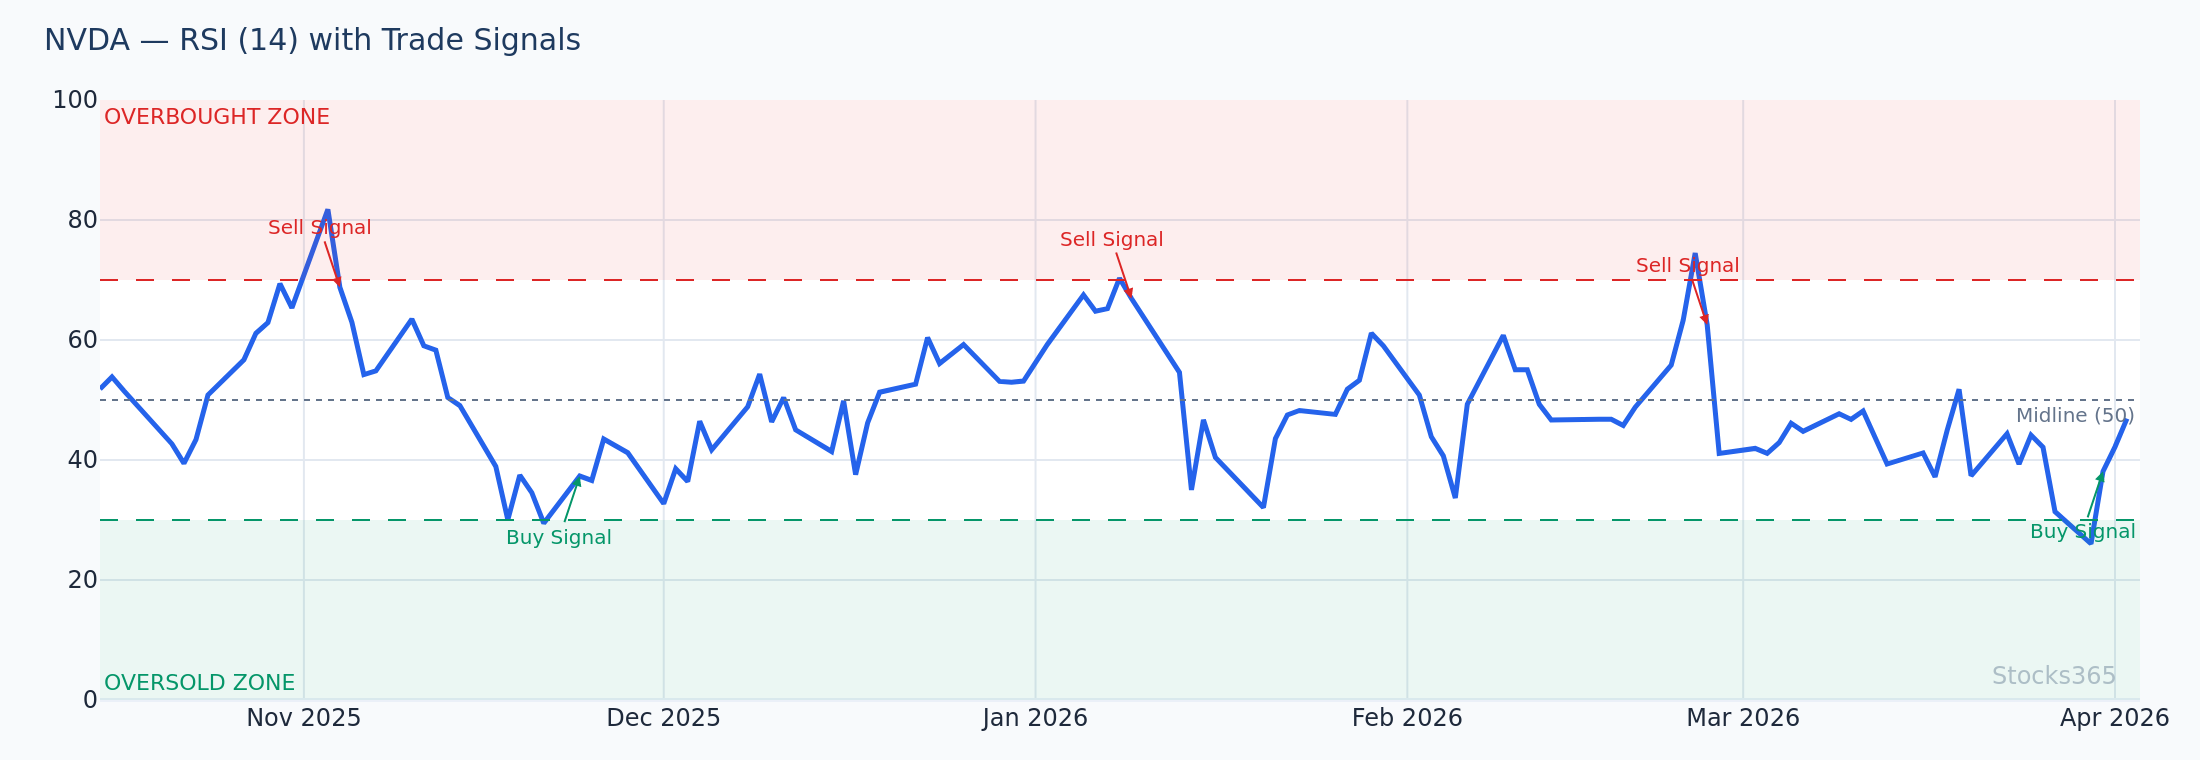
The Oversold Zone (RSI Below 30)
Conversely, when RSI drops below 30, the asset is considered oversold. Selling pressure has been intense, and the indicator suggests the move may be overdone. This can signal a potential bounce or buying opportunity — especially when combined with other bullish signals.
Example: Suppose NVDA drops from $620 to $510 over 10 trading days, pushing its RSI down to 24. Traders watching this level might begin accumulating shares or place limit buy orders near support, anticipating a mean-reversion bounce.
The Midline (RSI at 50)
The 50 level is often overlooked by beginners, but it's critically important to professional traders. When RSI crosses above 50, it signals that upward momentum is dominating — a bullish sign. When it falls below 50, downward momentum is taking control — a bearish sign. Many trend-following traders use the 50-level crossover as a filter to confirm the direction of the prevailing trend.
RSI Divergence: One of the Most Powerful Signals in Technical Analysis
Beyond overbought and oversold readings, RSI divergence is widely considered one of the most reliable signals the indicator can produce. Divergence occurs when price action and RSI move in opposite directions — a warning that the current trend may be losing steam.
Bullish RSI Divergence
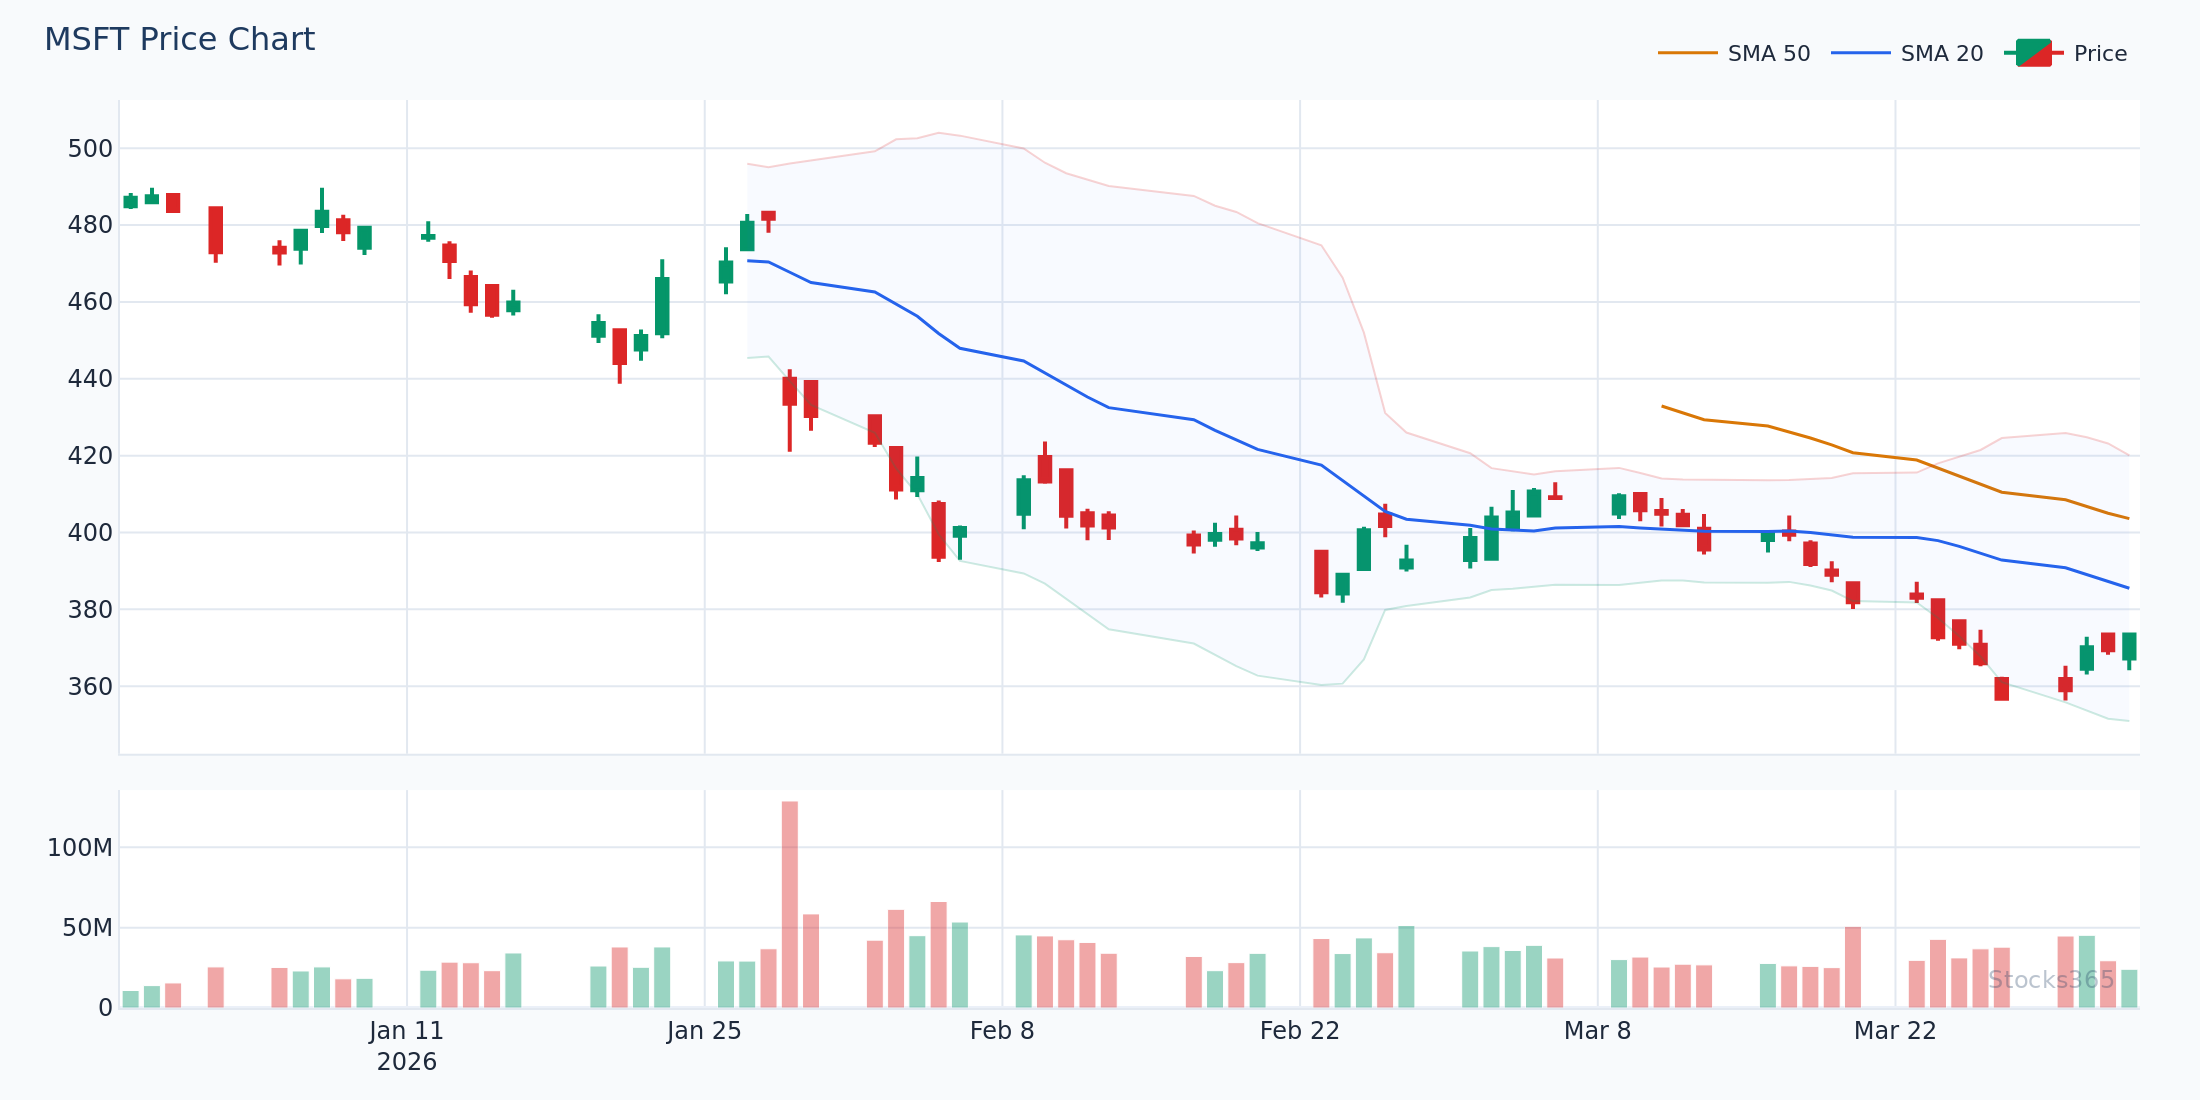
Bullish divergence occurs when price makes a lower low, but RSI makes a higher low. This suggests that despite prices falling further, selling momentum is actually weakening — a potential setup for a reversal to the upside.
Practical example: MSFT drops from $380 to $355 (first low), then falls again to $342 (lower low on price). However, RSI only dips from 32 to 35 on the second low — a higher low on RSI. This bullish divergence signals that sellers are losing control, and a reversal may be imminent. Traders might look for a confirmation candle (such as a bullish engulfing pattern) before entering long.
Bearish RSI Divergence
Bearish divergence is the mirror image: price makes a higher high, but RSI makes a lower high. This indicates that while price is still pushing upward, buying momentum is fading — a warning sign for bulls.
Practical example: AMZN rallies from $185 to $198 (first high), then pushes to $205 (higher high on price). But RSI only reaches 65 on the second peak, down from 72 on the first — a lower high on RSI. This bearish divergence warns that the rally is running out of fuel, and a correction may follow.
RSI in Different Market Conditions
One of the most common mistakes beginners make is applying RSI signals rigidly without considering the broader market context. The indicator behaves very differently in trending markets versus ranging (sideways) markets.
RSI in Trending Markets
In a strong uptrend, RSI can remain in overbought territory (above 70) for extended periods without triggering a meaningful reversal. Similarly, in a powerful downtrend, RSI can stay below 30 for weeks. Blindly selling every time RSI hits 70 in a bull market — or buying every dip to 30 in a bear market — can be costly.
Professional traders often adjust RSI thresholds in trending environments: using 80 as the overbought level and 40 as oversold in strong uptrends, for instance. Platforms like Stocks365 incorporate proprietary trust score systems that weigh RSI signals alongside trend strength and volume context, helping traders avoid acting on false signals in trending conditions.
RSI in Ranging Markets
RSI is at its most reliable in sideways or range-bound markets, where price oscillates between defined support and resistance levels. In these conditions, the classic 70/30 thresholds work well — traders can sell near 70 (top of the range) and buy near 30 (bottom of the range) with a reasonable degree of confidence.
RSI Trading Strategies for Beginners
Let's look at a few actionable RSI-based strategies you can begin studying and paper-trading today.
Strategy 1: The Classic Overbought/Oversold Reversal
- Wait for RSI to drop below 30 (oversold) or rise above 70 (overbought).
- Wait for RSI to cross back through the 30 or 70 level (this confirms momentum is shifting, not just touching the extreme).
- Enter the trade in the direction of the RSI crossback.
- Set a stop-loss below the recent swing low (for longs) or above the swing high (for shorts).
Example: GOOGL's RSI falls to 27, then crosses back above 30. A trader enters long at $162.50 with a stop at $158.00 (below the swing low) and targets $172.00 (the next resistance level) — a favorable risk/reward ratio of approximately 1:2.
Strategy 2: RSI Divergence + Candlestick Confirmation
- Identify a bullish or bearish RSI divergence as described above.
- Wait for a confirming candlestick pattern at a key support or resistance level (e.g., a bullish engulfing, hammer, or shooting star).
- Enter the trade only after confirmation — divergence alone is not a trade signal.
- Use the divergence swing point as your stop-loss reference.
Strategy 3: RSI + Moving Average Trend Filter
- Use a 50-period or 200-period moving average to define the primary trend.
- Only take RSI buy signals when price is above the moving average (bullish trend).
- Only take RSI sell signals when price is below the moving average (bearish trend).
- This filter dramatically reduces false signals and keeps you aligned with the dominant trend direction.
Common RSI Mistakes to Avoid
Even experienced traders sometimes misuse RSI. Here are the most common pitfalls — and how to sidestep them:
- Trading RSI in isolation: RSI is a momentum indicator, not a crystal ball. Always combine it with price action analysis, volume, and trend context for higher-probability setups.
- Ignoring the trend: As discussed, RSI signals carry very different weight in trending versus ranging markets. Always check the big picture before acting on an RSI reading.
- Using the wrong timeframe: A 14-period RSI on a 1-minute chart is far noisier than on a daily chart. Short-term RSI signals generate more false positives. Beginners are generally better served starting with daily or weekly charts.
- Changing the look-back period arbitrarily: Shortening RSI to 7 or 9 periods makes it more sensitive but also far noisier. Stick with the standard 14 periods until you have a strong reason to deviate.
- Expecting precision: RSI signals zones of potential reversal — not exact turning points. Price can remain overbought or oversold for much longer than seems reasonable.
RSI vs. Other Momentum Indicators
RSI doesn't operate in a vacuum. It's worth understanding how it compares to other popular momentum tools so you can decide when to use each one.
RSI vs. Stochastic Oscillator
Like RSI, the Stochastic Oscillator identifies overbought and oversold conditions. However, Stochastic compares closing price to the high-low range over a period, making it generally more sensitive and faster to signal. RSI tends to be smoother and better suited for trending markets; Stochastic works well in ranges and can signal reversals earlier.
RSI vs. MACD
The MACD (Moving Average Convergence Divergence) is a trend-following momentum indicator that shows the relationship between two moving averages. While RSI measures speed of price change relative to itself, MACD measures the relationship between two EMAs. Many traders use both together: MACD for trend direction and RSI for entry timing.
RSI vs. Bollinger Bands
Bollinger Bands measure volatility and price relative to a moving average, while RSI measures momentum. They complement each other well — when RSI shows oversold conditions and price touches the lower Bollinger Band, the confluence creates a stronger potential buy signal than either indicator alone.
Using RSI on the Stocks365 Platform
Modern trading intelligence platforms have made applying RSI analysis faster and more reliable than ever. On Stocks365, RSI is fully integrated into the charting suite and can be layered alongside the platform's proprietary Trust Score system — which aggregates multiple technical signals, including RSI readings, to give traders a composite view of a stock's momentum health.
When Stocks365's Trust Score highlights a high-conviction setup, RSI is often one of the contributing factors — whether it's a fresh oversold bounce above the 30 level, a confirmed bullish divergence, or a 50-level crossover aligning with a breakout pattern. This kind of multi-factor validation helps traders avoid the most common RSI pitfall: acting on a single indicator in isolation.
Key Takeaways
- RSI (Relative Strength Index) is a momentum oscillator that moves between 0 and 100, measuring the speed and magnitude of recent price changes.
- Readings above 70 indicate overbought conditions; readings below 30 indicate oversold conditions.
- The 50 midline acts as a trend confirmation level — above it is bullish, below is bearish.
- RSI divergence (price and RSI moving in opposite directions) is one of the most powerful reversal signals in technical analysis.
- RSI works best when combined with trend analysis, volume, and other confirming indicators — never in isolation.
- In strong trends, RSI can remain overbought or oversold for extended periods — always consider the broader market context.
- The default 14-period setting is standard for most trading applications and is a reliable starting point for beginners.
Frequently Asked Questions About RSI
What does RSI stand for, and what does it measure?
RSI stands for Relative Strength Index. It's a momentum oscillator developed by J. Welles Wilder that measures the speed and magnitude of recent price changes. It outputs a value between 0 and 100, helping traders assess whether an asset is potentially overbought, oversold, or trending with strong momentum.
What is a good RSI number to buy?
There is no single "perfect" RSI number to buy, but many traders look for RSI readings below 30 (oversold territory) as potential buying opportunities — especially when RSI begins crossing back above 30, confirming a momentum shift. However, this should always be combined with price action analysis and trend context. In a strong downtrend, RSI can stay below 30 for extended periods, so confirmation is essential.
What is the best RSI setting for day trading?
Day traders often use a shorter RSI period — such as 7 or 9 — on intraday charts (5-minute, 15-minute) to make the indicator more responsive to short-term price changes. However, shorter periods also generate more false signals. The standard 14-period RSI remains a solid baseline, and many experienced day traders use it on 15-minute or hourly charts for a balance between sensitivity and reliability.
Can RSI predict price movements?
RSI does not predict price movements with certainty — no indicator does. What it does is identify conditions where price may be statistically stretched (overbought or oversold) or where momentum may be shifting (divergence). Think of RSI as raising a flag that says "pay attention here" rather than a definitive buy or sell command. Combining RSI with other tools significantly improves decision-making quality.
What is the difference between RSI and Relative Strength?
Despite the similar name, RSI (Relative Strength Index) and Relative Strength are different concepts. RSI measures a single asset's internal momentum — comparing its up-closes to down-closes over a period. Relative Strength (often used in comparative analysis) measures how one asset performs relative to another asset or benchmark, such as comparing a stock's performance to the S&P 500. They are related concepts but serve different analytical purposes.