
Understanding the RSI Formula: Why the Math Behind the Indicator Matters
Most traders use the Relative Strength Index (RSI) every single day without ever understanding what's happening beneath the surface. That's a problem — because when you truly understand the RSI formula calculation, you stop treating it like a black box and start using it with real conviction. You know why the indicator is giving you a signal, not just that it is.
If you're brand new to the concept, you may want to first read our foundational guide: What Is RSI? The Complete Beginner's Guide (2024). But if you're ready to go deeper — into the actual numbers, the arithmetic, and the logic — you're in the right place.
In this article, we'll walk through every step of the RSI calculation formula, use real price data to demonstrate, and show you how understanding this math makes you a sharper, more confident trader.
What Is RSI and What Problem Does It Solve?
Before we dive into the numbers, let's anchor the concept. The Relative Strength Index (RSI) was developed by J. Welles Wilder Jr. and introduced in his 1978 book New Concepts in Technical Trading Systems. It's a momentum oscillator — a tool that measures the speed and magnitude of price changes and expresses them as a single number between 0 and 100.
The core problem RSI solves is this: markets don't move in straight lines. Prices surge, then pull back. They crash, then bounce. RSI gives traders a standardized, mathematically grounded way to assess whether a price move has gone too far, too fast — and whether a reversal or continuation is likely.
Key Principle: RSI doesn't measure the direction of price — it measures the strength of price movement relative to its own history. That distinction is everything.
The Core RSI Formula: Breaking It Down
The RSI formula looks deceptively simple on the surface:
RSI = 100 – [100 / (1 + RS)]
Where RS (Relative Strength) = Average Gain / Average Loss
But the real depth is in how those averages are calculated. Let's walk through each component methodically.
Step 1: Choose Your Lookback Period
Wilder originally used a 14-period lookback, and this remains the industry standard today. On a daily chart, that means the last 14 trading days. On a 1-hour chart, it's the last 14 hours. The period scales with your timeframe.
Why 14? Wilder found that 14 periods offered a balance between sensitivity and reliability. Shorter periods (like 7) make RSI more reactive and generate more signals — including more false ones. Longer periods (like 21 or 25) smooth out the noise but can lag meaningful turns in price.
Step 2: Calculate Daily Price Changes
For each period in your lookback window, calculate the price change from close to close:
- If today's close is higher than yesterday's close → this is a gain
- If today's close is lower than yesterday's close → this is a loss (recorded as a positive number)
- If there's no change → both gain and loss are recorded as zero
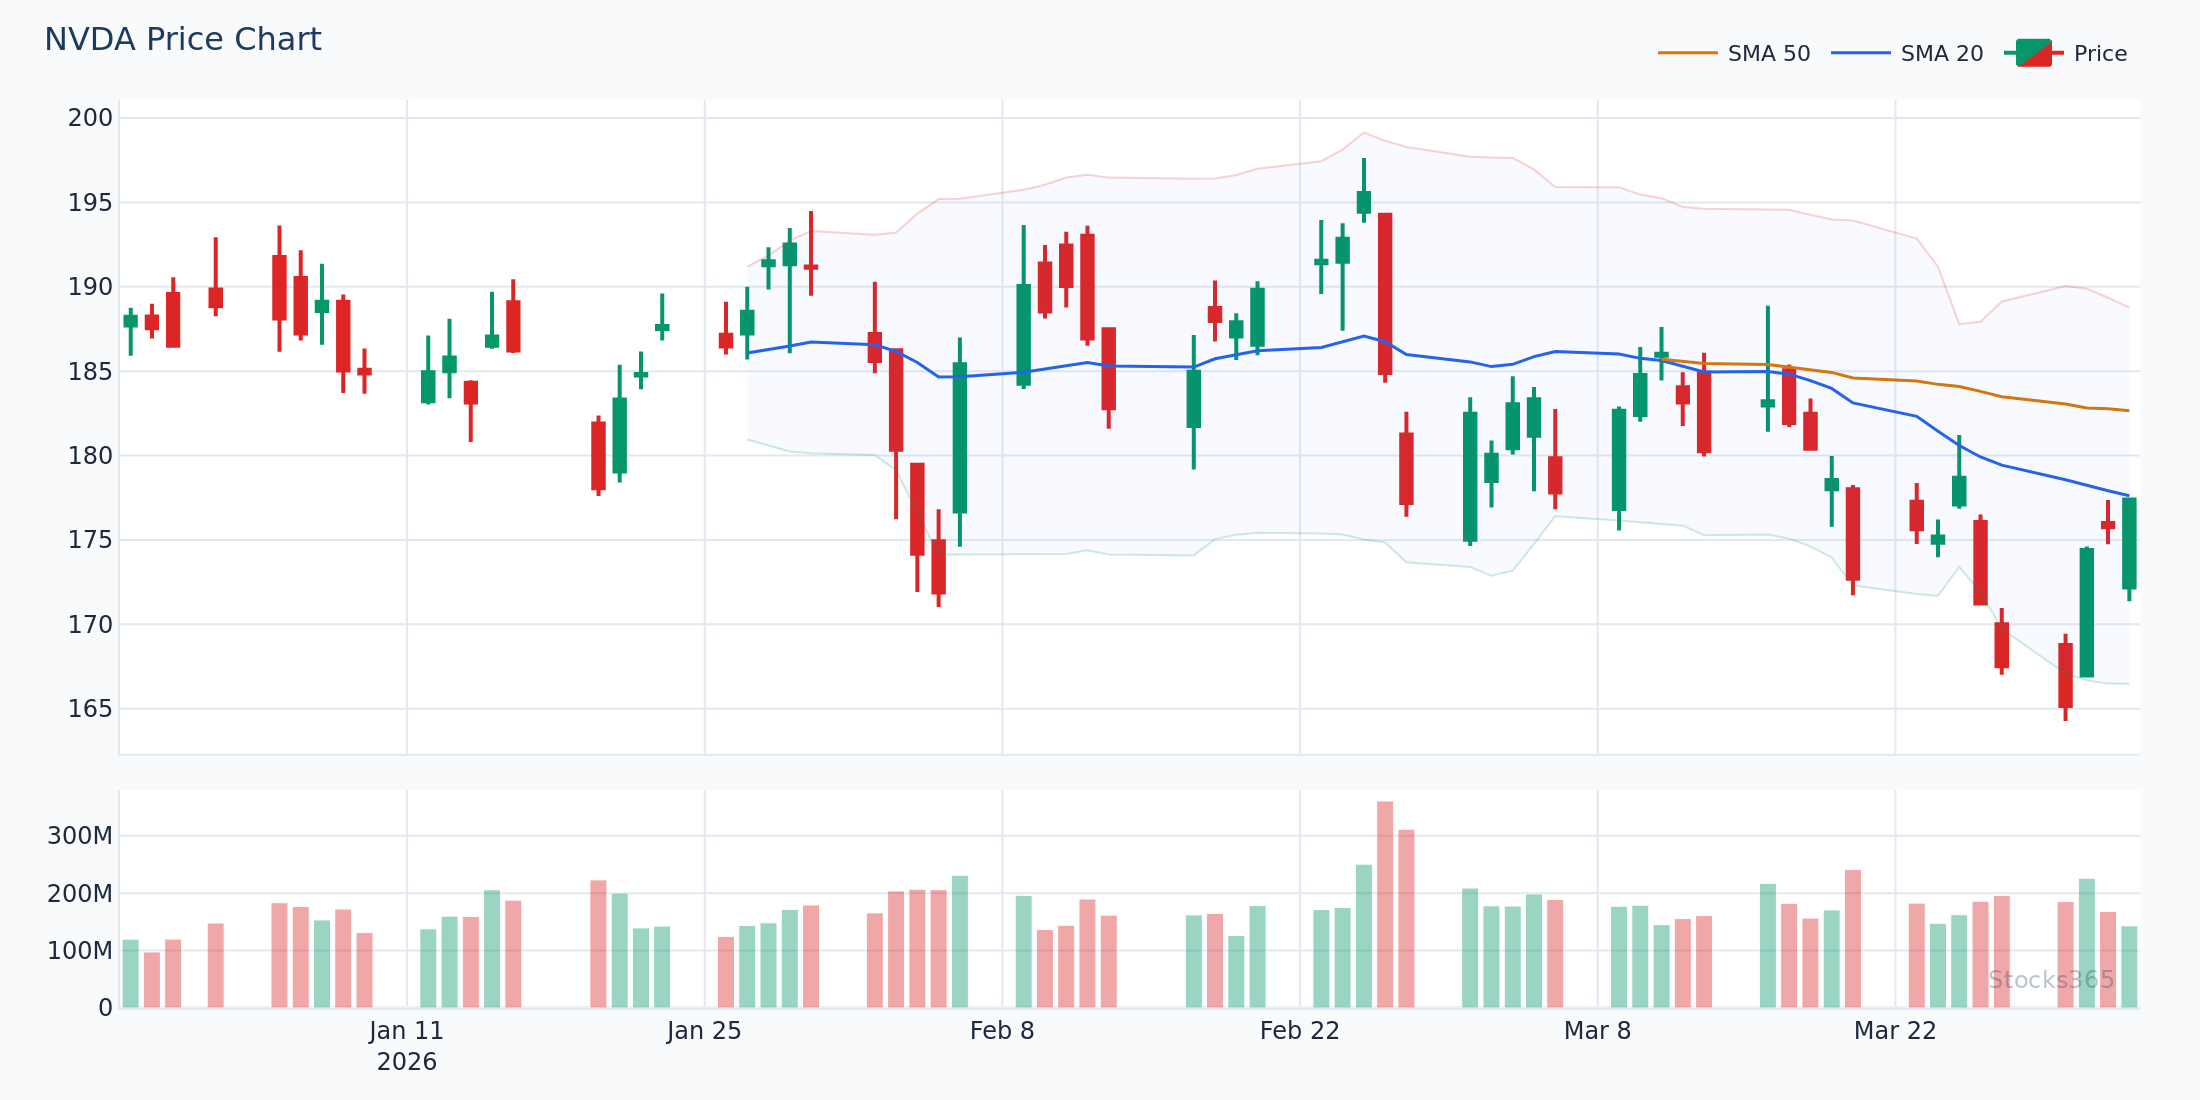
Let's use a concrete example. Imagine the closing prices for NVDA over 15 trading days:
- Day 1: $480.00
- Day 2: $485.50 → Gain: $5.50
- Day 3: $479.00 → Loss: $6.50
- Day 4: $483.75 → Gain: $4.75
- Day 5: $491.20 → Gain: $7.45
- Day 6: $488.00 → Loss: $3.20
- Day 7: $493.50 → Gain: $5.50
- Day 8: $497.80 → Gain: $4.30
- Day 9: $494.10 → Loss: $3.70
- Day 10: $500.00 → Gain: $5.90
- Day 11: $503.25 → Gain: $3.25
- Day 12: $499.50 → Loss: $3.75
- Day 13: $505.00 → Gain: $5.50
- Day 14: $509.75 → Gain: $4.75
- Day 15: $506.00 → Loss: $3.75
Step 3: Calculate the First Average Gain and Average Loss
For the initial calculation (first RSI value), use a simple arithmetic average of the gains and losses over the first 14 periods (Days 2 through 15 in our example):
Gains: $5.50, $4.75, $7.45, $5.50, $4.30, $5.90, $3.25, $5.50, $4.75 = 9 gaining periods
Losses: $6.50, $3.20, $3.70, $3.75, $3.75 = 5 losing periods
Total Gains = $5.50 + $4.75 + $7.45 + $5.50 + $4.30 + $5.90 + $3.25 + $5.50 + $4.75 = $46.90
Total Losses = $6.50 + $3.20 + $3.70 + $3.75 + $3.75 = $20.90
Average Gain (14-period) = $46.90 / 14 = $3.35
Average Loss (14-period) = $20.90 / 14 = $1.493
Notice that we divide by 14 (the total number of periods), not just by the number of up or down days. Periods with no movement in a particular direction contribute zero to the average, which is essential to how the formula works.
Step 4: Calculate Relative Strength (RS)
RS = Average Gain / Average Loss
RS = $3.35 / $1.493 = 2.244
Step 5: Calculate RSI
RSI = 100 – [100 / (1 + RS)]
RSI = 100 – [100 / (1 + 2.244)]
RSI = 100 – [100 / 3.244]
RSI = 100 – 30.83
RSI = 69.17
With an RSI of approximately 69, NVDA in this example is approaching but not yet in overbought territory (traditionally defined as above 70). A trader seeing this would be alert to potential momentum exhaustion but wouldn't yet have a confirmed overbought signal.
Wilder's Smoothing Method: The Second Calculation and Beyond
Here's where most RSI explanations fall short: they describe the initial calculation but skip the smoothed averages used for all subsequent RSI values. This matters significantly for accuracy.
After the first 14-period RSI is calculated, Wilder used an exponential smoothing technique — sometimes called Wilder's Smoothing or the Wilder Moving Average (WMA). The formula changes for every RSI value after the first:
Smoothed Average Gain = [(Previous Avg Gain × 13) + Current Gain] / 14
Smoothed Average Loss = [(Previous Avg Loss × 13) + Current Loss] / 14
This smoothing accomplishes two critical things:
- It gives more weight to recent price action than to older data
- It prevents abrupt RSI swings from a single large gain or loss disproportionately distorting the indicator
Smoothing in Practice: Day 16 Example
Let's say on Day 16, NVDA closes at $512.50, a gain of $6.50.
Smoothed Avg Gain = [($3.35 × 13) + $6.50] / 14 = [$43.55 + $6.50] / 14 = $50.05 / 14 = $3.575
Smoothed Avg Loss = [($1.493 × 13) + $0] / 14 = $19.409 / 14 = $1.386
New RS = $3.575 / $1.386 = 2.579
New RSI = 100 – [100 / (1 + 2.579)] = 100 – [100 / 3.579] = 100 – 27.94 = 72.06
Now RSI crosses above 70 — a classically overbought reading. Notice how the smoothed calculation absorbs the new strong day without spiking wildly. That's the elegance of Wilder's method.
Mathematical Boundaries: Why RSI Can Never Be 0 or 100
This is a subtle but important insight from the RSI formula calculation. Look at the extremes:
- If there are zero losses over the lookback period, Average Loss = 0, RS = infinity, and RSI approaches (but never mathematically reaches) 100
- If there are zero gains over the lookback period, Average Gain = 0, RS = 0, and RSI equals 0 exactly... or does it?
In practice, because of Wilder's smoothing, previous losing periods carry forward infinitesimally into average loss calculations. An RSI of exactly 0 or 100 is essentially impossible in live markets, which is why extreme readings like 95+ or 5- are extraordinarily rare and historically significant when they do appear.
RSI Formula Variations: When Traders Deviate From the Standard
While Wilder's original 14-period RSI is the benchmark, professional traders frequently modify the inputs to match their strategy:
Period Adjustments
- RSI(7): Used by short-term and swing traders. More sensitive, generates more frequent signals. Prone to whipsaws in choppy markets.
- RSI(14): The default. Best balance of sensitivity and reliability for most timeframes.
- RSI(21) or RSI(25): Preferred by position traders and investors. Fewer, higher-conviction signals. Better for identifying major trend shifts.
Modified Average Calculations
Some platforms replace Wilder's smoothing with a standard Exponential Moving Average (EMA) or even a Simple Moving Average (SMA). This changes RSI values and behavior meaningfully:
- EMA-based RSI: Slightly more reactive than Wilder's method. Common in some charting platforms.
- Cutler's RSI: Uses a simple moving average rather than Wilder's smoothing, making it path-independent (the same for all platforms given the same lookback period).
When using Stocks365's signals dashboard, you'll notice RSI values are computed using Wilder's original smoothed method — the industry standard — ensuring consistency with professional-grade technical analysis.
How the RSI Formula Creates the Overbought/Oversold Levels
Understanding the formula helps demystify why 70 and 30 are the traditional overbought and oversold thresholds. These levels aren't arbitrary — they emerge from the mathematical properties of the formula itself.
Let's work backward from RSI = 70:
70 = 100 – [100 / (1 + RS)]
30 = 100 / (1 + RS)
1 + RS = 100/30 = 3.333
RS = 2.333
This means an RSI of 70 corresponds to average gains being 2.33x average losses over the lookback period. That's a meaningful, statistically significant imbalance in buying versus selling pressure.
For RSI = 30 (oversold):
RS = 100/70 – 1 = 0.4286
An RSI of 30 means average gains are less than half of average losses — sustained, dominant selling pressure. When you see these levels, you're not just looking at an arbitrary line on a chart. You're seeing a mathematical fact about the ratio of buying to selling pressure in the market.
Adapting Thresholds for Trending Markets
In strong uptrends, RSI tends to stay elevated — often between 40 and 80. In downtrends, it oscillates between 20 and 60. Many professional traders adjust their overbought/oversold thresholds accordingly:
- In uptrends: Watch 40 as support level, 80 as overbought
- In downtrends: Watch 60 as resistance, 20 as oversold
RSI Calculation and Stocks365 Trust Score: A Natural Connection
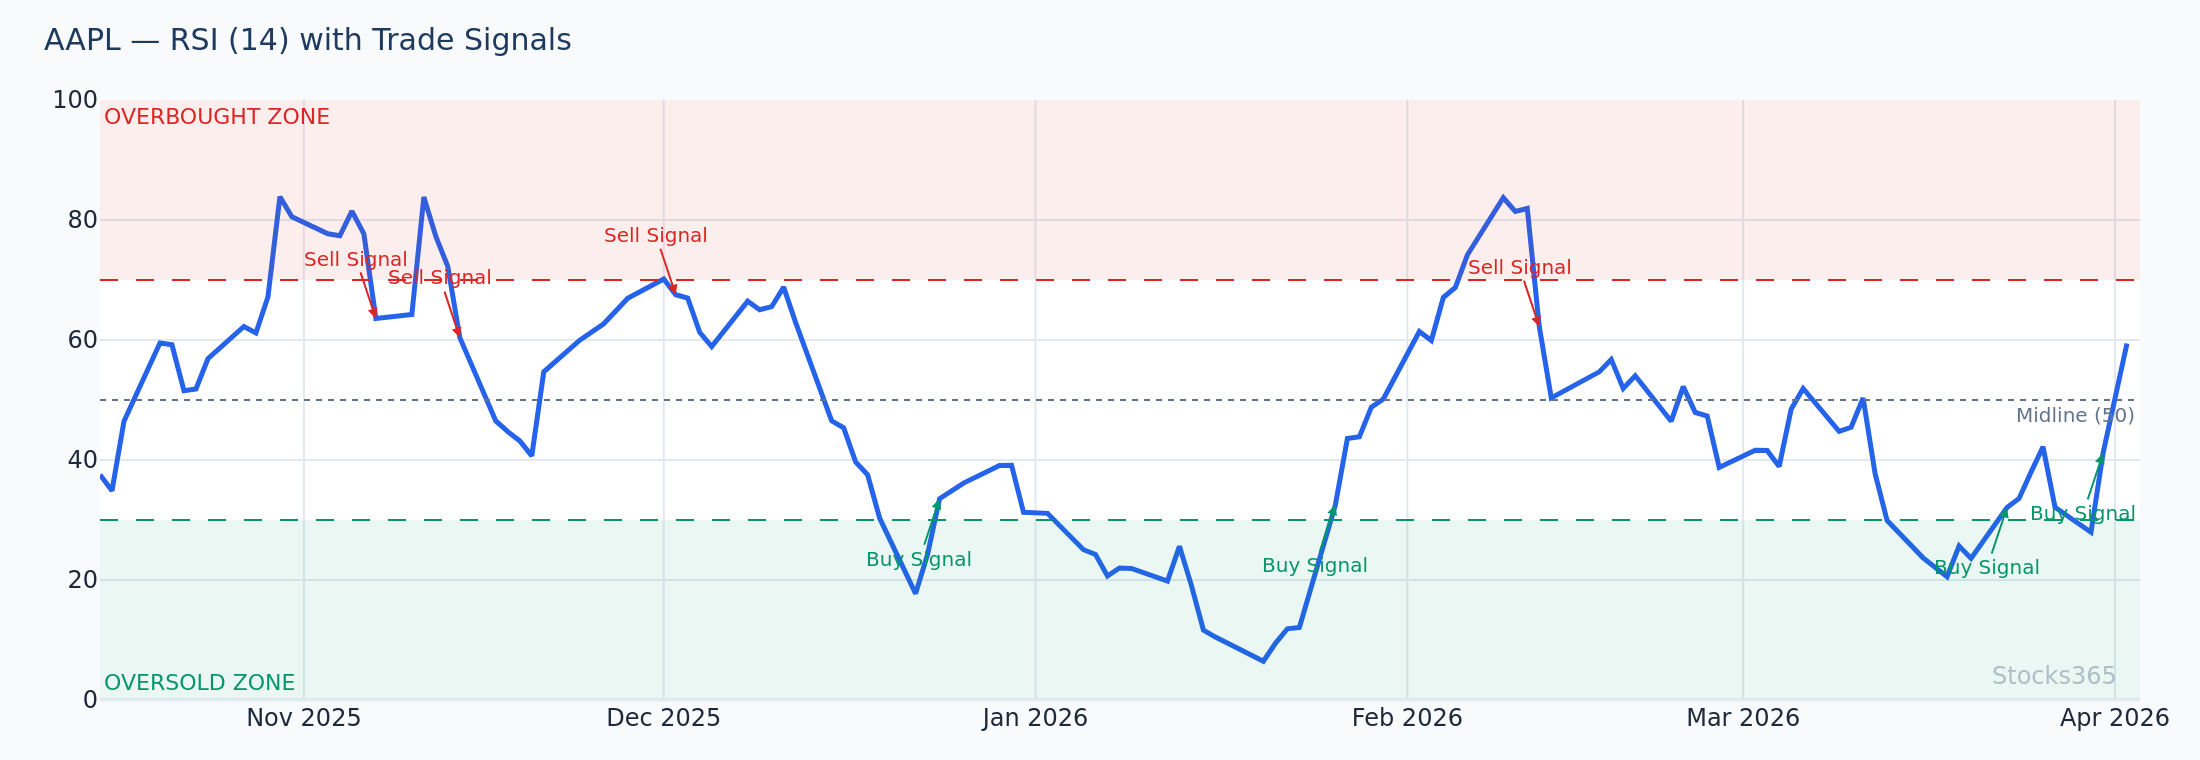
When you view a signal on Stocks365, such as the AAPL signal page, you'll see a Trust Score alongside the RSI reading. This score synthesizes RSI with volume confirmation, trend alignment, and other technical factors — because raw RSI values alone can be misleading without context.
Here's why this matters from a formula perspective: two stocks can both show RSI = 72, but if one reached that level through 12 consecutive small gains (indicating steady institutional accumulation) and another through two massive single-day spikes (indicating volatile, retail-driven momentum), they carry very different risk profiles. The Trust Score system weighs these nuances that the RSI formula alone cannot capture.
Understanding the RSI formula calculation makes you a better interpreter of these composite signals — you know which inputs matter and what the numbers are actually telling you about the market's internal dynamics.
Common Calculation Mistakes to Avoid
Even sophisticated traders make errors when applying the RSI formula. Here are the most common pitfalls:
Mistake 1: Dividing by Up-Days Instead of Total Periods
Average Gain = Total Gains / 14 (not just the number of up days). This is the most frequent error and significantly distorts the RS ratio.
Mistake 2: Ignoring the Initialization Period
RSI requires a minimum of 14 periods of data just to produce its first value. Many backtests are invalidated by starting RSI calculations too early in a data set.
Mistake 3: Using Close-to-Open vs. Close-to-Close
Wilder's formula uses close-to-close price changes. Using open-to-close (body) changes or high-to-low ranges will produce different, non-standard RSI values.
Mistake 4: Not Accounting for Smoothing After Day 14
The simple average is only used once — for the initial calculation. Every subsequent RSI value must use Wilder's smoothing formula. Platforms that use simple rolling averages throughout produce RSI values that diverge meaningfully from the standard.
Key Takeaways
📊 RSI Formula Summary — What Every Trader Must Know
- RSI = 100 – [100 / (1 + RS)], where RS = Average Gain / Average Loss
- The standard lookback period is 14 periods (bars, days, hours — depending on timeframe)
- The first calculation uses a simple average; all subsequent values use Wilder's exponential smoothing
- RSI of 70 mathematically means average gains are 2.33× average losses; RSI of 30 means gains are less than half of losses
- RSI can theoretically never reach exactly 0 or 100 due to the smoothing mechanism
- Period adjustments (RSI-7, RSI-21) change sensitivity but the formula structure remains identical
- Understanding the formula helps you interpret RSI readings with context, not just as arbitrary levels
- Tools like Stocks365's signals dashboard pair RSI with Trust Score to add contextual reliability to raw formula outputs
Frequently Asked Questions
What is the exact RSI formula used by most trading platforms?
Most professional trading platforms use Wilder's original formula: RSI = 100 – [100 / (1 + RS)], where RS equals average gain divided by average loss over a 14-period lookback. The initial average is a simple arithmetic mean; all subsequent averages use Wilder's smoothing: [(Prior Avg × 13) + Current Value] / 14. Some platforms substitute an EMA for Wilder's smoothing, which can produce slightly different values — always verify which method your platform uses.
Why does the RSI formula use 14 periods as the default?
J. Welles Wilder selected 14 periods after extensive backtesting on commodity markets in the 1970s. He found it represented roughly half a lunar cycle (28 days) and provided an optimal balance between responsiveness to recent price action and filtering out short-term noise. It has remained the standard default because it continues to perform well across most asset classes and timeframes, though traders freely adjust it based on their strategy and market.
Can RSI ever reach 0 or 100?
In theory, RSI approaches 100 if there are no losing periods and 0 if there are no gaining periods. However, due to Wilder's smoothing method, prior period data always carries some fractional weight forward, making true 0 or 100 readings essentially impossible in live markets. An RSI reading above 95 or below 5 is extraordinarily rare and typically signals extreme, historically significant momentum conditions.
Does changing the RSI period change the formula, or just the inputs?
Changing the period (for example, from 14 to 7 or 21) changes the inputs to the formula, not the formula itself. The structure — RS = Average Gain / Average Loss, RSI = 100 – [100 / (1 + RS)] — remains identical. What changes is how many periods are used to compute the averages and the smoothing factor. A 7-period RSI uses [(Prior Avg × 6) + Current] / 7 for smoothing; a 21-period uses [(Prior Avg × 20) + Current] / 21.
How does understanding the RSI formula make me a better trader?
When you understand the RSI formula calculation, you can interpret readings with nuance rather than treating thresholds as mechanical rules. You know that RSI of 72 reached via sustained small gains is different from RSI of 72 from a single gap-up day. You understand why RSI in trending markets stays elevated or depressed. You can make intelligent decisions about period adjustments for your specific strategy. And you can combine RSI readings with complementary data — like the contextual signals available on Stocks365's dashboard — to build genuinely informed trading decisions rather than reflexively buying or selling at arbitrary lines.