

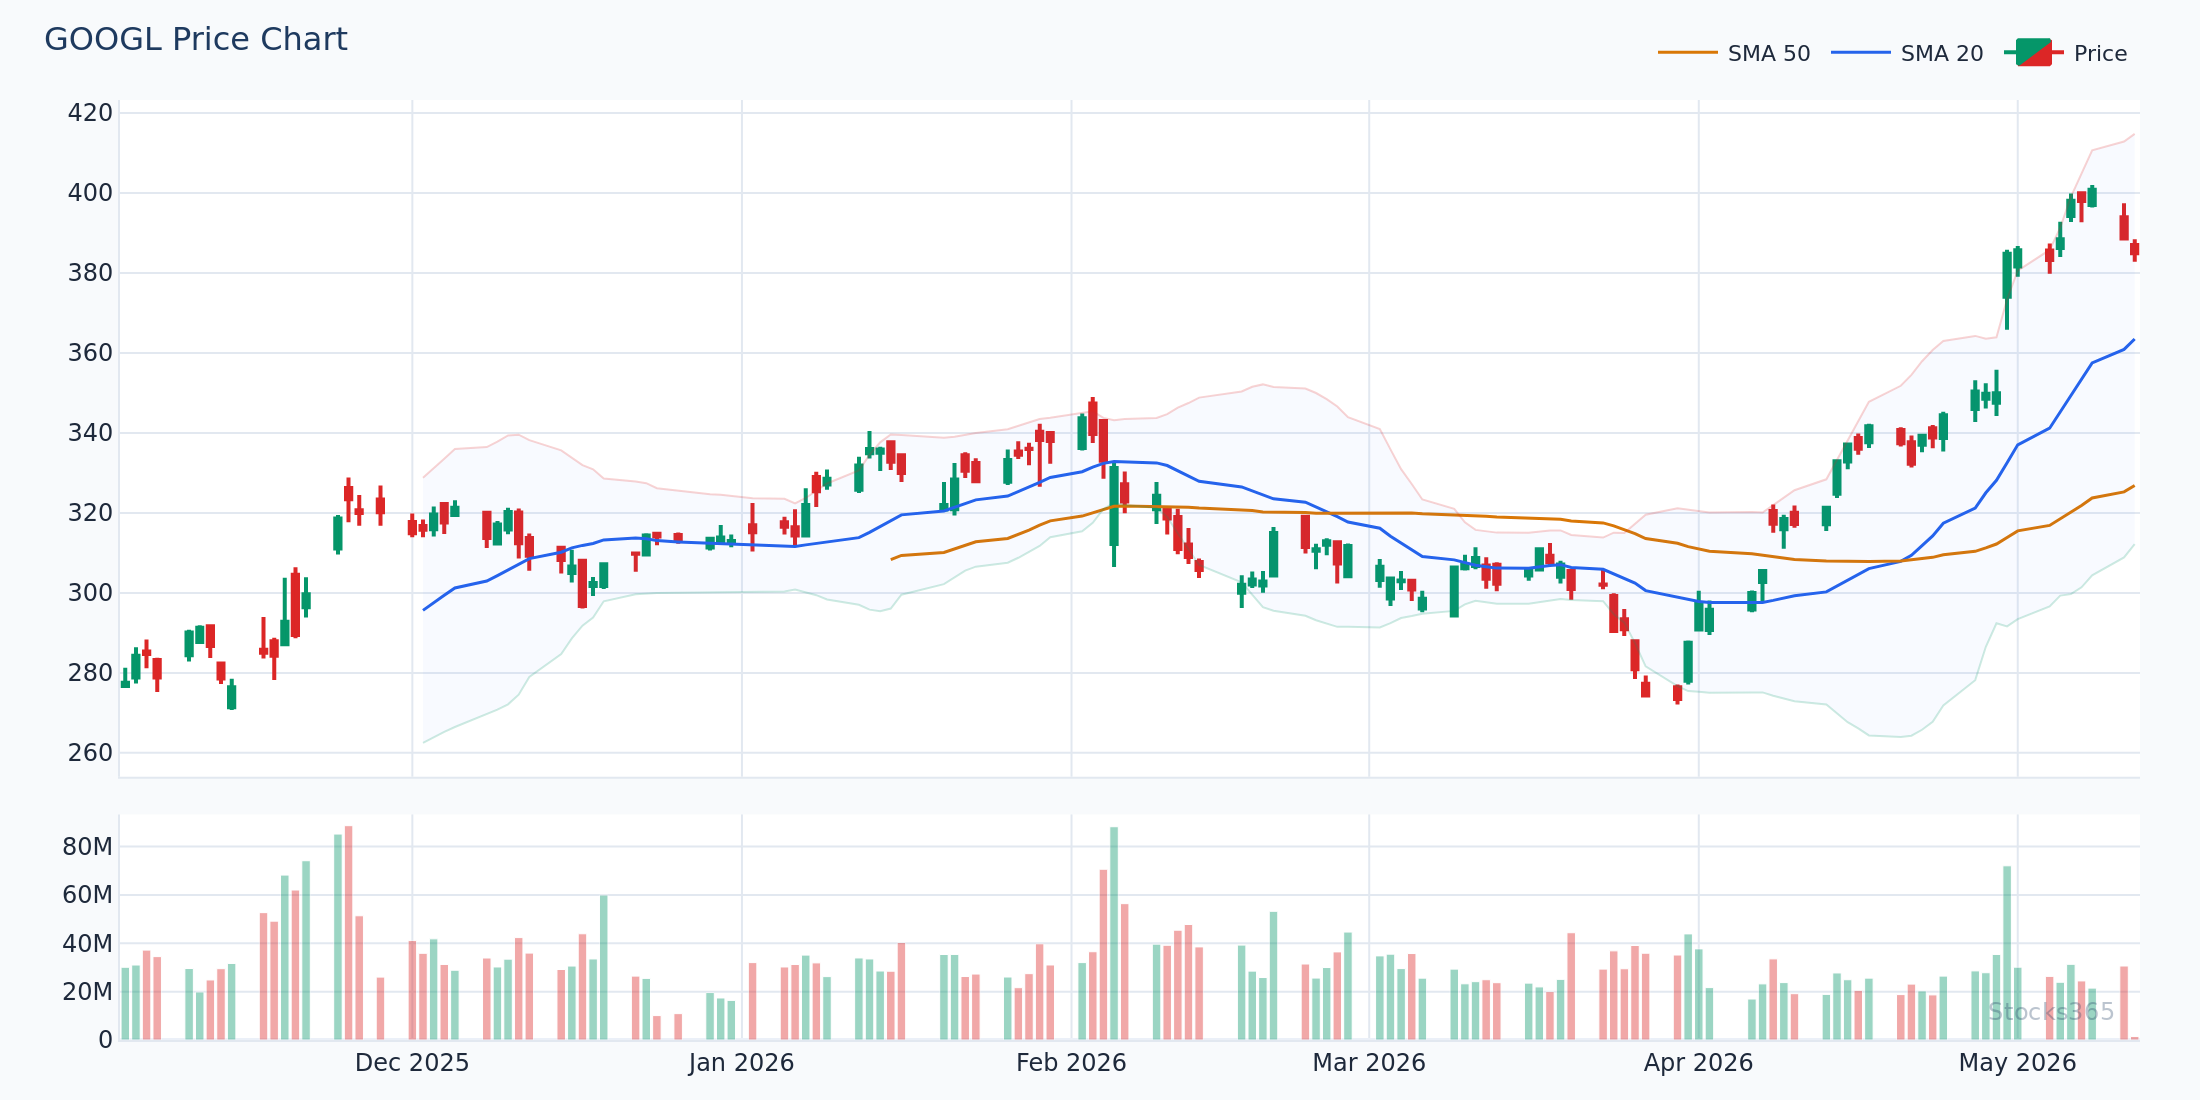
Here is the anomaly worth sitting with as Tuesday's close settles: Alphabet Inc. (GOOGL) shed 1.0% today to $384.92 — not on any Alphabet-specific news, but on a day when one of its freshly signed AI data partners, Veritone, was telling investors that the near-term VDR pipeline has expanded to nearly $70 million. The hyperscaler that just inked the deal trades down while the smaller counterparty touts the relationship as a growth catalyst. That divergence — large cap risk-off, small-cap AI narrative risk-on — is not random. It is a regime signal worth decoding before Wednesday's open.
Underneath the individual prints, the macro backdrop has not changed in ways that favor complacency. The as of May 11, with the 10-year at 4.38% and the 2-year at . The Fed funds effective rate holds at . That configuration — a positively sloped but historically shallow curve, with the policy rate still well above the 2-year — tells you the market is not pricing aggressive cuts, but it is also not pricing a hike cycle. It is a compression regime, and compression regimes tend to reward quality growth stories that can self-fund. Which makes today's earnings mix more instructive than the index moves suggest.
The Veritone-GOOGL Decoupling and What the AI Data Trade Actually Looks Like Now
Start with Veritone. First-quarter revenue came in at $20.3 million, down $2.2 million from the prior year, with managed services the primary drag. That headline is the wrong frame. What matters structurally is that Google and NVIDIA both signed VDR data services agreements in Q1 — relationships the company says drove timing distortions rather than demand destruction. The near-term VDR sales and bookings figure of more than $68 million, against full-year guidance of $130 million to $145 million reaffirmed today, implies the back-half loading is not wishful thinking — it is contractually seeded.
The company says it has cut its breakeven point by roughly 30% and is targeting operating profitability as early as Q4 of this year. For a company of this size, that trajectory matters more than any single quarter's top line. The setup here is classic: a beat-and-raise candidate in waiting, dependent on hyperscaler deal timing converting into recognized revenue. The risk is execution, not demand.
Now zoom out. GOOGL sliding 1% on a day when Veritone is citing Google as a marquee growth driver is an illustration of something we flagged in our earlier note on AI's diverging valuations — the market increasingly wants to own the picks-and-shovels layer of the AI trade, not the hyperscalers themselves. Alphabet's 8-K filed May 11 with the SEC shows the company remains deeply capitalized, but at $384.92, the stock is reflecting a broader risk-off tilt in mega-cap tech that the afternoon session confirmed. When large-cap AI sells off and small-cap AI data suppliers rally on signed contracts, that is a flow rotation worth tracking — term premium (the extra yield demanded for holding longer-duration bonds) is rising, and duration-heavy growth names feel that pressure first.

JD.com's Margin Expansion Is the Sharpest China Consumer Signal in Months
If Veritone is the micro signal, JD.com Inc. (JD) is the macro one. The company reported Q1 revenue of RMB316 billion, up approximately 5% year-on-year, with JD Retail's operating margin expanding 0.7 percentage points to 5.6% — described as nearing historical highs. Gross margin for JD Retail came in at 18.6%, up 1.8 percentage points year-on-year. General merchandise grew 14.9% year-on-year. These are not rounding-error improvements; they reflect a structural shift in JD's revenue mix toward higher-margin service and marketplace revenue streams.
JD Logistics revenue grew strongly, and the company held RMB216 billion in cash and equivalents at quarter-end. The $1.4 billion annual cash dividend — roughly $1 per ADS — combined with a buyback of approximately 44.5 million Class A ordinary shares worth USD 631 million, signals management confidence in the durability of the margin trajectory. Free cash flow declined year-on-year to RMB22 billion from RMB38 billion, but that compression was explicitly tied to cash outflows from the company's trading program, not operational deterioration.
The macro read here is nuanced. Electronics and home appliances revenue was down 8.4% year-on-year despite sequential improvement, and management flagged a high trading base and rising product prices as likely headwinds into Q2. That is important context for anyone positioning around China consumer recovery as a theme. The re-acceleration is real, but it is category-specific. General merchandise and services are recovering; big-ticket electronics are still working through base effects and pricing friction. For cross-asset traders watching the yuan and China-sensitive commodity baskets, JD's granular breakdown is a better leading indicator than the aggregate revenue line.
K.P. Energy's Cash Conversion Crack Inside a Record Revenue Print
K.P. Energy Ltd (BOM:539686) crossed Rs. 1,500 crore in revenue for the first time, with 57% year-on-year growth and EBITDA expanding 68% to Rs. 328.44 crore. The order book sits at nearly 2 gigawatts, valued at approximately Rs. 3,000 crore. By surface metrics, this is a clean growth story in India's renewable build-out.
The layer underneath it is more complicated. Cash flow from operations slowed meaningfully relative to prior-year levels, driven by elevated inventory accumulation ahead of upcoming projects and — notably — geopolitical supply chain hedging. The CFO attributed the spike in other liabilities to advances made to lock in supply chain security. The cash conversion cycle runs 100 to 150 days. For a capital-intensive renewables developer, that range is not alarming in isolation, but it bears watching if project timelines slip or if geopolitical disruptions actually materialize rather than just being hedged against.
The company's long-term vision of crossing 10 gigawatts by 2030 and its newly secured Interstate Electricity Trading License are genuine strategic milestones. But the gap between record revenue and constrained free cash flow is exactly the pattern that trips up renewable developers in rising-rate environments. India's rates are their own story, but the global cost-of-capital environment — with the U.S. 10-year at 4.38% — raises the discount rate on long-duration infrastructure assets everywhere. The trade is in the order book quality and project execution, not the revenue headline.

Harrow's Negative EBITDA Quarter Hides a Prescription Acceleration That Changes the Setup for H2
The most misread print of the afternoon may belong to Harrow Inc (HROW). Consolidated Q1 revenue of $44.2 million came with negative adjusted EBITDA of $12.7 million — a combination that, at first glance, looks like a deteriorating story. But peel back the layers and the operating narrative is more constructive than the financial statements suggest.
VEVYE new prescriptions grew approximately 25% sequentially. Total prescriptions rose about 11% sequentially. The prescriber base expanded 12% sequentially, exiting March with roughly 14% branded market share — surpassing Xiidra in total prescriptions. TRIESENCE unit volume grew 136% year-on-year. The company doubled its sales force in Q1, hiring over 90 new professionals. That kind of structural build-out is expensive in the near term and shows up in negative EBITDA; it also seeds the revenue ramp for Q2 and beyond.
The $8 million Q1 revenue reduction tied to a gross-to-net modeling issue on VEVYE's coverage rollout is a one-time accounting adjustment, not a demand signal. Management reaffirmed full-year 2026 revenue guidance of $350 million to $365 million, with Q2 expected to land between $71 million and $81 million. If Q2 delivers at the midpoint of that range, it would represent nearly a doubling of Q1 revenue — a sequentially massive acceleration that the market is either underweighting or skeptical of. Coverage dynamics for VEVYE are expected to improve over the next 12 to 18 months, which is the structural driver. The IHEEZO ASC channel going to zero by year-end is a known headwind, requiring in-office use case substitution. That transition is the execution risk to watch.
The historical anchor worth citing here: in mid-2018, several specialty pharma companies with similar coverage-ramp dynamics saw their stock prices lag their prescription growth for two to three quarters before the revenue inflection became undeniable to consensus. The setup for HROW rhymes — strong unit economics building underneath a messy top-line quarter. The question is whether the prescriber base expansion sustains through Q2.
What the Afternoon Tape Actually Resolved — and What Carries Into Wednesday
Step back from the individual tickers and the picture that emerges is one of dispersion — the condition in which different names within the same macro regime produce dramatically different outcomes based on their specific exposure to the themes driving capital allocation. Today's tape had a China consumer recovery signal (JD margin expansion), a domestic AI data pipeline signal (Veritone VDR bookings), a specialty pharma inflection signal (HROW prescription growth), and an India infrastructure execution signal (K.P. Energy cash conversion). None of these are correlated. All of them are real.
That is precisely the kind of environment our earlier analysis of four earnings calls with a single misread thread described — a regime where the index level tells you almost nothing about where the real cross-asset opportunities are sitting. GOOGL at $384.92 is interesting, but it is not the story. The story is what happens to growth multiples if the 10-year drifts from 4.38% toward 4.5% over the next two weeks. At that threshold, the pressure on long-duration, back-half loaded stories — Veritone, Harrow, K.P. Energy — becomes more acute, and the relative value case shifts back toward cash-generative, near-term earners like JD.
Watch the 10-year at tomorrow's open. If it holds below 4.45%, the AI data trade and the specialty pharma prescription ramp both have room to build. If it breaks above 4.5%, expect rotation toward nearer-dated cash flows and further pressure on mega-cap growth names already in risk-off mode. The earnings tape gave you the candidates on both sides. The rate market will pick the winners.