
Understanding RSI Overbought and Oversold Levels
The Relative Strength Index (RSI) is one of the most widely used momentum indicators in technical analysis — and for good reason. At its core, the RSI helps traders answer a deceptively simple question: Is this asset being pushed too far, too fast? The answer lies in understanding what overbought and oversold levels actually mean and, more importantly, how to act on them without falling into common traps.
If you're new to the indicator itself, start with our Complete Beginner's Guide to RSI before diving into signal interpretation. For those already familiar with the basics, this article will take you well beyond the surface level.
What Do RSI Overbought and Oversold Actually Mean?
RSI is plotted on a scale from 0 to 100. The two critical thresholds that every trader learns first are:
- Overbought: RSI above 70 — suggests the asset may have risen too quickly and could be due for a pullback or reversal.
- Oversold: RSI below 30 — suggests the asset may have fallen too sharply and could be primed for a bounce or recovery.
These levels were popularized by J. Welles Wilder Jr., who introduced RSI in his 1978 book New Concepts in Technical Trading Systems. The 70/30 framework has stood the test of time, but understanding what these thresholds represent — and what they don't — is what separates profitable traders from frustrated ones.
"An RSI above 70 doesn't mean 'sell immediately.' It means momentum has been strong — and that strength can persist far longer than most traders expect."
The RSI measures the speed and magnitude of price changes over a lookback period (typically 14 periods). When gains consistently outpace losses over that window, RSI climbs toward 100. When losses dominate, it falls toward 0. To understand exactly how this math works, check out our detailed breakdown of How RSI Is Calculated: Formula Explained Step by Step.
The 70/30 Rule: A Starting Point, Not a Complete Strategy
Why RSI Above 70 Doesn't Always Mean "Sell"
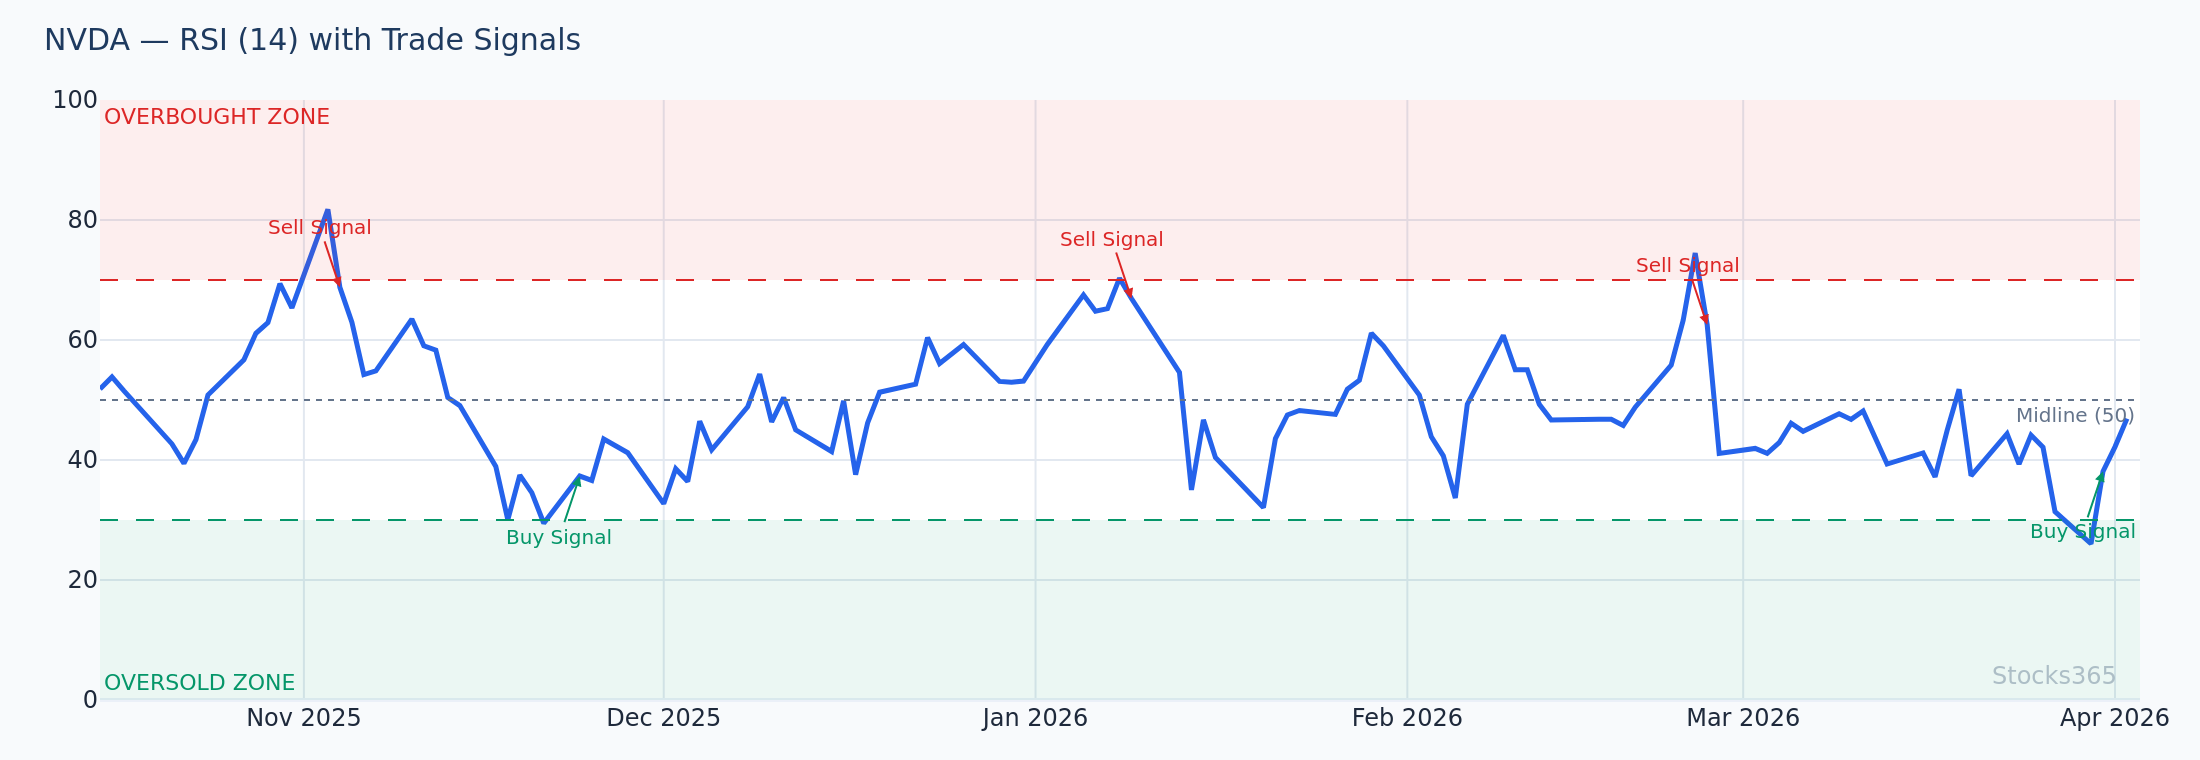
This is perhaps the most common and costly misconception among new traders. When NVIDIA (NVDA) surged through much of 2023 on AI-driven enthusiasm, its RSI spent weeks above 70 — sometimes touching 80 or even 85. Traders who mechanically sold every time RSI crossed 70 missed enormous upside moves.
In strongly trending markets, RSI can remain in overbought territory for extended periods. This is especially true for:
- High-momentum growth stocks during earnings seasons
- Broad market indices during bull market phases
- Commodities experiencing supply shocks
- Cryptocurrencies during parabolic rallies
The takeaway? RSI overbought signals are most reliable as reversal indicators in ranging or consolidating markets. In trending markets, they often function better as signals to tighten stops rather than exit entirely.
Why RSI Below 30 Doesn't Always Mean "Buy"
The same logic applies on the downside. A stock can become oversold on the RSI and continue falling — hard. Consider a company that misses earnings badly, faces regulatory action, or experiences a sector-wide selloff. RSI may drop below 30, then below 20, and even approach 10 before any meaningful recovery occurs.
Catching a "falling knife" based purely on an oversold RSI reading has wiped out many trading accounts. An RSI oversold signal is a condition, not a buy order. Context is everything.
How to Read RSI Overbought and Oversold Signals Correctly
1. Confirm with Price Action
Never act on an RSI reading in isolation. Always look at what the price chart is actually doing. When RSI enters oversold territory and you simultaneously see:
- A bullish candlestick reversal pattern (hammer, engulfing, doji at support)
- Price touching a major support level or demand zone
- Declining volume on the sell-off
...the oversold RSI signal becomes significantly more credible. Price action confirmation is the filter that transforms a raw RSI reading into a tradeable setup.
2. Look for RSI Divergence
One of the most powerful applications of RSI overbought and oversold analysis is divergence. This occurs when price and RSI move in opposite directions:
- Bearish Divergence: Price makes a higher high, but RSI makes a lower high. This signals weakening momentum even as price climbs — a warning that overbought conditions may lead to a genuine reversal.
- Bullish Divergence: Price makes a lower low, but RSI makes a higher low. This signals strengthening momentum despite falling prices — a high-probability oversold bounce setup.
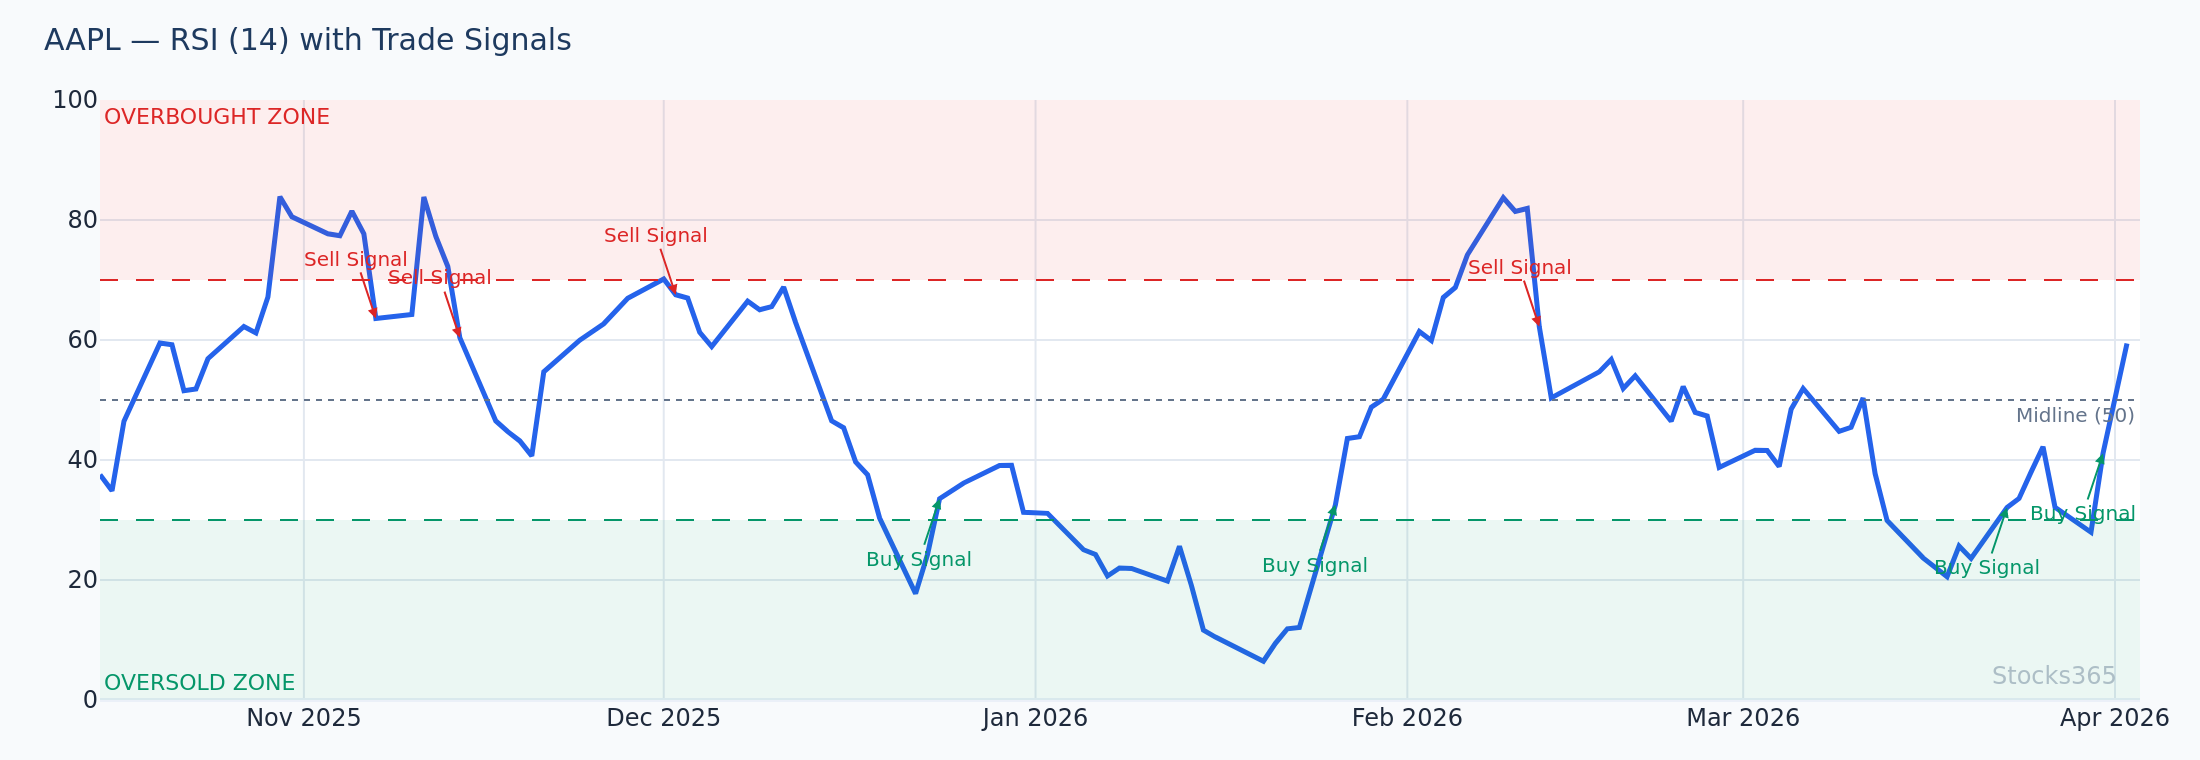
For example, if Apple (AAPL) is trading at $195 and RSI reaches 72, but then rallies to $198 while RSI only reaches 68, that bearish divergence is a much stronger sell signal than a simple overbought reading would be on its own.
3. Adjust Thresholds for Different Market Conditions
Wilder's original 70/30 levels aren't sacred. Many professional traders adjust them based on the prevailing market trend:
- In a bull market or uptrend: Consider using 80/40 thresholds. RSI rarely falls below 40 in strong uptrends, and overbought conditions may need to reach 80 before they're truly extended.
- In a bear market or downtrend: Consider using 60/20 thresholds. RSI rarely rises above 60 in strong downtrends, so hitting that level can signal a shorting opportunity.
- In a sideways or ranging market: The standard 70/30 thresholds perform best here, as price regularly oscillates between extremes.
This adaptive approach requires you to first identify the prevailing trend using tools like moving averages or trendlines before interpreting the RSI signal.
4. Use Multi-Timeframe Analysis
An RSI oversold reading on a 15-minute chart carries far less weight than one on a daily or weekly chart. Smart traders layer their analysis:
- Weekly RSI oversold + Daily RSI oversold: High-conviction long setup
- Daily RSI overbought + Hourly RSI overbought: High-conviction short or exit setup
- Weekly RSI neutral + Daily RSI oversold: Moderate setup — proceed with caution
When higher timeframe RSI confirms the same condition as your trading timeframe, the probability of a meaningful move increases substantially.
Practical Trading Examples Using RSI Overbought and Oversold Signals
Example 1: RSI Oversold Bounce on Tesla (TSLA)
Imagine TSLA has been selling off for three weeks and is trading at $180. The daily RSI drops to 24 — firmly in oversold territory. You check the weekly RSI and it's at 32, also approaching oversold. Price is sitting on a long-term horizontal support level that has held three times in the past two years. Volume on the most recent down days has been declining.
Action: You wait for a confirming bullish candlestick — say, a hammer on the daily chart — before entering long at $181.50. You set a stop-loss below the recent swing low at $176 and target the next resistance zone around $200, giving you a roughly 3.7:1 reward-to-risk ratio.
This isn't a blind "RSI says oversold, buy" trade. It's a multi-factor confluence setup where RSI is one confirming piece of evidence.
Example 2: RSI Overbought with Bearish Divergence on Microsoft (MSFT)
MSFT has rallied from $380 to $420 over six weeks. RSI hit 76 at the $410 level, then pulled back slightly as price consolidated, before MSFT pushed to $420. But this time, RSI only reaches 71 — a classic bearish divergence. Price made a higher high; RSI made a lower high.
Action: You watch for a break below the consolidation range low around $415. Once that breaks, you enter a short (or reduce long exposure) at $414, stop above the recent high at $421, and target the next support zone near $400. Risk: $7. Reward: $14. A 2:1 ratio with high-quality signal backing it.
Common RSI Overbought/Oversold Mistakes to Avoid
Mistake 1: Trading RSI Signals Against a Strong Trend
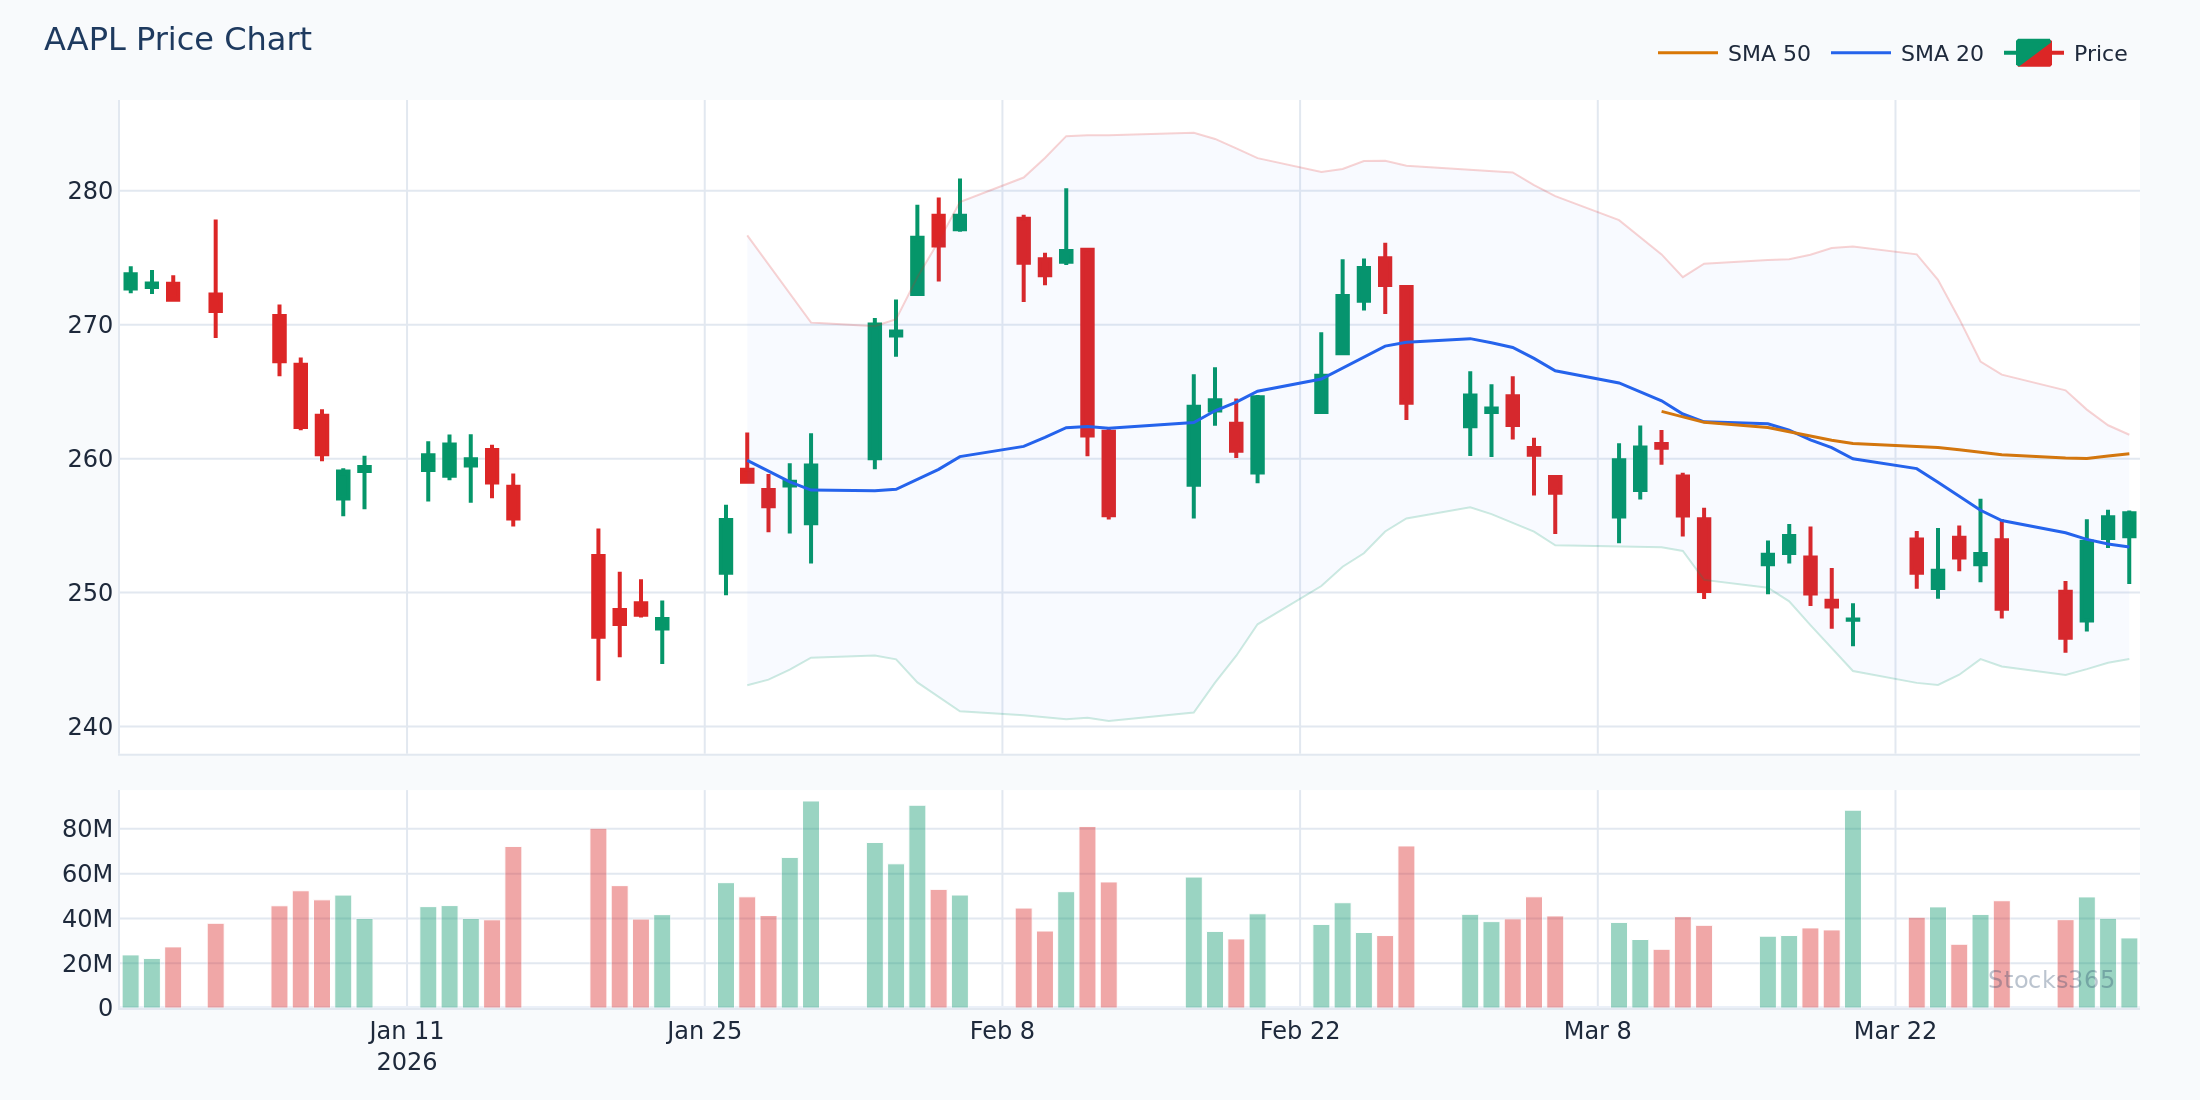
As discussed, RSI overbought/oversold signals lose significant reliability when traded against the primary trend. Always identify the trend first. If the 50-day moving average is sloping steeply upward and price is above it, be very cautious about shorting an overbought RSI signal.
Mistake 2: Using RSI on Illiquid Assets
RSI calculations can produce misleading readings on thinly traded stocks where price gaps and erratic moves distort the underlying momentum picture. Stick to liquid, high-volume assets for the most reliable RSI signals.
Mistake 3: Ignoring the Bigger Picture
An oversold RSI on a fundamentally broken company — say, one facing bankruptcy or a major fraud investigation — is not a buying opportunity. Technical signals must be contextualised within the broader fundamental and macro environment. RSI measures price momentum; it says nothing about whether a company deserves to be valued higher.
Mistake 4: Using Only RSI Without Confluence
RSI is a powerful tool, but it's one instrument in an orchestra. The best traders combine RSI with support/resistance levels, volume analysis, moving averages, and candlestick patterns. On the Stocks365 signals dashboard, our trust score system does exactly this — weighting RSI signals alongside multiple other technical factors to give you a composite confidence rating rather than a single-indicator knee-jerk signal.
RSI Period Settings: Does Changing 14 Periods Affect Overbought/Oversold Readings?
The default 14-period RSI setting is standard, but adjusting it changes the sensitivity of your overbought and oversold signals:
- Shorter periods (e.g., 7 or 9): RSI becomes more sensitive, crosses the 70/30 thresholds more frequently, and generates more signals — including more false ones. Better for short-term scalpers.
- Longer periods (e.g., 21 or 25): RSI becomes smoother and slower, crossing thresholds less frequently but with higher reliability. Better for swing traders and position traders.
For most traders, especially those focusing on daily charts, the 14-period default strikes the right balance. Avoid over-optimizing your RSI period to fit historical data — this leads to curve-fitting and poor live performance.
Using the Stocks365 Platform to Trade RSI Signals
Manually scanning hundreds of stocks for RSI overbought and oversold conditions is time-consuming and impractical. This is where the Stocks365 platform adds real value. Our algorithmic signal engine continuously monitors RSI readings across thousands of assets and cross-references them with price action, volume, and trend data.
When you view a signal for a specific stock — for example, the Apple (AAPL) signal page — you'll see not just the raw RSI value, but how it integrates with our multi-factor trust score. A high trust score on an oversold RSI signal means the algorithm has identified multiple confirming factors, dramatically improving signal quality over raw RSI alone.
This eliminates the guesswork and helps you focus your attention on the setups that genuinely meet high-probability criteria, rather than chasing every RSI dip below 30 or pop above 70.
Key Takeaways
RSI Overbought and Oversold — What You Need to Remember:
- RSI above 70 signals overbought conditions; RSI below 30 signals oversold conditions — but neither is a standalone trade trigger.
- In strong trends, RSI can remain in extreme zones for extended periods. Never trade RSI signals blindly against a trend.
- RSI divergence (price and RSI moving in opposite directions) is one of the most powerful and reliable signal combinations available.
- Adjust your thresholds (80/40 in uptrends, 60/20 in downtrends) to better match market conditions.
- Always confirm RSI signals with price action, volume, and support/resistance analysis.
- Multi-timeframe confirmation dramatically improves the reliability of any RSI overbought or oversold signal.
- The Stocks365 trust score system integrates RSI with multiple factors for higher-quality, context-aware signals.
Frequently Asked Questions
What is considered overbought and oversold on the RSI?
The standard thresholds are RSI above 70 for overbought and RSI below 30 for oversold, as established by J. Welles Wilder Jr. However, many experienced traders adjust these to 80/20 for stricter signals with fewer false positives, or use 80/40 and 60/20 depending on whether the market is in an uptrend or downtrend. The right threshold depends on your trading style, the asset class, and the prevailing market environment.
Should I always sell when RSI is overbought?
No — and this is one of the most important lessons in RSI trading. An overbought RSI simply means momentum has been strongly to the upside; it does not guarantee an imminent reversal. In trending markets, RSI can stay above 70 for weeks or months. Instead of automatically selling, use the overbought reading as a warning signal to look for additional confirmation — such as bearish divergence, a break of support, or a reversal candlestick pattern — before taking action.
What is RSI divergence and why does it matter?
RSI divergence occurs when the price of an asset and the RSI indicator move in opposite directions. Bearish divergence happens when price makes a higher high but RSI makes a lower high — signaling weakening upside momentum often seen in overbought conditions. Bullish divergence occurs when price makes a lower low but RSI makes a higher low — signaling strengthening momentum in oversold conditions. Divergence is considered one of the most reliable RSI signals because it reveals the underlying momentum is disagreeing with price, often preceding a meaningful reversal.
What RSI period setting is best for overbought and oversold signals?
The default 14-period RSI is the most widely used and broadly reliable setting for daily charts. Shorter periods (7–9) generate more frequent signals but with more noise, making them better suited for short-term or intraday traders. Longer periods (21–25) generate fewer, smoother signals better suited to swing traders and investors. Rather than aggressively optimizing the period, most traders are better served by focusing on multi-timeframe confirmation and combining RSI with other technical tools.
Can RSI stay overbought or oversold for a long time?
Absolutely yes. This surprises many newer traders. During strong bull markets, a stock's RSI can remain above 70 for weeks or even months, especially in high-momentum sectors. Similarly, during sharp bear markets or company-specific crises, RSI can languish in oversold territory for extended periods. This is why overbought and oversold RSI readings must always be interpreted in the context of the prevailing trend. Sustained overbought conditions during an uptrend are a sign of strength, not an automatic sell signal.