
Why Bollinger Bands Alerts Change Everything
Missing a signal costs money. That's just reality. You spent time building a setup, identified the pattern, and then walked away from your screen — only to return and find the move already happened without you.
Bollinger Bands alerts fix this. But only if you configure them correctly.
Most traders set alerts wrong. They trigger too early, too late, or on noise that leads nowhere. This guide walks through the exact setups that work — the alert conditions, the confirmation layers, and the filters that separate real signals from false ones.
Understanding Bollinger Bands Before You Set Alerts
Bollinger Bands consist of three lines: a 20-period simple moving average in the center, and two outer bands placed two standard deviations above and below. The bands expand during volatility and contract during consolidation. That expansion and contraction is the core of every alert worth setting.
The band width tells you the volatility state. The price position relative to the bands tells you the momentum state. Together, they produce three primary alert conditions every serious trader monitors.
The Three Core Bollinger Bands Alert Conditions
- Band touch or breach: Price closes above the upper band or below the lower band
- Bollinger Squeeze: Band width compresses below a threshold, signaling a coming expansion
- Middle band reclaim: Price crosses back above or below the 20-SMA after a band touch
Each condition requires a different alert trigger and a different response. Confusing them is where most traders go wrong.
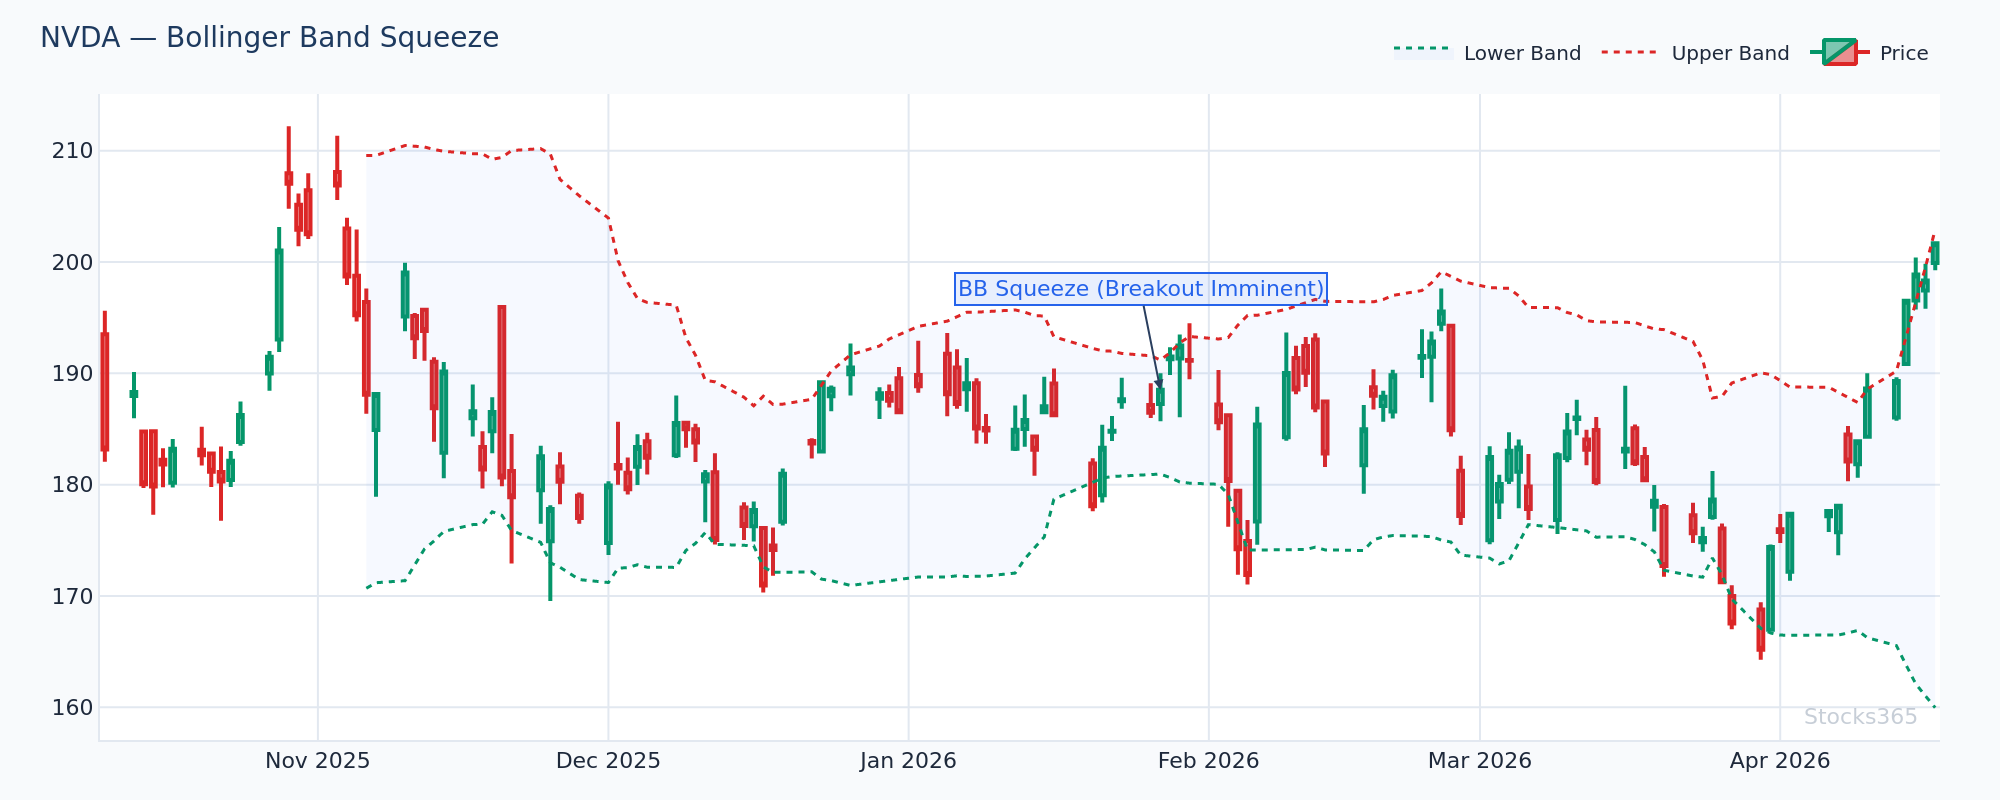
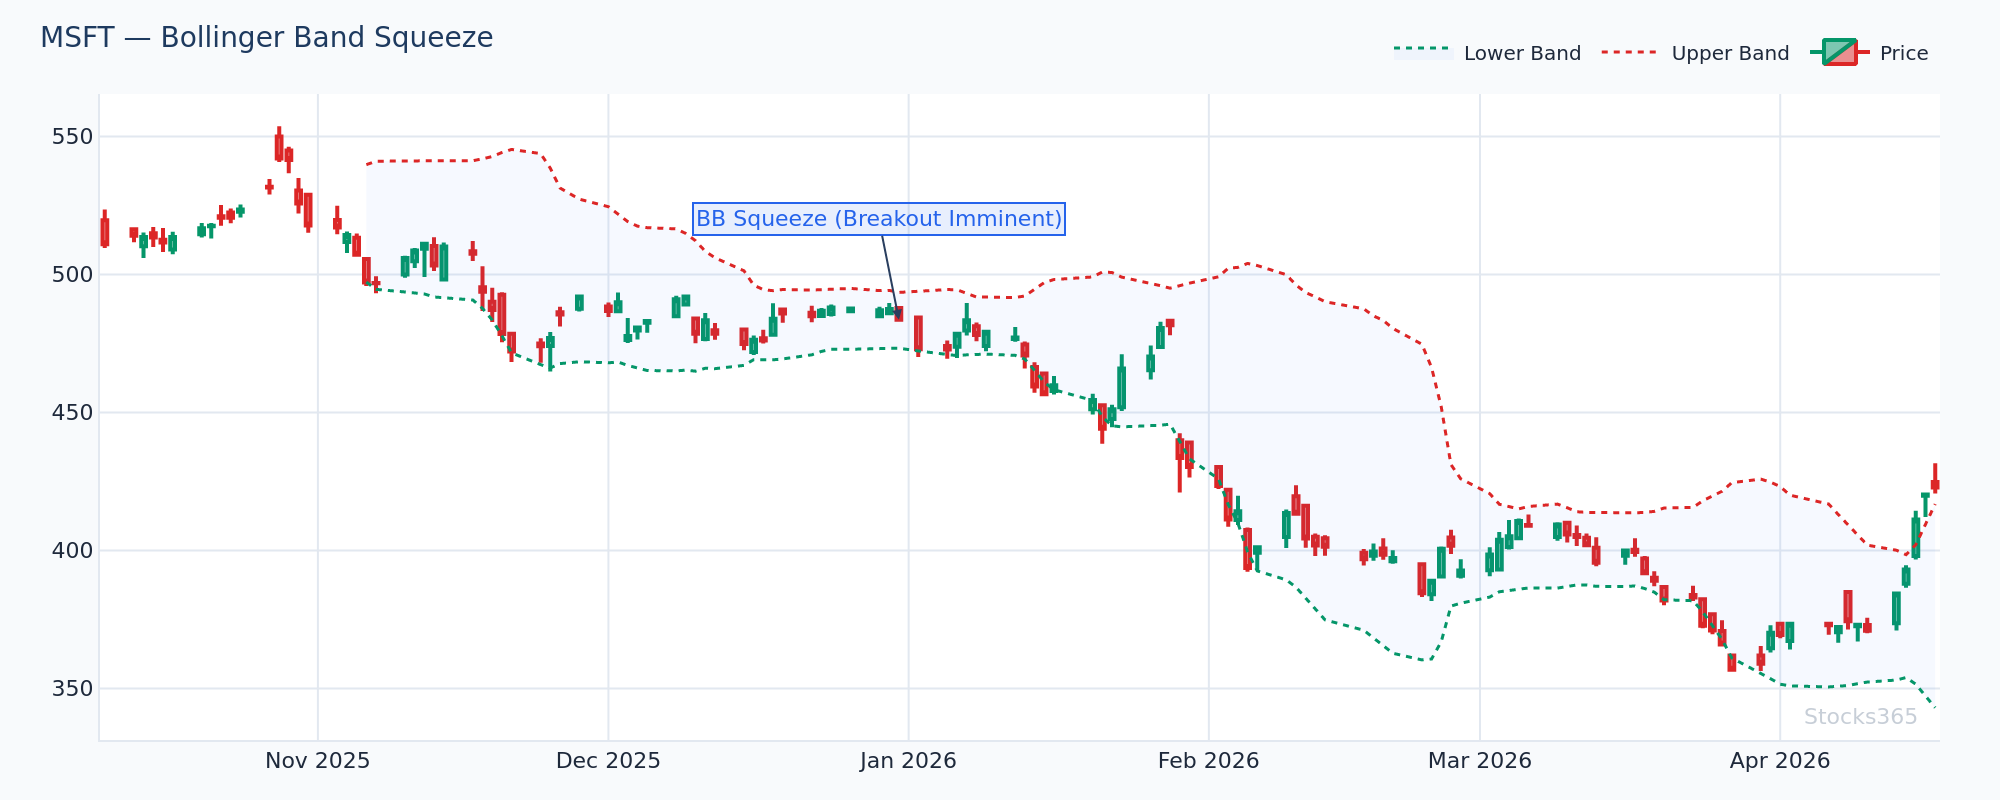
This chart shows band width at its lowest reading in the prior 60 sessions — a classic pre-breakout compression. The key detail is where price sits within the squeeze: near the upper half of the range signals bullish bias, near the lower half signals bearish. The pattern confirms when price closes decisively outside the bands on above-average volume. It invalidates if price stalls at the midline and reverts.
How to Set Up Bollinger Bands Alerts on Any Platform
The mechanics are straightforward. The strategy behind them is not.
Alert Setup for Band Touches
Set your alert to trigger when the closing price crosses above the upper Bollinger Band (20, 2) or below the lower band. Do not alert on intrabar touches — closing price only. Intrabar triggers produce far more false positives than they're worth.
Add a volume condition wherever your platform allows. A band touch with volume below the 20-day average volume is low-conviction. A band touch with volume 1.5x or higher than average demands attention.
Alert Setup for the Bollinger Squeeze
A squeeze alert triggers when Bollinger Band Width — calculated as (Upper Band minus Lower Band) divided by the Middle Band — drops below a defined threshold. Most platforms let you set this as a custom indicator alert. The common threshold is the lowest band width reading in 20 or 60 sessions.
This is arguably the highest-value alert in the Bollinger Bands toolkit. Squeezes precede major moves. The direction isn't always clear, but the magnitude often is.
Alert Setup for Middle Band Reclaims
Set an alert when price crosses back above the 20-SMA after having touched the lower band, or crosses back below the 20-SMA after touching the upper band. This middle band reclaim is a trend-following entry trigger used by professional swing traders.
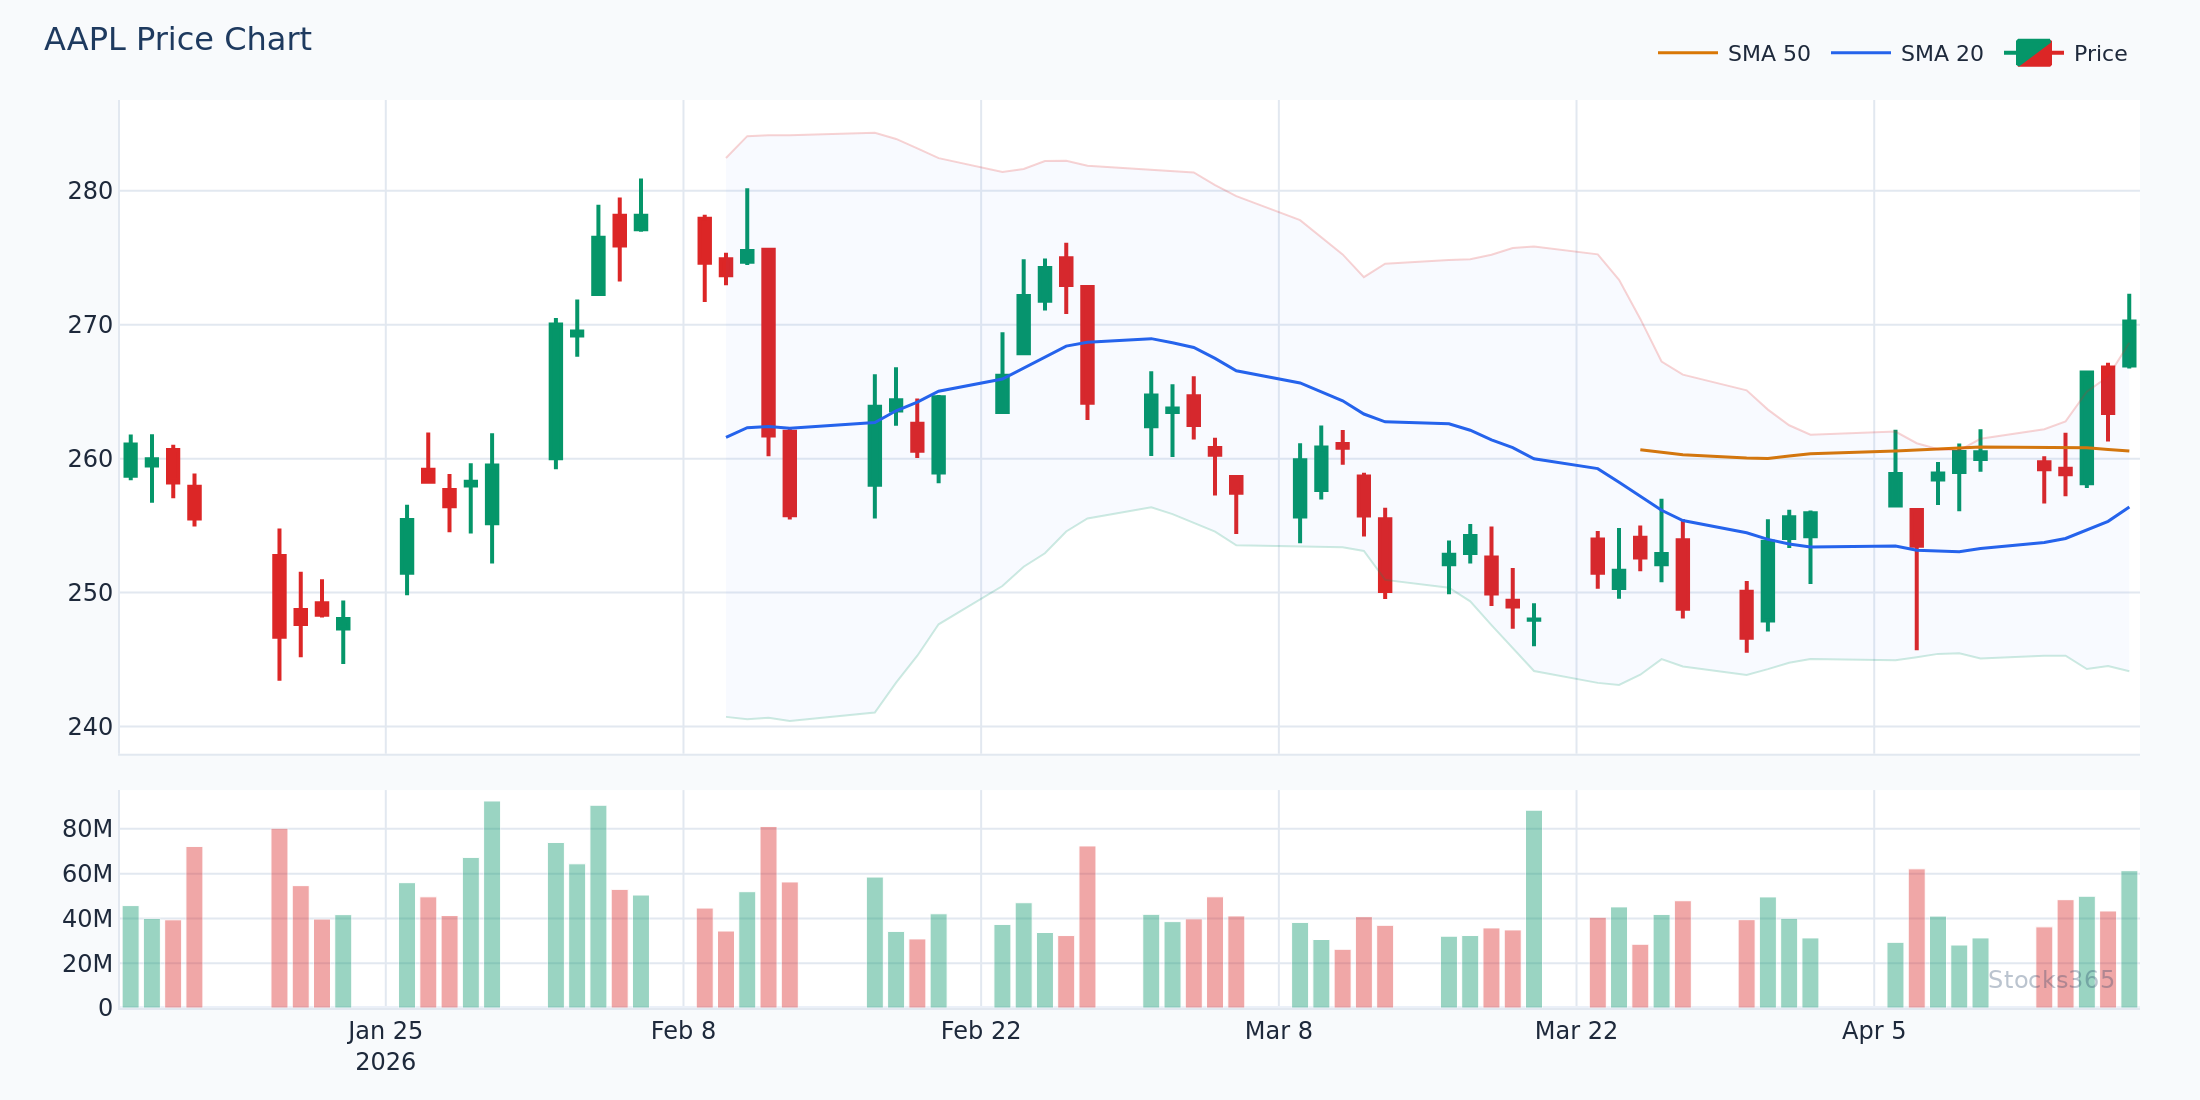
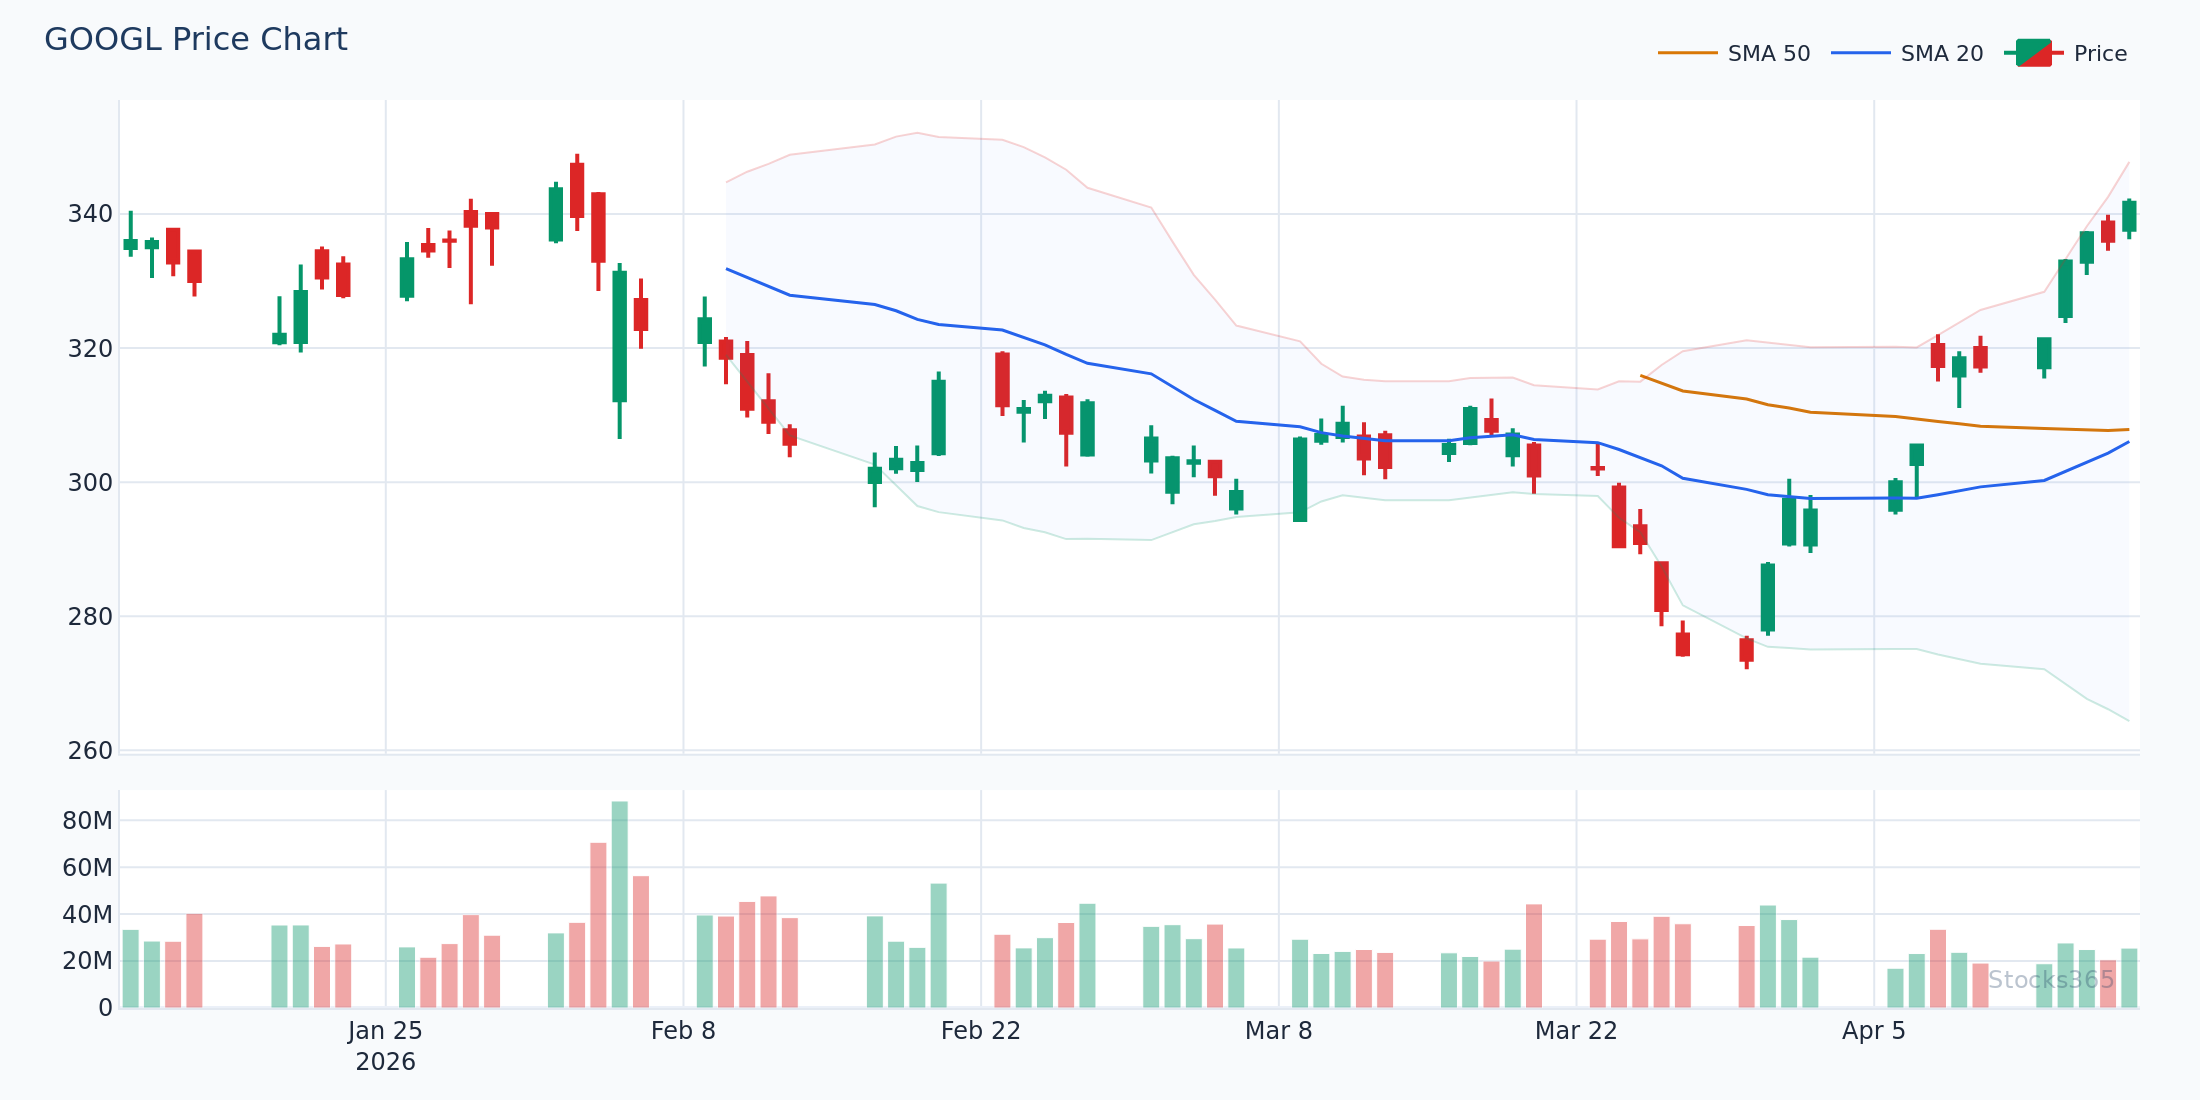
The chart shows a clear sequence: price tags the lower band, consolidates for two to three sessions, then reclaims the 20-SMA on a green candle with expanding volume. This reclaim is the entry trigger, not the band touch itself. The setup fails if price reclaims the middle band but immediately reverses back below on the next candle — that chop signals the trend is not ready to resume.
Here's What Most Traders Get Wrong
Most traders treat an upper band touch as an automatic sell signal. It isn't. In trending markets, price can ride the upper band for days or weeks — touching and closing above it repeatedly as momentum carries the move. An upper band touch in isolation is not a reversal signal. It's a volatility signal.
The edge is in what happens after the touch. Does price close back below the band the next session? Does RSI roll over from overbought while the band touch occurs? Does volume dry up on the second or third touch? Those are the reversal signals. The band touch itself just gets you watching.
Alert on the touch. Trade the confirmation.
Combining Bollinger Bands Alerts With RSI for Higher Accuracy
No alert system works in isolation. Bollinger Bands tell you where price is relative to its volatility range. RSI tells you the momentum state. Together, they filter out a significant portion of false signals.
The setup: set your Bollinger Bands alert to notify you of a band touch, then check RSI before acting. If price touches the upper band and RSI is above 70, you have agreement — but watch for RSI to begin rolling over before entering a short. If price touches the lower band and RSI is below 30, you have a potential oversold bounce setup. For a complete breakdown of how RSI overbought and oversold levels work as confirmation tools, read our guide on RSI Overbought and Oversold Levels: Master the Signals.
The RSI Divergence + Bollinger Band Touch Combo
This is one of the cleanest setups in technical analysis. Price makes a new high and touches or exceeds the upper Bollinger Band, but RSI makes a lower high. That divergence — price strong, momentum weakening — frequently precedes reversals. The same logic applies in reverse at the lower band.
Set your Bollinger Bands alert first. When it fires, check immediately for RSI divergence. If divergence exists, you have a high-quality short-list candidate. To go deeper on this technique, the guide on RSI Divergence Explained: Master Bullish & Bearish Signals covers every variation in detail.
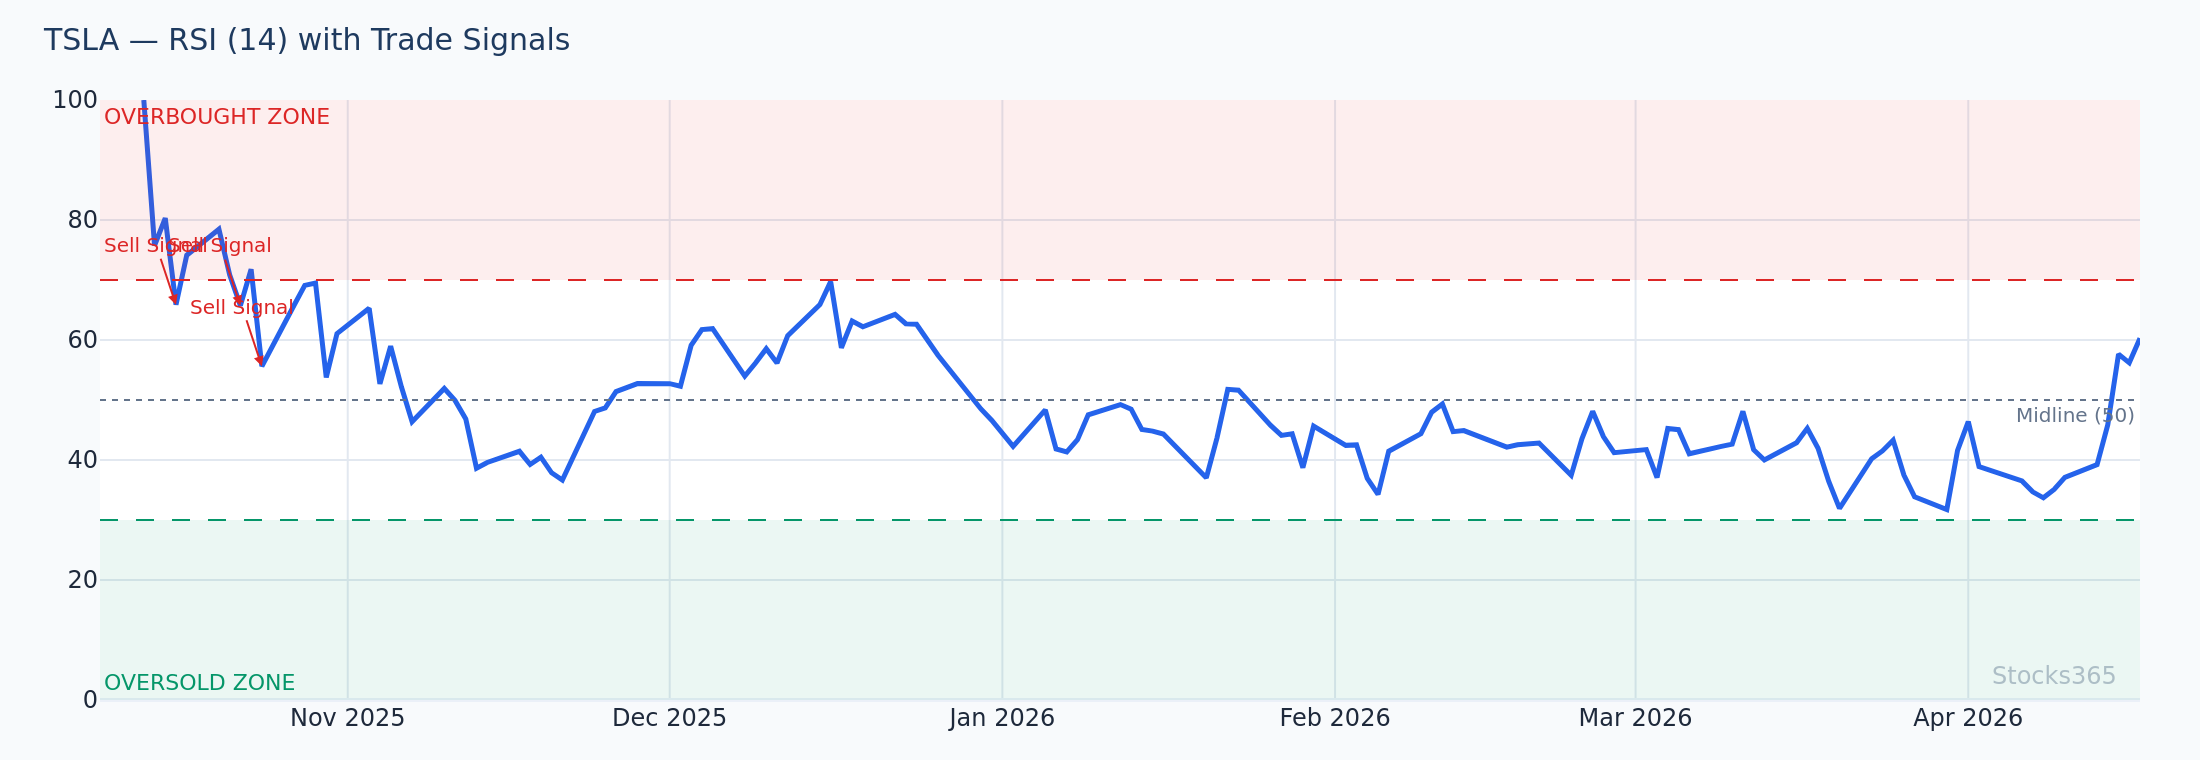
The RSI panel shows momentum declining even as price pushes into the upper band for a second touch — a textbook bearish divergence. This combination doesn't guarantee a reversal, but it raises the probability significantly above a band touch alone. Confirmation comes from a close back inside the band on above-average volume. The setup is invalidated if RSI holds above 60 and price closes at or above the prior high.
Bollinger Squeeze Alerts: The Setup With the Most Asymmetric Potential
Squeezes are where the real opportunity lives. When volatility compresses to multi-month lows, the subsequent expansion tends to be sharp and sustained. Setting a squeeze alert means you're positioned before the move begins — not chasing it after the fact.
Our analysis of 14,266 Bollinger Squeeze Breakout signals found a profit factor of 1.03 over a 10-day holding period, with crypto performing best at 51.8% win rate. That's not a home-run stat — but it reflects genuine edge when the squeeze is real and the breakout confirms on volume. See the full dataset at Stocks365 Insights for the asset-class breakdown.
Configuring the Squeeze Alert Correctly
Don't alert on every low band-width reading. Alert on readings that are historically extreme for that specific instrument. A band-width reading that's low for a normally volatile crypto may be normal for a blue-chip stock. Calibrate your threshold per asset.
The process: calculate band width over 20 periods. Set your alert at the 20th percentile of band-width readings over the past 252 sessions. When that threshold breaks lower, the alert fires. That's a squeeze alert with context.
Direction Bias After a Squeeze
Squeezes don't predict direction — they predict magnitude. But you can build directional bias using the position of price within the squeeze range and the slope of the 20-SMA. A rising 20-SMA with price in the upper half of the squeeze range suggests bullish resolution. A declining 20-SMA with price in the lower half suggests bearish. Neither is certain. Both improve the odds.
The setup here shows band width at a 60-session low while price holds above a rising 20-SMA. This combination creates a bullish tilt to the squeeze — the expansion is more likely to resolve upward based on the trend structure, though any breakout requires volume confirmation above average. The setup fails if price breaks below the 20-SMA before the expansion begins, signaling that the bears are controlling the squeeze resolution.
Multi-Timeframe Bollinger Bands Alert Strategy
Single-timeframe alerts miss context. A daily upper band touch that aligns with a weekly overbought condition is a far higher-quality reversal candidate than a daily upper band touch in the middle of a weekly uptrend.
Structure your alerts in layers. Set primary alerts on the daily timeframe. When they fire, check the weekly chart for trend alignment and the 4-hour chart for entry precision. This three-timeframe approach filters noise at the daily level and improves your entry timing.
Timeframe Hierarchy for Bollinger Bands Alerts
- Weekly: Trend and regime — is price in a broad uptrend or downtrend? Where are the weekly Bollinger Bands?
- Daily: Primary signal — where your alerts fire, where you identify setups
- 4-hour or 1-hour: Entry precision — where you time the exact entry after the daily alert confirms
This hierarchy prevents one of the most common alert mistakes: acting on a daily signal that runs counter to the weekly trend. Those trades lose more often than they win.
Asset Class Considerations for Bollinger Bands Alerts
Bollinger Bands don't behave the same across asset classes. This matters enormously for alert configuration.
Stocks365 research across 3,255 upper band touch signals found a 49.6% win rate overall — but crypto outperformed at 56.7% while commodities lagged at 41.5%. That gap isn't random. Crypto markets are more mean-reverting at extremes in certain conditions, while commodity markets frequently trend hard after band touches rather than reverting. The full breakdown is available at Stocks365 Insights.
The practical implication: tune your alert response by asset class. A crypto upper band touch deserves a reversal alert response. A commodity upper band touch may warrant a trend-continuation watchlist rather than a fade setup.
What to Watch For
- Bollinger squeeze breakouts on technology stocks: When band width drops below the 20th percentile historically for a given stock, watch for the subsequent expansion. The breakout candle with volume 1.5x or higher than average often signals the start of a 2-3 ATR directional move worth trading.
- Double band touch rejections in crypto: When crypto assets touch the upper band twice within five to eight sessions but fail to close above the prior high, and RSI prints a lower high on the second touch, the reversal probability increases meaningfully — especially in assets that have run 30%+ in the prior 20 sessions.
- Middle band reclaims after extended lower band walks: When price has closed at or below the lower band for three or more consecutive sessions, the first clean close back above the 20-SMA on above-average volume is historically a higher-probability bounce entry than catching the lower band touch itself.
- Squeeze alerts on ETFs before earnings season: Broad index ETFs that enter squeeze conditions ahead of concentrated earnings periods often produce sharp, sustained expansions. The squeeze compresses implied volatility before the fundamental catalyst unleashes it.
- Band width divergence on correlated pairs: If two historically correlated stocks show different band width readings — one in squeeze, one in expansion — the squeeze stock frequently catches up to the expanding stock's volatility within two to three weeks. This creates a predictive alert condition.
Building a Complete Bollinger Bands Alert System
The goal is a tiered alert system that does the scanning for you. Here's the architecture.
Tier 1: Squeeze Alerts (Anticipatory)
These fire before the move. Set them across your full watchlist. When they fire, add the ticker to an active monitoring list. You're not trading yet — you're preparing.
Tier 2: Breakout Alerts (Entry Trigger)
These fire when price closes outside the bands with volume confirmation. This is your primary action trigger. Check RSI alignment, check the broader timeframe, and if confirmation exists, this is where you engage. The Stocks365 signals dashboard aggregates these conditions across thousands of instruments so you're not building every alert from scratch.
Tier 3: Reclaim Alerts (Secondary Entry)
Missed the initial breakout? The middle band reclaim gives a second opportunity on trend resumption. These alerts fire when price — after an extended period outside the bands — crosses back through the 20-SMA. Lower risk, slightly lower reward, but still a valid entry point.
Three tiers. Three alert types. One system that covers anticipation, entry, and recovery setups across any market.
If you want to layer in additional oscillator confirmation, the comparison in RSI vs Stochastic Oscillator: The Essential Guide shows how each indicator complements band-based alerts differently. For signals on specific stocks, individual pages like AAPL signals show how these conditions align in real time.
This chart illustrates all three alert tiers in sequence: the squeeze compression alert fired first as band width hit a 45-session low; the breakout alert fired on the candle that closed above the upper band with 2.1x average volume; and the reclaim alert would have provided a secondary entry when price pulled back to the 20-SMA and bounced on the following session. Each tier serves a distinct purpose and requires a distinct response. Seeing all three play out confirms the full signal sequence is intact.
How Stocks365 Uses This
Stocks365 Trust Score Integration
Bollinger Bands conditions are one of 12+ indicators embedded in the Stocks365 trust score system. When a Bollinger Squeeze Breakout triggers on a given instrument, that event contributes to the volatility scoring layer of the trust score — flagging the asset as entering a high-energy phase requiring elevated attention.
Upper band touches and lower band touches feed into the regime scoring layer, helping classify whether an asset is in a trending or mean-reverting environment. This classification changes which signals the system weights more heavily for that instrument in the days following the alert.
When Bollinger Band signals align with RSI conditions — such as an upper band touch coinciding with an RSI overbought reading confirmed by divergence — the trust score reflects that multi-indicator agreement, surfacing those setups with higher confidence ratings on the Stocks365 signals dashboard. Single-indicator signals receive lower weighting; confluence events receive higher weighting. That's the core logic.
Key Takeaways
- Set closing-price alerts, not intrabar: Intrabar Bollinger Band touches produce excessive false positives. Always trigger on close.
- Volume is non-negotiable confirmation: A band touch without above-average volume is low-conviction. Always cross-reference.
- Squeezes predict magnitude, not direction: Use 20-SMA slope and price position within the squeeze range to establish directional bias.
- Asset class matters: Crypto band touches historically show higher mean-reversion rates than commodities or forex. Configure alert responses accordingly.
- RSI divergence at band extremes is the highest-quality filter: A band touch with RSI divergence is significantly higher probability than a band touch alone.
- Use three tiers: Squeeze alerts anticipate, breakout alerts trigger entries, reclaim alerts provide secondary opportunities.
- Multi-timeframe alignment improves every alert: Daily signal, weekly trend context, intraday entry precision.