
RSI vs Stochastic Oscillator: Which Momentum Indicator Should You Use?
Momentum indicators are the backbone of technical analysis, and two of the most widely used tools in any trader's arsenal are the Relative Strength Index (RSI) and the Stochastic Oscillator. While both measure momentum and help identify overbought and oversold conditions, they work in fundamentally different ways — and knowing when to use each can be the difference between a profitable trade and a costly mistake.
In this comprehensive guide, we'll break down the mechanics, signals, strengths, and weaknesses of both indicators, compare them head-to-head across real market scenarios, and show you exactly when each one gives you a genuine edge. Whether you're a swing trader navigating volatile markets or a day trader scalping momentum moves, this RSI vs Stochastic breakdown will sharpen your technical toolkit.
Key Insight: Neither RSI nor the Stochastic Oscillator is universally superior. The best indicator depends on market conditions, your timeframe, and the asset you're trading. Most professional traders use both — and know when to trust which.
Understanding RSI: The Momentum Powerhouse
The Relative Strength Index, developed by J. Welles Wilder Jr., measures the speed and magnitude of recent price changes to evaluate whether an asset is overbought or oversold. It's a single-line oscillator that moves between 0 and 100, with traditional signal thresholds at 70 (overbought) and 30 (oversold).
If you want a deep dive into exactly how the math works, our guide on How RSI Is Calculated: Formula Explained Step by Step walks through every component. The short version: RSI compares average gains to average losses over a set period — typically 14 periods — and plots the result as a ratio scaled from 0 to 100.
RSI Key Characteristics
- Default period: 14 (days, hours, or candles depending on your timeframe)
- Range: 0 to 100
- Overbought signal: Above 70
- Oversold signal: Below 30
- Best for: Trending markets, divergence analysis, momentum confirmation
- Smoothing: Uses exponential smoothing (Wilder's smoothing method)
RSI is particularly powerful for divergence trading — identifying when price and momentum diverge from each other, which can signal early trend reversals. Our article on RSI Divergence Explained: Master Bullish & Bearish Signals covers this concept in full detail, including how to spot both classic and hidden divergence patterns.
Understanding the Stochastic Oscillator: The Range Specialist
The Stochastic Oscillator was developed by George Lane in the late 1950s. Unlike RSI, which focuses on price change velocity, the Stochastic measures where the current closing price sits relative to the high-low range over a set period. The logic is simple: in an uptrend, prices tend to close near the highs of their range, and in a downtrend, near the lows.
The Stochastic produces two lines: %K (the fast line) and %D (the slow line, which is a moving average of %K). Crossovers between these two lines generate buy and sell signals, adding a layer of confirmation that RSI doesn't natively provide.
Stochastic Oscillator Key Characteristics
- Default settings: %K period = 14, %D = 3-period SMA of %K, Slowing = 3
- Range: 0 to 100
- Overbought signal: Above 80
- Oversold signal: Below 20
- Best for: Range-bound markets, short-term reversals, crossover signals
- Smoothing: Uses a simple moving average for %D line
The Stochastic's dual-line structure makes it particularly useful for timing entries. When %K crosses above %D in oversold territory (below 20), it's a bullish signal. When %K crosses below %D in overbought territory (above 80), it signals potential downside momentum.
RSI vs Stochastic: The Core Differences Explained
Now that we understand each indicator individually, let's compare them directly across the dimensions that matter most to traders.
1. What They Actually Measure
This is the most fundamental distinction in the RSI vs Stochastic debate:
- RSI measures the momentum of price change — how fast and how far price has moved relative to its own recent history. It's essentially an internal strength gauge.
- Stochastic measures the position of the closing price within a recent high-low range. It tells you where price is sitting relative to its recent extremes.
In practical terms, RSI answers: "How strong is this move?" The Stochastic answers: "Is price stretched relative to where it's been?"
2. Signal Speed and Sensitivity
The Stochastic Oscillator is significantly more sensitive than RSI. It reacts faster to price changes and generates more signals — which is both a strength and a weakness. More signals mean more trading opportunities, but also more false positives, especially in volatile markets.
RSI, with its exponential smoothing, is more deliberate and filtered. It generates fewer signals, but those signals tend to carry more weight. This makes RSI better suited for swing traders and position traders who want high-quality setups over high-frequency ones.
You can adjust RSI's sensitivity through period settings — something we cover in depth in our guide to RSI Settings: Master the Best Period for Your Strategy.
3. Trending vs. Range-Bound Markets
This is perhaps the most important practical difference between the two indicators:
- RSI excels in trending markets. In a strong uptrend, RSI can remain in overbought territory for extended periods without generating false sell signals. Experienced traders know to look for RSI maintaining above 50 as a trend continuation signal rather than triggering reversal trades at 70.
- Stochastic excels in range-bound markets. When price is oscillating between defined support and resistance, the Stochastic's sensitivity and crossover signals work beautifully, capturing reversal after reversal at the range extremes.
Pro Tip: Before applying either indicator, identify the current market structure. Use RSI in trending conditions and Stochastic in sideways, choppy markets. When in doubt, use both and look for confluence.
4. Signal Types
- RSI signals: Overbought/oversold levels, bullish/bearish divergence, centerline (50) crossovers, hidden divergence
- Stochastic signals: Overbought/oversold levels, %K/%D crossovers, divergence, bullish/bearish setups within extreme zones
RSI's divergence capability is one of its standout advantages. When price makes a new high but RSI makes a lower high, it warns of weakening momentum before the reversal becomes obvious. For advanced divergence techniques, see our piece on Hidden RSI Divergence: The Advanced Signal Most Traders Miss.
Practical Trading Examples: RSI vs Stochastic in Action
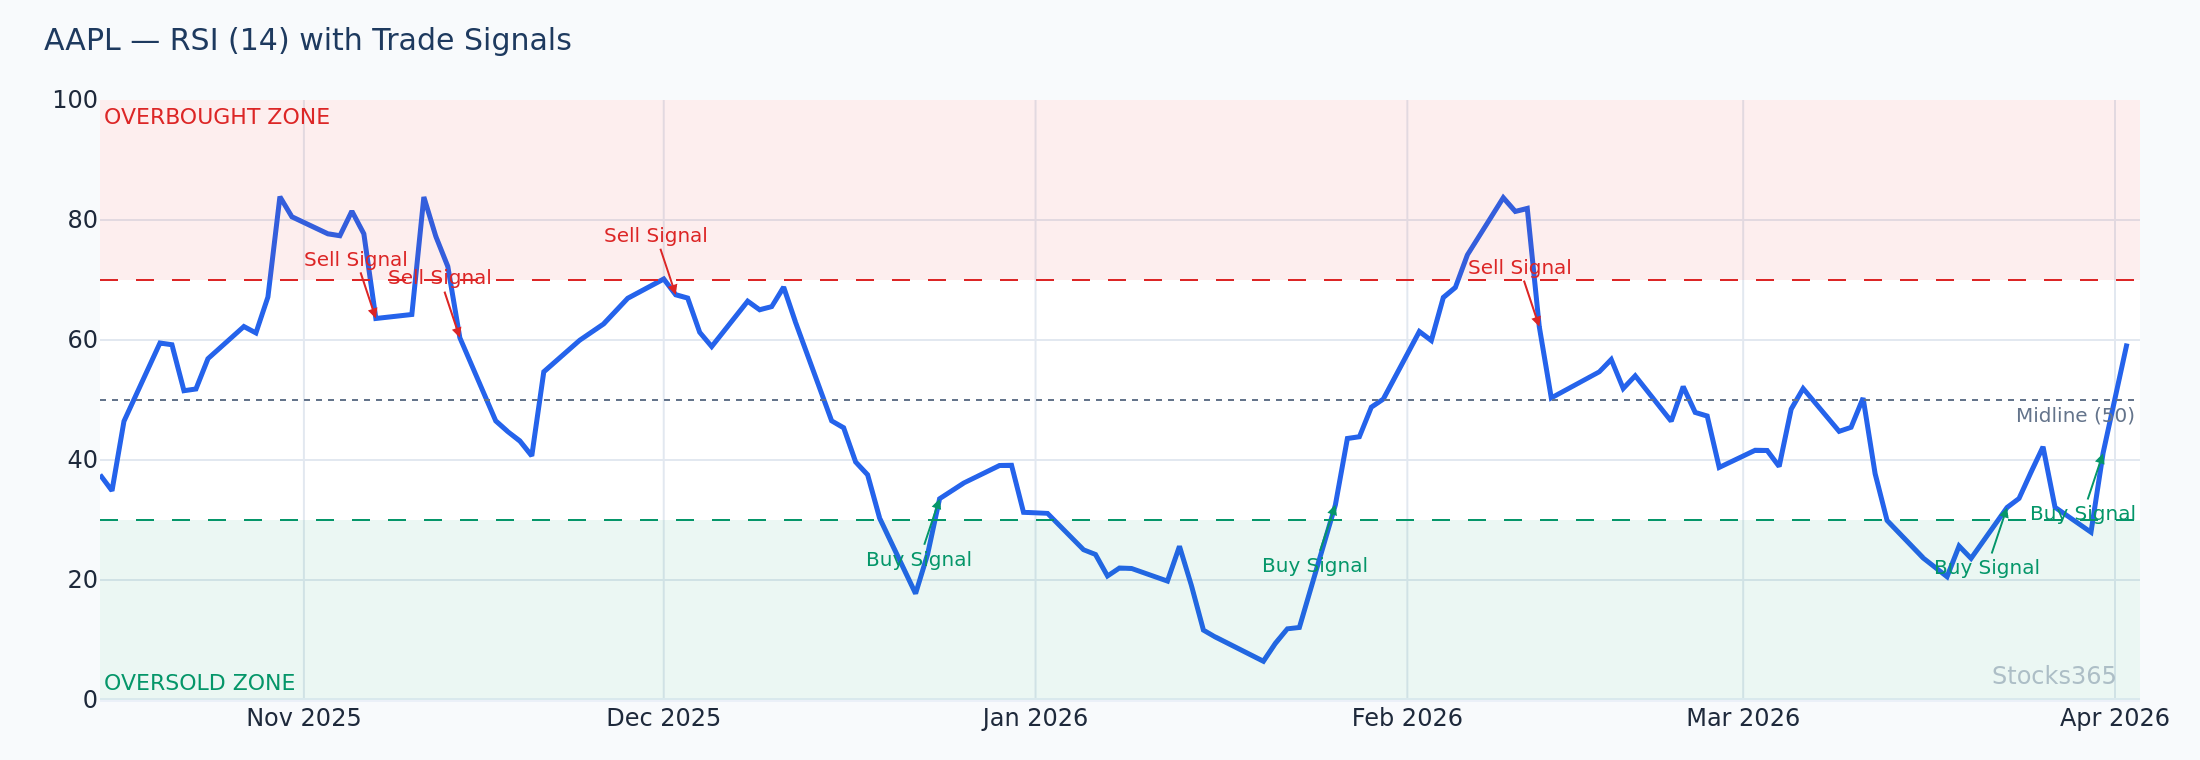
Example 1: Using RSI in a Trending Market (AAPL)
Imagine AAPL is in a clear uptrend, trading at $215 with price consistently making higher highs and higher lows. The RSI is sitting at 68 — just below the overbought threshold of 70.
A novice trader might hesitate, worried about an overbought reversal. But an experienced RSI trader recognizes this as a momentum continuation setup. In strong trends, RSI hovering between 50 and 70 is healthy. You'd look to enter on a pullback to $210 support with RSI retreating to the 50-55 zone — a classic RSI pullback-to-midline entry.
The Stochastic in this same scenario would be flashing frequent overbought readings above 80, generating multiple false sell signals as AAPL continues grinding higher. Here, RSI's smoother reading gives you a more reliable roadmap. You can check live AAPL momentum signals on the Stocks365 AAPL signals page.
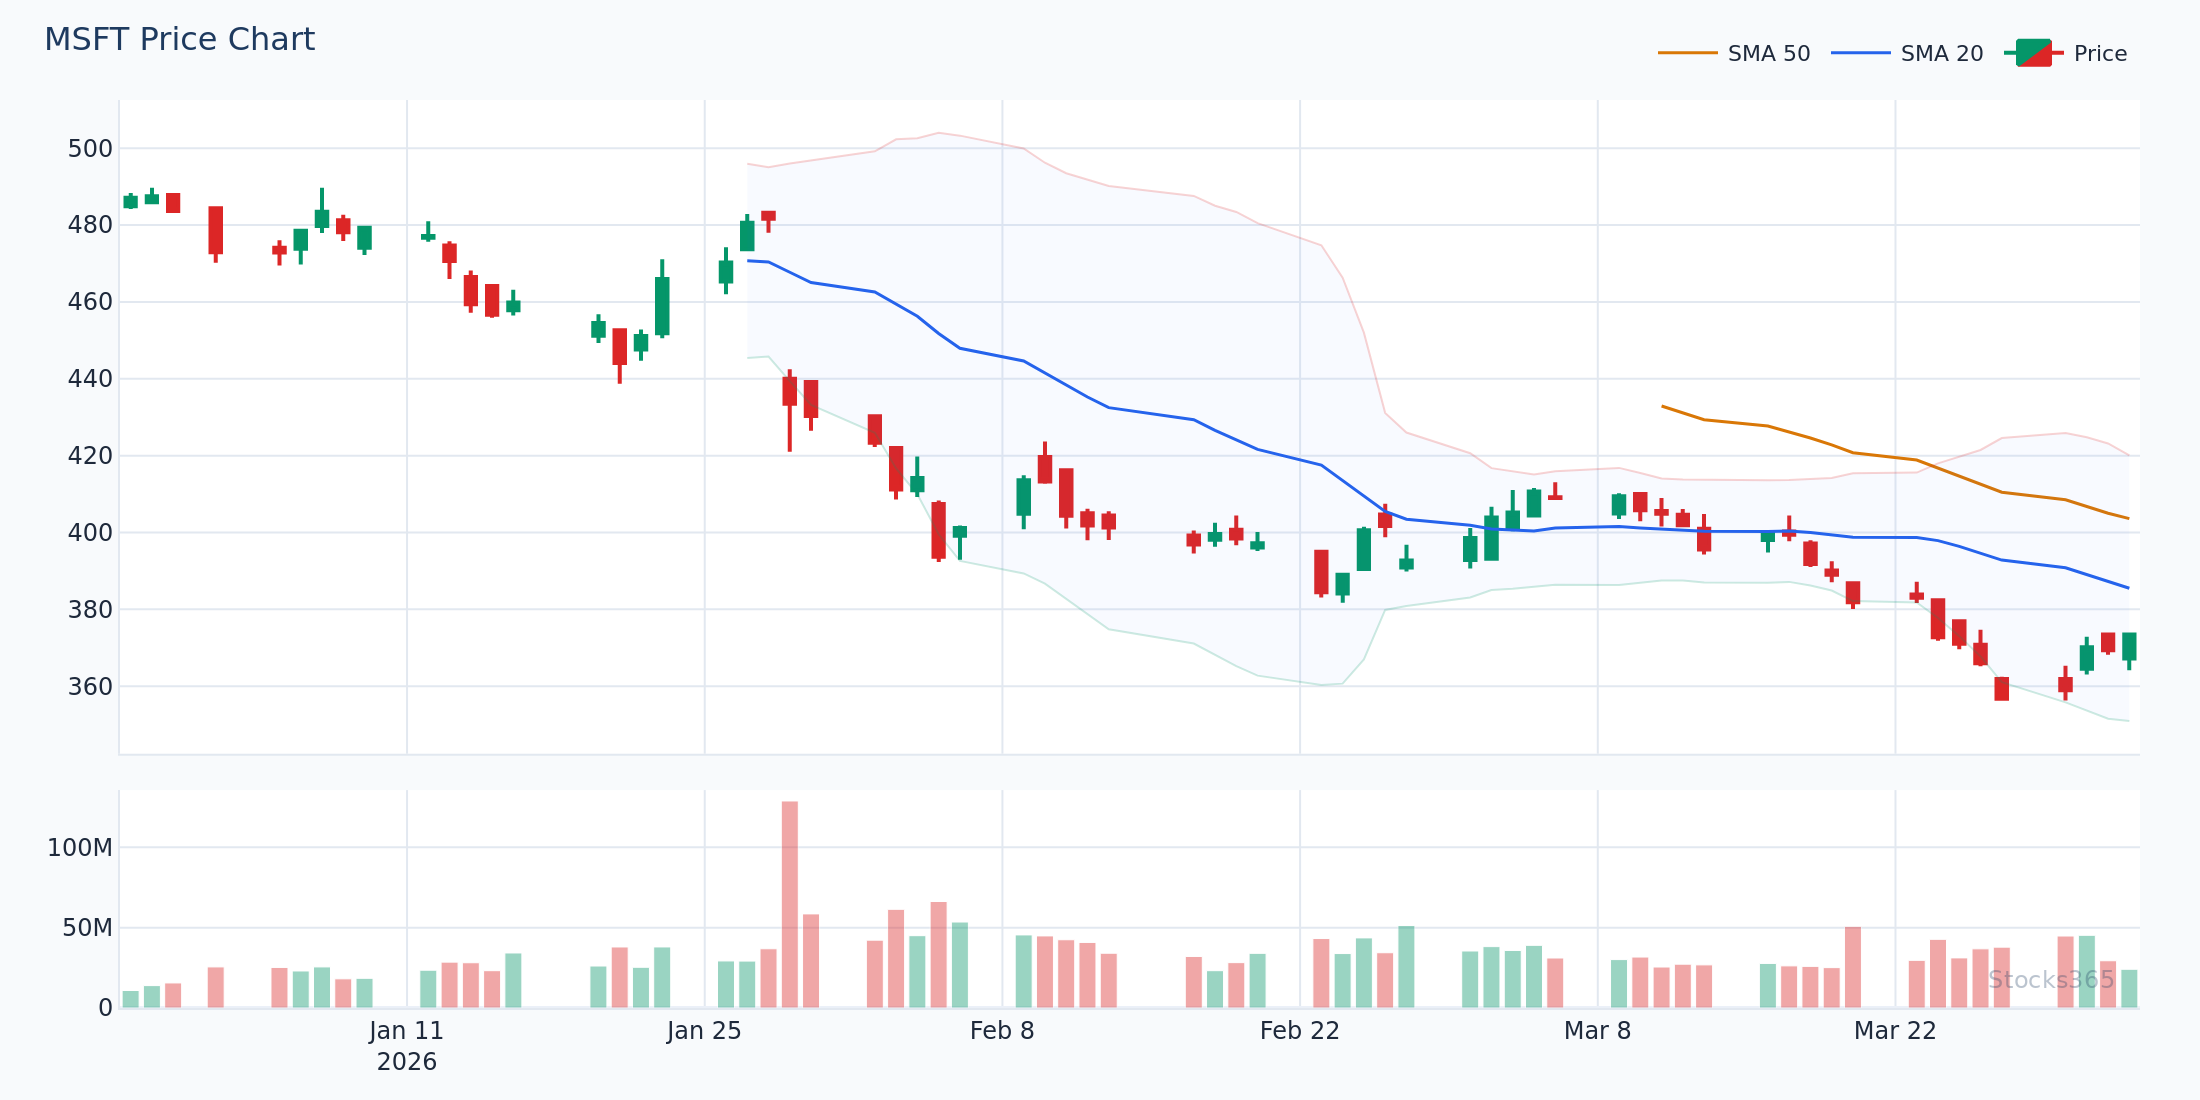
Example 2: Using Stochastic in a Range-Bound Market (MSFT)
Now consider MSFT consolidating between $380 support and $400 resistance over several weeks. RSI in this environment oscillates between 45 and 60 — never giving a clear overbought or oversold reading.
The Stochastic, however, is doing exactly what it was designed for. Each time price approaches $400, the Stochastic rises above 80 and the %K line crosses below %D — a short signal. Each time price drops toward $380, the Stochastic falls below 20 and %K crosses above %D — a buy signal. Traders using the Stochastic here could capture clean $15-$20 moves repeatedly while RSI remains frustratingly neutral.
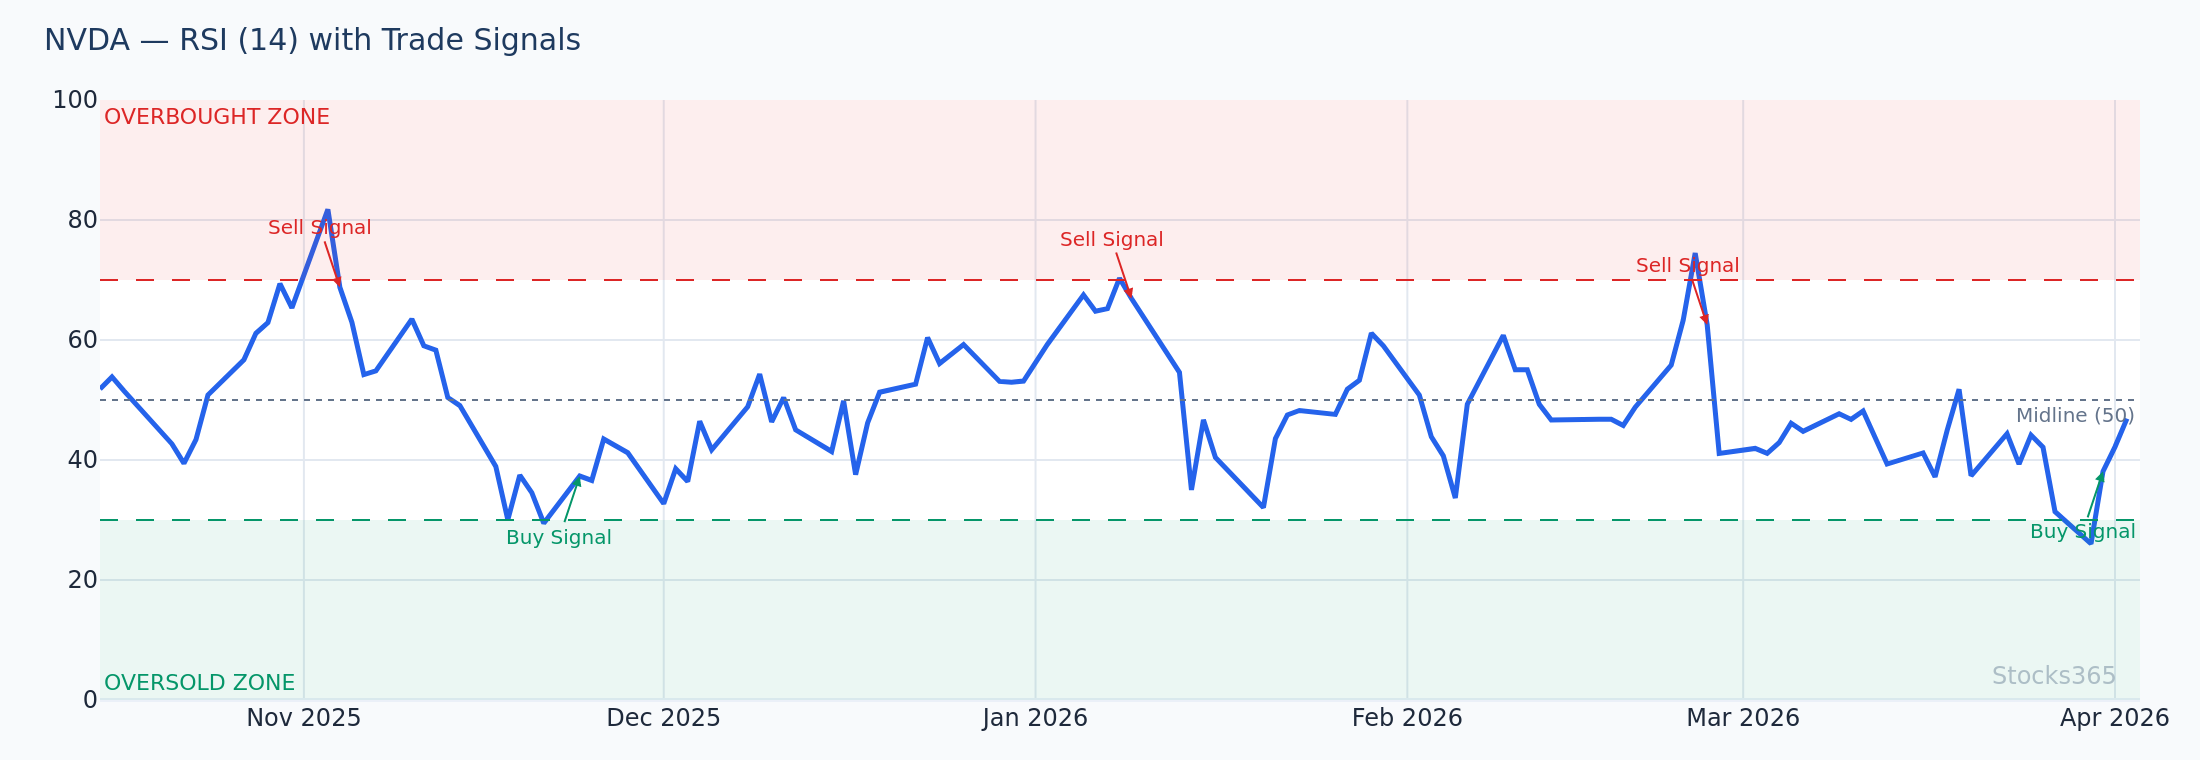
Example 3: Combining Both for High-Probability Entries (NVDA)
The most sophisticated approach is using RSI and Stochastic together. Consider NVDA pulling back from $145 to $128 during a broader uptrend. You're looking for a re-entry point.
- RSI drops to 35 — approaching oversold but not extreme, consistent with a healthy pullback in an uptrend
- Stochastic drops below 20 and %K crosses above %D — a short-term reversal signal
- Confluence: Both indicators align at the same support zone
This confluence setup — where both indicators independently signal the same direction — is far more reliable than using either alone. The Stocks365 signals dashboard aggregates momentum data across multiple indicators, helping you quickly identify these high-probability confluence setups without manually scanning every chart.
When to Use RSI: The Decision Framework
Choose RSI as your primary momentum indicator when:
- The market is trending: RSI respects trends better and avoids the false signals Stochastic generates during sustained moves
- You're swing or position trading: RSI's slower, more deliberate signals align better with longer holding periods
- Divergence is your primary strategy: RSI's single-line construction makes divergence patterns cleaner and easier to identify
- You want fewer, higher-quality signals: Less noise means less second-guessing
- Trading higher timeframes: Daily, weekly RSI readings carry significant institutional weight
For a comprehensive introduction to RSI signal interpretation, our Complete Beginner's Guide to RSI is the ideal starting point. And when you're ready to deploy RSI in live trading, the Ultimate Step-by-Step RSI Trading Guide provides actionable strategies across multiple market conditions.
When to Use the Stochastic Oscillator: The Decision Framework
Choose the Stochastic as your primary momentum indicator when:
- The market is range-bound: Stochastic thrives when price is oscillating between defined levels
- You're day trading or scalping: The Stochastic's sensitivity catches shorter-term reversals faster
- You need precise entry timing: The %K/%D crossover gives a specific entry trigger RSI lacks
- You want more trading signals: Higher signal frequency can suit active traders with tight risk management
- Trading lower timeframes: On 5-minute or 15-minute charts, Stochastic crossovers can be highly effective
Mastering RSI Overbought and Oversold Levels vs. Stochastic Extremes
One of the most common mistakes traders make is treating overbought and oversold readings identically between both indicators. The thresholds are different, and more importantly, their interpretation should differ based on market context.
RSI's 70/30 thresholds are well-established but frequently misapplied. As our detailed guide on RSI Overbought and Oversold Levels: Master the Signals explains, an RSI reading above 70 in a strong uptrend is not automatically a sell signal — it's often a sign of strong momentum that should be respected, not faded.
The Stochastic's 80/20 thresholds are similarly context-dependent. In a trending market, Stochastic can remain above 80 for an entire trend leg. The crossover signal (%K crossing %D) is more actionable than the level itself.
Adjusting Thresholds for Market Conditions
- In strong uptrends: Consider raising RSI overbought threshold to 80, oversold to 40
- In strong downtrends: Lower RSI overbought to 60, oversold to 20
- For Stochastic in volatile markets: Widen to 85/15 to filter noise
- For Stochastic in tight ranges: Standard 80/20 works well
Key Takeaways
📊 RSI vs Stochastic — Summary for Traders
- RSI measures momentum speed; Stochastic measures price position within a range
- RSI is better for trending markets; Stochastic is better for range-bound markets
- Stochastic is more sensitive and generates more signals; RSI generates fewer, higher-quality signals
- RSI excels at divergence analysis; Stochastic excels at crossover timing
- Using both together for confluence setups produces the highest-probability entries
- Always adjust your indicator interpretation to match the current market structure
- Platform tools like the Stocks365 signals dashboard help identify confluence signals automatically
Frequently Asked Questions
Is RSI or Stochastic better for day trading?
For pure day trading, the Stochastic Oscillator often has the edge due to its greater sensitivity and the clear entry signals generated by %K/%D crossovers on lower timeframes like 5-minute or 15-minute charts. However, RSI remains valuable for confirming trend direction and avoiding counter-trend trades. Many experienced day traders use the Stochastic for entry timing and RSI for directional bias.
Can I use RSI and Stochastic at the same time?
Absolutely — and this is actually recommended for higher-probability setups. Using both indicators together and looking for confluence (where both signals align in the same direction) significantly filters out false signals. For example, a Stochastic crossover above 20 combined with RSI bouncing off the 40 level in an uptrend creates a much more reliable buy signal than either indicator alone.
What is the main difference between RSI and the Stochastic Oscillator?
The core difference is what each indicator measures. RSI calculates the ratio of average gains to average losses over a period, measuring the velocity and strength of price momentum. The Stochastic Oscillator calculates where the current closing price sits within the recent high-low price range. RSI tells you how strong the move is; Stochastic tells you how stretched the price is relative to recent extremes.
Which indicator is better for identifying trend reversals?
RSI tends to be superior for identifying early trend reversals through divergence analysis. When price makes a new high but RSI makes a lower high (bearish divergence), it signals weakening momentum before the actual reversal. The Stochastic's crossover signals are better for timing the entry once you've already identified a potential reversal zone. Using RSI to spot the divergence and Stochastic to time the entry is a powerful combined approach.
What RSI and Stochastic settings work best for swing trading?
For swing trading, the standard RSI(14) with 70/30 thresholds is a well-tested starting point on daily charts. For the Stochastic, a setting of 14,3,3 (14-period %K, smoothed by 3, with a 3-period %D) works well for swing timeframes. Some swing traders prefer a slower Stochastic (21,3,3) to reduce noise on daily charts. The key is consistency — choose settings that fit your strategy and back-test them on the assets you trade most.