
How to Use RSI in Trading: A Practical Step-by-Step Guide
The Relative Strength Index (RSI) is one of the most widely used technical indicators in the world — and for good reason. Whether you're trading stocks, crypto, or forex, RSI gives you a fast, visual read on whether a security is gaining or losing momentum. But knowing how to use RSI in trading effectively goes far beyond glancing at a number and hoping for the best.
In this step-by-step guide, you'll learn exactly how to read RSI signals, apply them to real trades, combine them with other indicators, and avoid the costly mistakes that catch beginners off guard. If you're brand new to the concept, start with our Complete Beginner's Guide to RSI before diving in here.
Key Insight: RSI doesn't tell you what a stock will do — it tells you what momentum looks like right now. Used correctly, that's an incredibly powerful edge.
What Is RSI and Why Does It Matter for Traders?
RSI is a momentum oscillator that measures the speed and magnitude of recent price changes on a scale from 0 to 100. Developed by J. Welles Wilder Jr. in 1978, it remains a cornerstone of modern technical analysis because it's versatile, easy to interpret, and works across virtually every asset class and timeframe.
At its core, RSI answers one simple question: Are buyers or sellers in control right now? When RSI climbs above 70, buyers have been dominant — potentially to an extreme. When it falls below 30, sellers have been in control — again, potentially to an extreme. These extremes are where trading opportunities emerge.
If you want to understand the math behind the indicator, our detailed breakdown of How RSI Is Calculated walks through the formula step by step. For this guide, we'll focus entirely on practical application.
Step 1: Set Up RSI Correctly on Your Chart
Before you can use RSI, you need to configure it properly. Here's what to do:
Choose the Right RSI Period
The default RSI period is 14, and for most traders, this is the best starting point. Here's why period length matters:
- RSI (7-9): More sensitive, generates more signals, better for short-term or day traders. More false positives.
- RSI (14): The industry standard. Balanced sensitivity. Works across most timeframes.
- RSI (21-25): Smoother, fewer signals, preferred by swing and position traders seeking high-conviction setups.
For most retail traders learning how to use RSI in trading, start with the 14-period setting and adjust only once you understand how signals behave on your preferred instrument.
Select Your Timeframe
RSI works on every timeframe, but the signals carry different weight:
- 1-minute to 15-minute charts: Day trading. RSI signals are frequent but noisy.
- 1-hour to 4-hour charts: Intraday swing trading. A good middle ground.
- Daily charts: Swing trading. RSI signals here are more reliable and widely followed.
- Weekly charts: Position trading. RSI crosses are rare but highly significant.
Pro tip: Always check RSI on a higher timeframe first. If the daily RSI is deeply oversold, that's a tailwind for long trades on the 1-hour chart.
Step 2: Understand the Core RSI Levels
RSI readings mean different things in different zones. Here's the standard framework:
- RSI above 70: Overbought territory — the asset may be due for a pullback or consolidation.
- RSI 50-70: Bullish momentum — buyers are in control, trend is up.
- RSI at 50: Neutral — the midpoint. A cross above or below 50 can signal a trend shift.
- RSI 30-50: Bearish momentum — sellers are in control, trend is down.
- RSI below 30: Oversold territory — the asset may be due for a bounce or reversal.
For a deep dive into how to trade these levels with precision, see our guide on RSI Overbought and Oversold Levels.
Critical Warning: Overbought does NOT mean "sell immediately." In strong uptrends, RSI can stay above 70 for days or weeks. Context is everything.
Step 3: Use RSI to Identify Trading Signals
There are four primary ways traders use RSI to generate trade signals. Let's break each one down with practical examples.
Signal 1: Overbought and Oversold Reversals
The most basic RSI strategy is watching for reversals when RSI reaches extreme levels. Here's a real-world example:
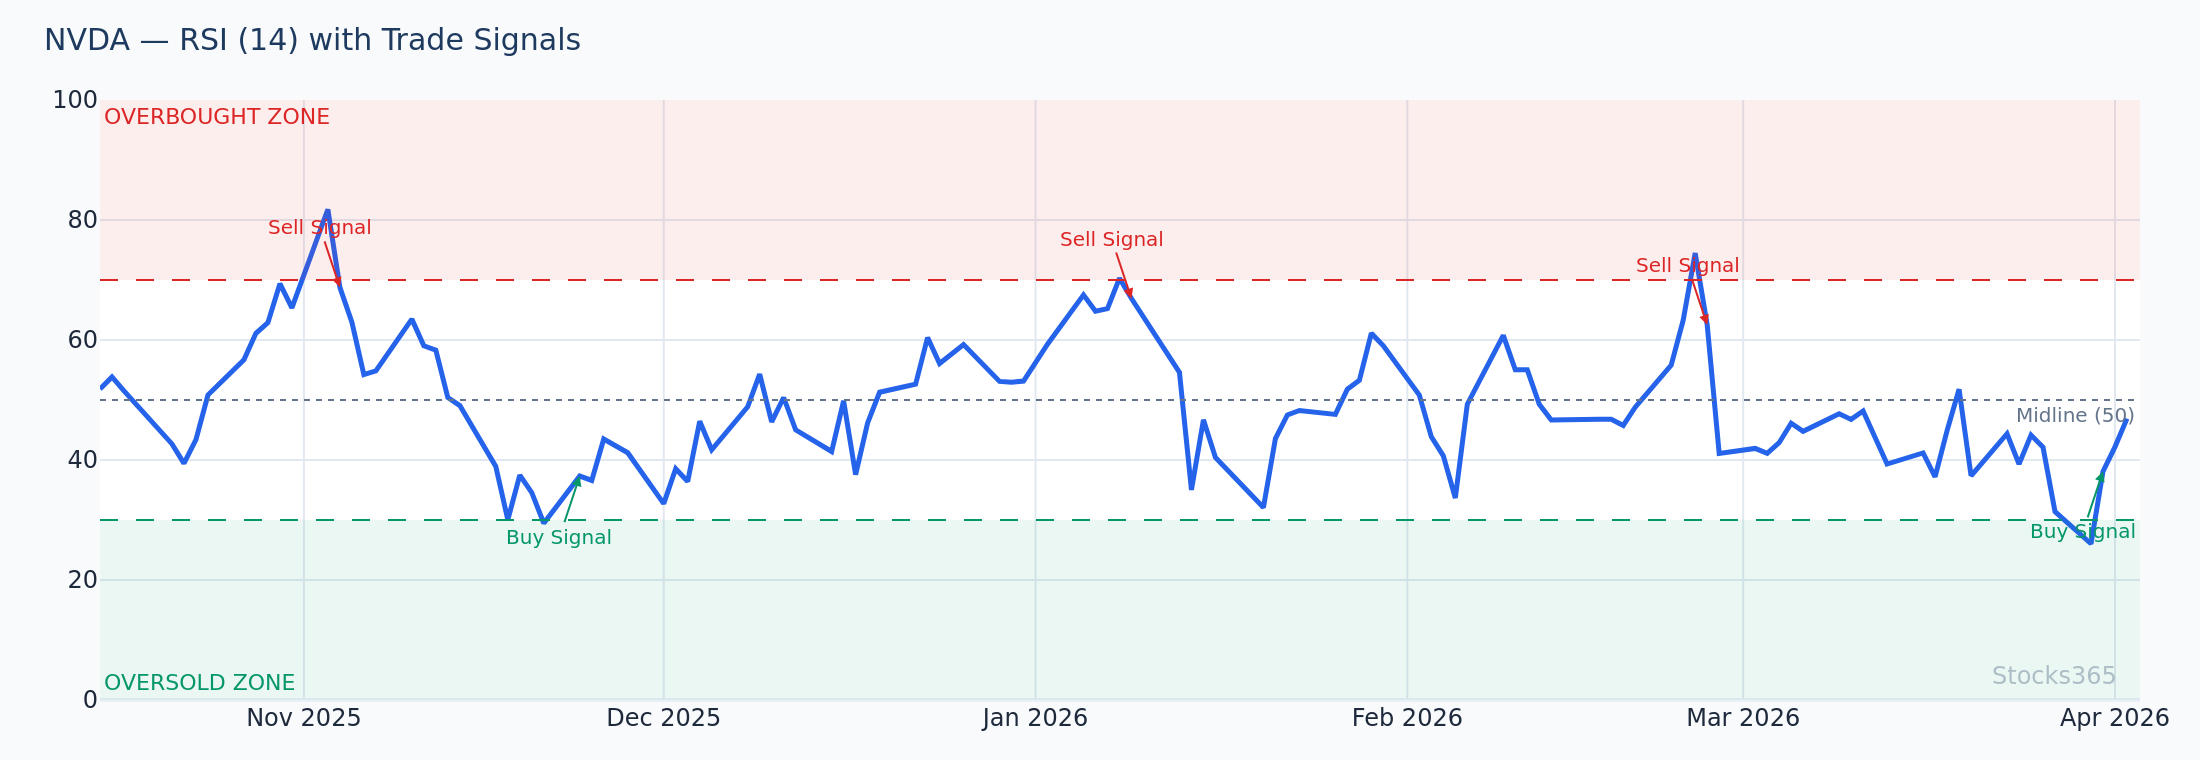
Example — NVIDIA (NVDA) Oversold Bounce:
- NVDA pulls back sharply, RSI drops to 28 on the daily chart.
- Price reaches $480, a key support level with RSI in oversold territory.
- RSI begins curling upward, crossing back above 30.
- Entry: Buy at $483 as RSI crosses back above 30.
- Stop-loss: Below $470 (just under support).
- Target: $510 — next resistance zone.
The key isn't entering when RSI hits 28 — it's entering when RSI begins turning back up. That confirmation reduces false starts significantly.
Signal 2: RSI Divergence (The Most Powerful Signal)
RSI divergence occurs when price and RSI move in opposite directions. This is considered one of the most reliable signals in all of technical analysis.
Bullish Divergence: Price makes a lower low, but RSI makes a higher low. This signals weakening selling momentum — a potential reversal upward.
Bearish Divergence: Price makes a higher high, but RSI makes a lower high. This signals weakening buying momentum — a potential reversal downward.
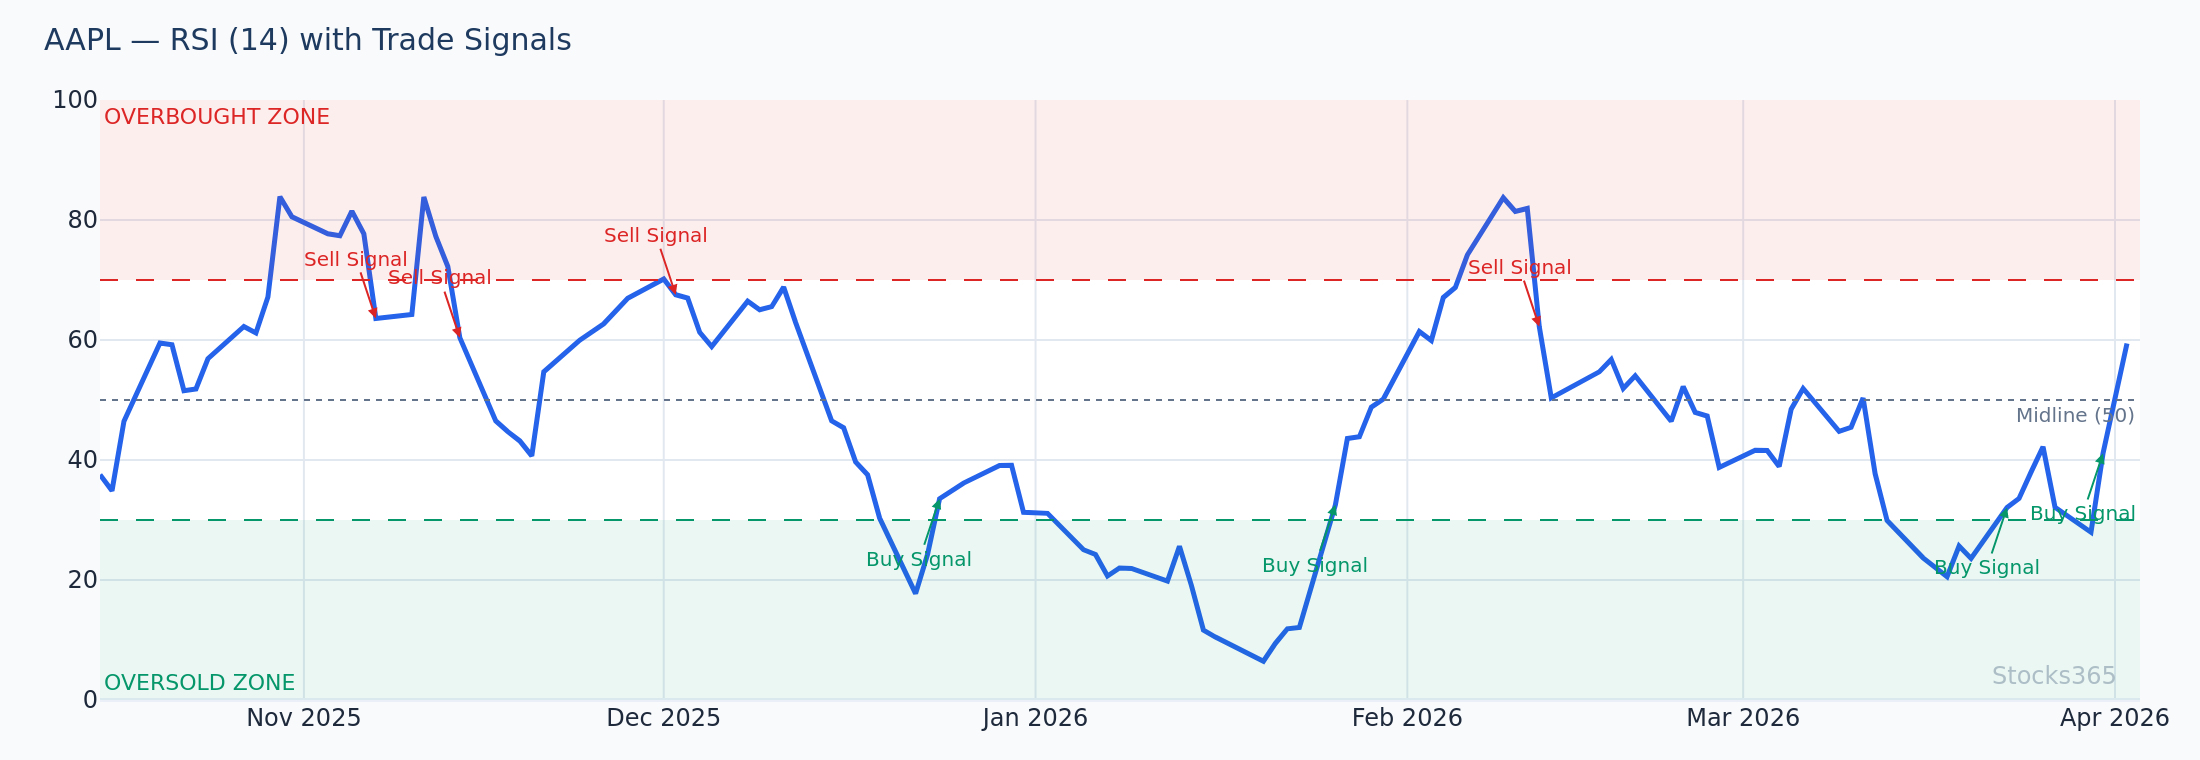
Example — Apple (AAPL) Bearish Divergence:
- AAPL rallies from $170 to $195 (higher high in price).
- During the first rally to $185, RSI hit 72.
- During the second rally to $195, RSI only reaches 64 — a lower high.
- This bearish divergence signals exhaustion in the uptrend.
- Entry: Short position initiated at $193 with RSI showing divergence.
- Stop: Above $198.
- Target: $180 support zone.
Signal 3: RSI Centerline Crossover (Trend Confirmation)
The 50-level on RSI acts like a dividing line between bullish and bearish territory. When RSI crosses above 50, it suggests momentum has shifted to the upside. When it crosses below 50, momentum has turned bearish.
How to use this in practice:
- Use the 50-level cross as a trend filter, not a standalone entry signal.
- Only take long trades when RSI is above 50 (momentum is bullish).
- Only take short trades when RSI is below 50 (momentum is bearish).
- Combine with a moving average for additional confirmation.
This approach keeps you on the right side of the trend and reduces counter-trend trades that fight the prevailing momentum.
Signal 4: RSI Failure Swings
Failure swings are a lesser-known but powerful RSI pattern that Wilder himself highlighted. They occur entirely within RSI — you don't compare RSI to price.
Bullish Failure Swing:
- RSI falls below 30 (oversold).
- RSI bounces back above 30.
- RSI pulls back but stays above 30 (doesn't make a new low).
- RSI breaks above the previous bounce high — this is the buy signal.
Bearish Failure Swing:
- RSI rises above 70 (overbought).
- RSI drops back below 70.
- RSI bounces but stays below 70 (doesn't make a new high).
- RSI breaks below the previous pullback low — this is the sell signal.
Failure swings are particularly useful because they generate a specific, actionable trigger point rather than a vague zone.
Step 4: Combine RSI with Other Indicators
RSI is powerful on its own, but its real edge comes when combined with complementary tools. Here are the most effective combinations:
RSI + Moving Averages
Use a 50-day or 200-day moving average to establish trend direction, then use RSI to time entries:
- Price is above the 200-day MA (uptrend) → Only take RSI oversold signals (buy dips).
- Price is below the 200-day MA (downtrend) → Only take RSI overbought signals (sell rallies).
This simple filter eliminates a large percentage of false signals.
RSI + Support and Resistance
This is arguably the most reliable combination for swing traders:
- Identify a key support level on the price chart.
- Wait for price to approach that support level.
- Confirm RSI is in oversold territory (below 30) or showing bullish divergence.
- Enter the trade with tight risk management.
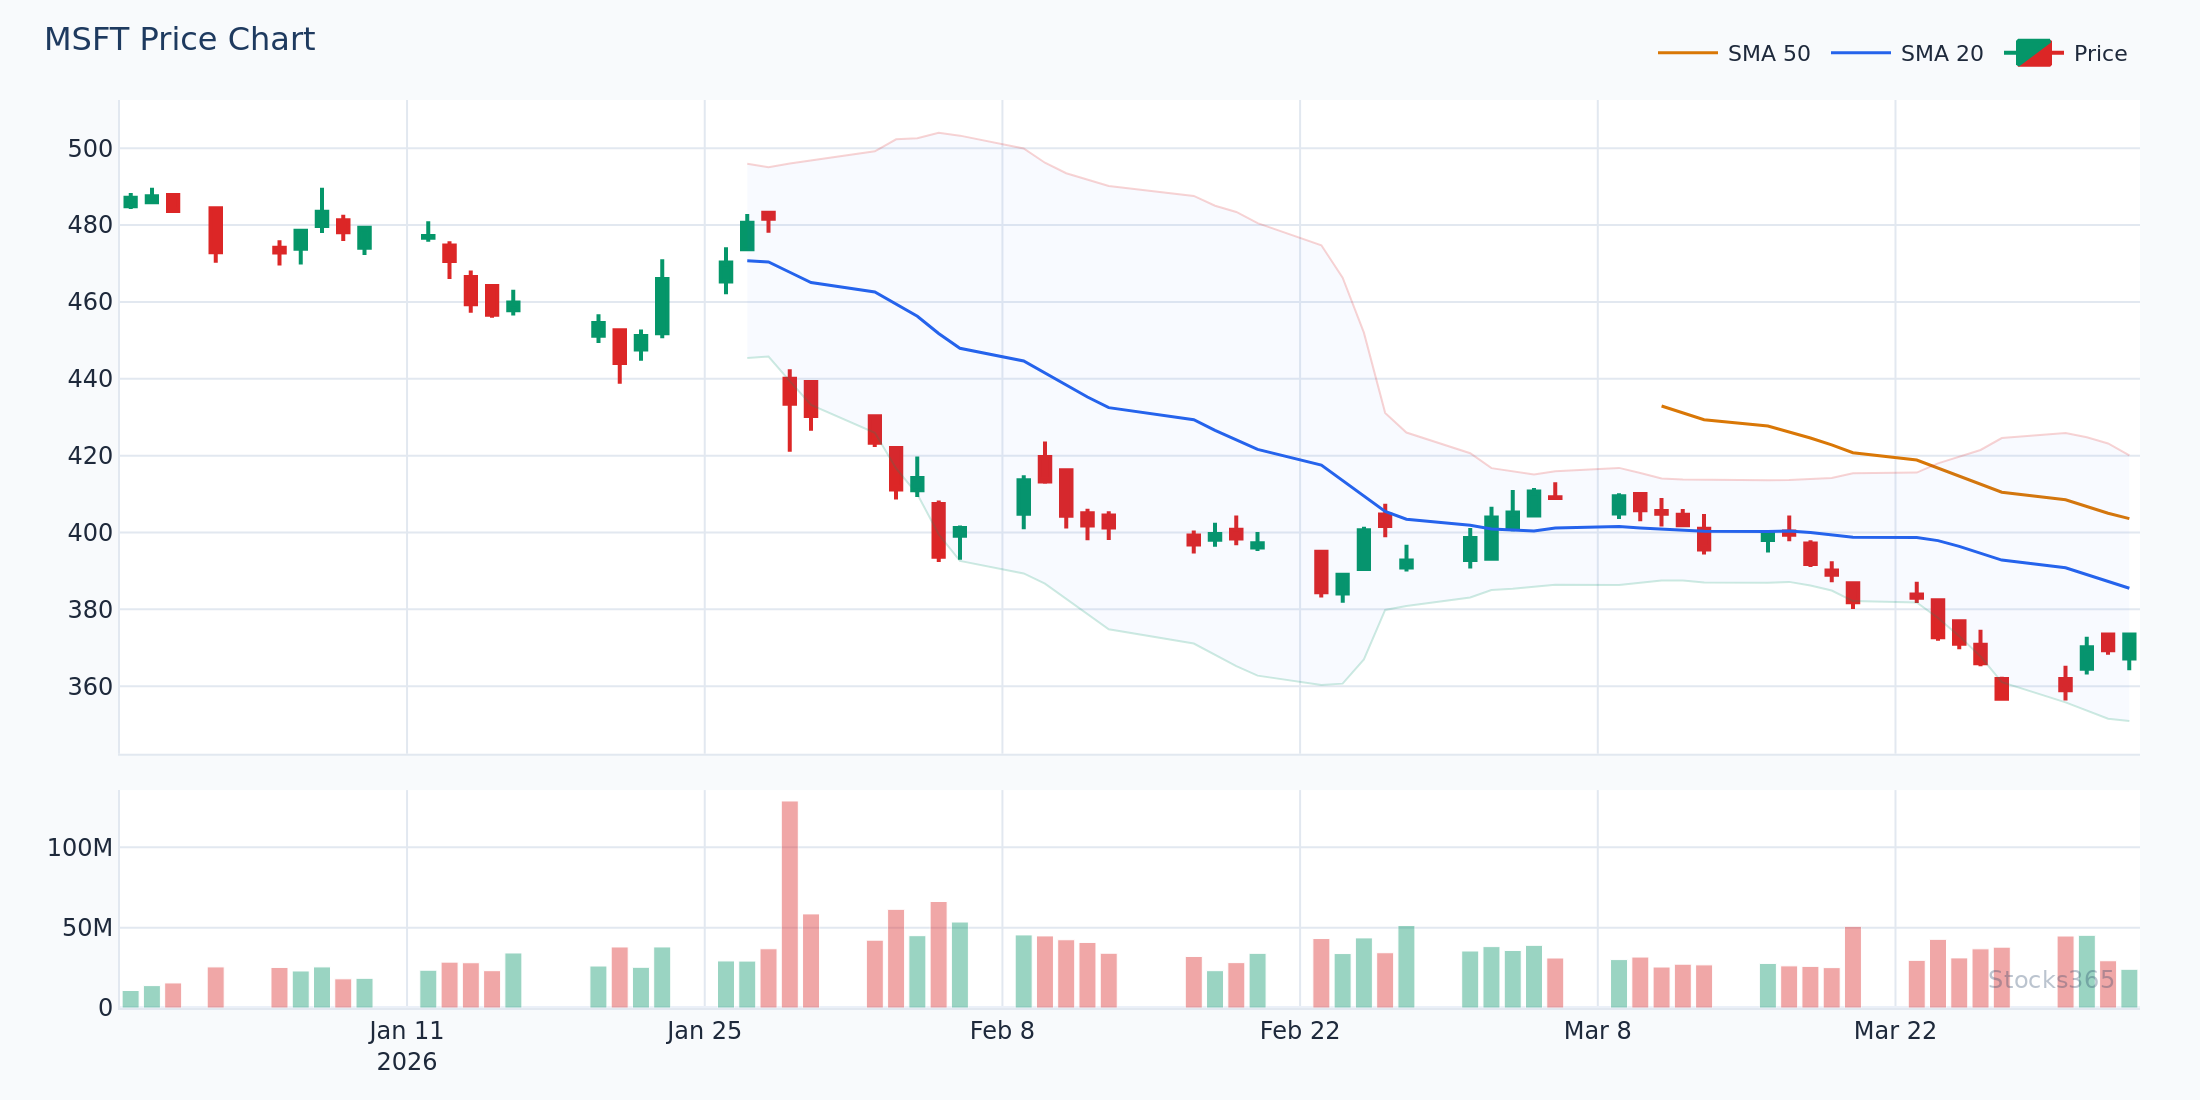
Example: MSFT approaches a known support at $380. RSI simultaneously drops to 32. This confluence of price support + RSI oversold creates a high-probability long setup.
RSI + Volume
Volume confirms conviction. If RSI signals a reversal but volume is low, be cautious. If RSI signals a reversal on high volume, confidence increases significantly. Look for:
- High volume + RSI turning up from oversold = strong buy signal.
- High volume + RSI turning down from overbought = strong sell signal.
- Low volume + RSI at extreme = treat with skepticism.
Step 5: Apply RSI to Different Trading Styles
RSI for Day Traders
Day traders typically use 5-minute or 15-minute charts with a 14-period RSI. The focus is on quick mean-reversion trades:
- Watch for RSI spikes above 75 or below 25 (more extreme thresholds for noisy intraday data).
- Combine with VWAP — RSI oversold + price at VWAP support = high-probability long.
- Set tight stops and realistic targets (1:1.5 to 1:2 risk-reward).
- Avoid trading RSI signals against the broader daily trend.
RSI for Swing Traders
Swing traders using daily charts have more time to analyze and can focus on higher-quality setups:
- Use RSI divergence as the primary signal — more reliable on daily timeframes.
- Combine with weekly RSI for trend context.
- Target 3-10 day holding periods with 1:2 to 1:3 risk-reward ratios.
- Use RSI centerline (50) crossovers to confirm trend direction.
RSI for Position Traders
Position traders using weekly or monthly charts treat RSI signals as major inflection points:
- RSI below 40 on the weekly chart often marks multi-month buying opportunities.
- Bearish divergence on the weekly chart can signal major market tops.
- Combine with fundamental analysis for the highest-conviction trades.
Step 6: Manage Risk When Trading RSI Signals
Even the best RSI setups fail sometimes. Proper risk management is what separates profitable traders from losing ones.
Position Sizing
Never risk more than 1-2% of your trading capital on a single RSI trade, regardless of how strong the signal looks. Even a high-probability setup can fail, and you need to survive drawdowns to stay in the game.
Stop-Loss Placement
- For oversold long trades: Place stop just below the recent swing low.
- For overbought short trades: Place stop just above the recent swing high.
- For divergence trades: Place stop beyond the extreme price point that formed the divergence.
Profit Targets
Use the following as your target framework:
- Minimum target: The 50-level on RSI (momentum returning to neutral).
- Extended target: The opposite extreme (RSI reaching 70 from oversold, or 30 from overbought).
- Price-based targets: Next major support/resistance level on the price chart.
Common RSI Trading Mistakes to Avoid
Understanding how to use RSI in trading also means knowing what not to do. Here are the most common mistakes:
- Treating overbought/oversold as automatic reversal signals: In strong trends, RSI can stay extreme for a long time. Always wait for confirmation before entering.
- Ignoring the broader trend: Taking bullish RSI signals in a strong downtrend is fighting the market. Use RSI with the trend, not against it.
- Using RSI in isolation: RSI works best as part of a system, not as a standalone indicator. Always seek confluence.
- Changing settings constantly: Pick a period and stick with it long enough to understand how it behaves on your instrument.
- Over-trading: Not every RSI signal deserves a trade. Be selective. Quality over quantity.
How Stocks365 Helps You Trade RSI Smarter
Manually scanning hundreds of stocks for RSI setups is time-consuming and error-prone. That's where Stocks365 changes the game. Our platform continuously monitors RSI signals across thousands of securities, surfacing high-probability setups in real time.
Every signal on Stocks365 includes a Trust Score — a proprietary rating that weighs multiple technical factors, including RSI readings, volume confirmation, trend alignment, and historical pattern reliability. This means you're not just seeing "RSI is oversold" — you're seeing a curated signal with context.
For example, check out live RSI analysis for AAPL signals on Stocks365 to see how RSI fits into the broader signal picture. Or explore our signals dashboard to find the highest Trust Score setups happening right now across the market.
Rather than spending hours scanning charts, you spend your time on what matters — analyzing the best setups and executing with confidence.
📌 Key Takeaways
- Set up RSI correctly: Use the 14-period default to start; adjust based on your trading style and timeframe.
- Know the zones: Above 70 = overbought, below 30 = oversold, 50 = neutral midpoint and trend filter.
- Master the four signals: Overbought/oversold reversals, divergence, centerline crossovers, and failure swings.
- Always seek confluence: RSI is most powerful when combined with support/resistance, moving averages, or volume.
- Manage risk first: Even perfect RSI signals fail — always use stop-losses and size positions appropriately.
- Adapt to your style: Day traders, swing traders, and position traders all use RSI differently — know your context.
- Use tools wisely: Platforms like Stocks365 can surface high-quality RSI setups with Trust Score validation, saving time and improving accuracy.
Frequently Asked Questions
What is the best RSI setting for day trading?
For day trading, many traders reduce the RSI period to 7 or 9 on 5-minute or 15-minute charts to increase sensitivity and capture faster moves. However, this comes with more false signals. A 14-period RSI on a 15-minute chart is often a solid balance between responsiveness and reliability. Always test your specific settings on your instrument before trading live.
Is RSI reliable enough to trade on its own?
RSI is a valuable tool, but no indicator is reliable when used in complete isolation. Studies consistently show that RSI combined with price action context — such as support/resistance levels, trend direction, or volume — produces significantly better results than RSI alone. Think of RSI as a powerful piece of evidence, not a verdict.
What does it mean when RSI is at 50?
RSI at 50 represents the neutral midpoint between bullish and bearish momentum. Many professional traders use RSI crossing above or below 50 as a trend confirmation signal. A sustained move above 50 suggests bullish momentum; sustained trading below 50 suggests bearish momentum. It's particularly useful as a filter — for example, only taking long trades when RSI is above 50.
Can RSI divergence predict market reversals?
RSI divergence is one of the more reliable leading indicators of potential reversals, but it doesn't guarantee them. Bearish divergence signals weakening buying momentum, and bullish divergence signals weakening selling momentum — but "weakening" doesn't always mean "reversing." Always wait for a confirming price action signal (like a break of structure or a candlestick reversal pattern) before acting on divergence alone.
How do I avoid RSI false signals?
The best ways to reduce RSI false signals include: (1) trading RSI signals in the direction of the higher timeframe trend, (2) waiting for RSI to exit the extreme zone rather than enter it, (3) combining RSI with price support/resistance, (4) requiring volume confirmation on entry, and (5) using the Stocks365 Trust Score to prioritize only high-confluence setups. Patience and confluence are your greatest defenses against false signals.