
Why RSI Settings Matter More Than Most Traders Realize
Most traders install the RSI indicator, leave it at the default 14-period setting, and never think twice about it. That's a mistake — and it may be costing them real money. The RSI period you choose fundamentally changes what the indicator tells you, how frequently it signals, and whether those signals align with your actual trading strategy.
Whether you're a day trader scalping 5-minute charts on AAPL or a swing trader holding positions in NVDA for weeks, the right RSI settings can sharpen your edge dramatically. The wrong ones can fill your chart with noise — or worse, leave you missing major moves entirely.
In this guide, we'll break down exactly how RSI period settings work, which configurations suit which strategies, and how professional traders think about customizing this essential momentum oscillator. If you're new to the indicator itself, start with What Is RSI? The Complete Beginner's Guide before diving in here.
Key Insight: There is no universally "best" RSI setting. The optimal period depends on your timeframe, asset class, trading style, and risk tolerance. Understanding why settings matter is the first step to choosing the right ones.
How the RSI Period Setting Works
The RSI (Relative Strength Index) measures the speed and magnitude of recent price changes on a scale from 0 to 100. The period setting determines how many candlesticks are used in that calculation. A 14-period RSI on a daily chart looks back at the past 14 trading days. The same setting on a 1-hour chart looks back at the past 14 hours.
Understanding this is crucial: the period setting controls the sensitivity of the RSI line. To understand the math behind it, read our detailed breakdown of How RSI Is Calculated: Formula Explained Step by Step.
Short Periods: More Signals, More Noise
Reducing the RSI period — say, to 7 or 9 — makes the indicator react more quickly to price changes. This produces:
- More frequent overbought/oversold signals — The RSI will cross the 70 and 30 levels far more often
- Earlier entries — Signals appear sooner in a move, which can improve risk-reward ratios
- Higher noise levels — More false signals, especially in trending or choppy markets
- Whipsaw risk — Price may barely touch overbought before reversing back, generating losing trades
Short-period RSI settings (2–9) are popular among aggressive day traders and mean-reversion specialists who trade very short timeframes and can manage trades actively.
Long Periods: Fewer Signals, Higher Reliability
Increasing the RSI period — to 21, 25, or beyond — smooths the line considerably. This produces:
- Fewer signals — The RSI crosses overbought/oversold thresholds less often
- Higher signal quality — When the indicator does fire, it tends to reflect stronger, more sustained momentum shifts
- Later entries — You may miss the first portion of a move before the signal appears
- Better trend alignment — Longer settings help filter out counter-trend noise
Long-period RSI settings (21–50) are favored by position traders, investors using technical confirmation, and those trading on weekly charts.
The Default RSI Setting: Why 14 Periods?
Welles Wilder, who developed the RSI in 1978, chose 14 periods because it represented approximately half of a lunar cycle (28 days). On a daily chart, 14 periods covered roughly two full trading weeks — a span Wilder believed captured meaningful short-to-medium term momentum cycles.
The 14-period RSI remains the default in virtually every trading platform for good reasons:
- It balances sensitivity and reliability reasonably well across most assets
- Because so many traders use it, the signals at 70 and 30 can become self-fulfilling
- It works adequately across daily, weekly, and intraday charts
- It's well-studied and documented, making backtesting results comparable across strategies
However, "adequate" is rarely what professional traders settle for. The 14-period default is a starting point, not a final answer.
RSI Settings by Trading Style
Day Trading: RSI Settings for 5-Minute and 15-Minute Charts
Day traders need an RSI that responds quickly to intraday momentum shifts while still filtering out random tick noise. On 5-minute charts, a 14-period RSI often lags too much to be actionable. Here's what tends to work better:
- RSI(7) or RSI(9): Popular for scalping on 1-minute to 5-minute charts. Generates fast signals for quick entries and exits. Best used with overbought level raised to 80 and oversold level lowered to 20 to reduce false signals.
- RSI(14): Works reasonably on 15-minute charts for traders holding positions 30 minutes to 2 hours. Standard 70/30 levels apply.
- RSI(21): Useful on 15-minute or 30-minute charts for intraday swing setups where a trader holds for most of the session.
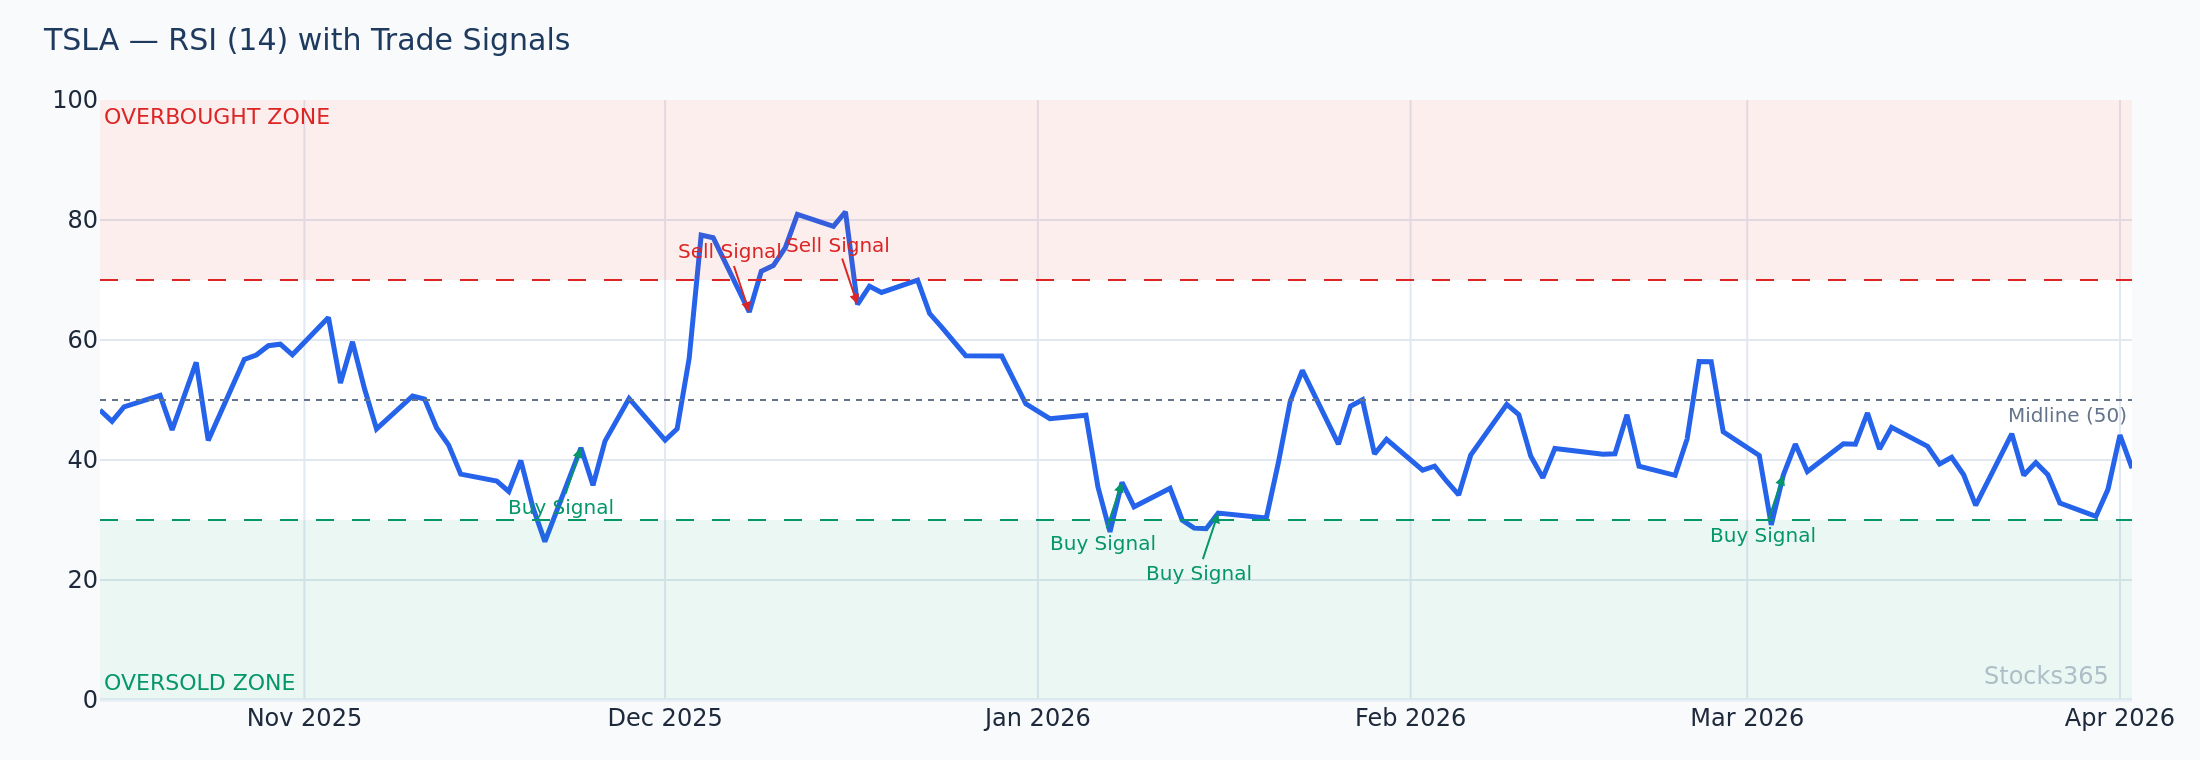
Practical Example: Suppose TSLA is trading at $245 on a volatile morning session. A trader using RSI(7) on a 5-minute chart notices RSI dropping to 18 (below the oversold threshold of 20) while price bounces off a key $243 support level. This generates a potential long entry with a tight stop at $241.50, targeting a move back to $248. The fast RSI confirms the intraday momentum shift before a slower RSI(14) would even register the dip.
Swing Trading: RSI Settings for Daily Charts
Swing traders typically hold positions from a few days to a few weeks. On daily charts, these settings tend to perform well:
- RSI(10) or RSI(11): A middle ground favored by many professional swing traders. Slightly more sensitive than the default, produces more signals without excessive noise on daily charts.
- RSI(14): The reliable workhorse. Best for traders who want standard overbought/oversold behavior (70/30) and broad compatibility with published research and signals.
- RSI(21): For swing traders who want to filter for only strong, high-conviction momentum setups. Signals appear less frequently but carry more weight.
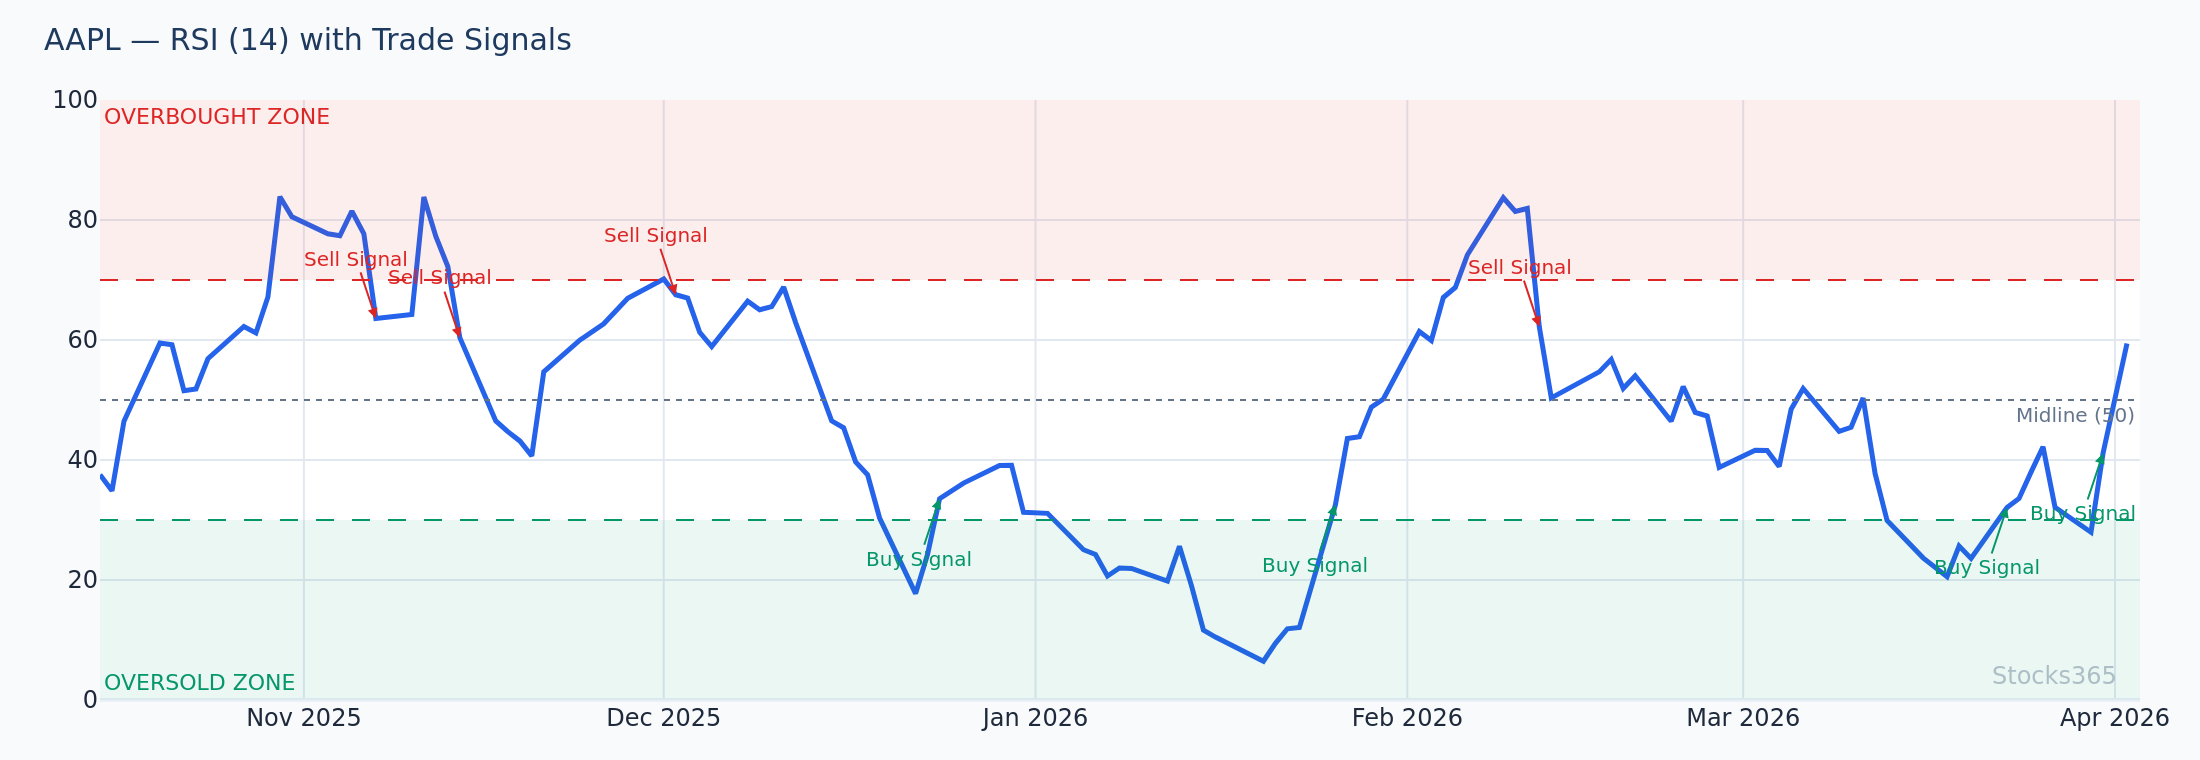
Practical Example: MSFT has been trending upward and pulls back to $415. A swing trader using RSI(14) on the daily chart watches the RSI drop from 65 to 38 during the pullback — not deeply oversold, but approaching the support zone. Combined with a bullish engulfing candle at the 50-day moving average, the RSI(14) reading at 38 confirms the pullback is losing momentum, offering a swing entry with a stop below $408 and a target near $435.
Position Trading and Investing: RSI Settings for Weekly Charts
Longer-term traders and investors who use RSI as a confirmation tool rather than a primary signal source benefit from higher period settings:
- RSI(14) on Weekly: Effective for identifying major overbought and oversold conditions in multi-week trends. Readings below 30 on a weekly chart are relatively rare and often coincide with significant buying opportunities.
- RSI(21) on Weekly: Even smoother, producing only the most significant momentum signals. Ideal for portfolio managers making allocation decisions.
- RSI(9) on Weekly: Used by some momentum investors to identify when a trending stock's weekly momentum is temporarily weakening — a signal to consider adding to positions.
The 2-Period RSI: A Special Case
One RSI setting deserves special mention: RSI(2). Developed into a formal strategy by Larry Connors and Cesar Alvarez, the 2-period RSI is one of the most backtested short-term mean-reversion tools in technical analysis.
The premise: when the 2-period RSI drops below 10 in an uptrending market (price above 200-day moving average), the stock has experienced a significant short-term pullback and tends to mean-revert upward quickly.
Key rules for the RSI(2) strategy:
- Only take long signals when price is above the 200-day SMA (confirming uptrend)
- Enter when RSI(2) drops below 10 (deeply oversold)
- Exit when RSI(2) rises above 65 (not at a fixed target — exit on momentum recovery)
- Use strict position sizing — this strategy can generate many signals in volatile markets
The RSI(2) is not suitable for trending entries or for use in bear markets. It's a pure mean-reversion tool and requires a different mindset than traditional RSI usage. Always pair it with the correct overbought and oversold level analysis for your context.
Adjusting RSI Overbought and Oversold Levels to Match Your Settings
Changing the RSI period without adjusting the overbought/oversold thresholds is a common mistake. Shorter periods push RSI to extremes more frequently, so the standard 70/30 levels generate too many signals. Longer periods produce smoother RSI lines that rarely reach those extremes.
Here's a practical guide to matching thresholds to period settings:
- RSI(2–5): Use 95/5 or 90/10 thresholds. Standard 70/30 will trigger on every minor move.
- RSI(7–9): Use 80/20 thresholds for meaningful signals with less noise.
- RSI(14): Standard 70/30 thresholds work well across most assets.
- RSI(21–25): Consider loosening to 65/35, since the smoother line rarely reaches standard extremes.
- RSI(50+): Use 60/40 or simply watch for the RSI centerline (50) as the primary signal level.
For a deep dive into using these levels effectively in live trading, see our guide on RSI Overbought and Oversold Levels: Master the Signals.
RSI Settings for Divergence Trading
RSI divergence — where price makes a new high or low that the RSI doesn't confirm — is one of the most powerful signals the indicator produces. Period settings affect how clearly divergences appear and how reliable they are.
For classic divergence trading (identifying potential reversals), RSI(14) on daily or 4-hour charts tends to produce the clearest and most reliable divergence patterns. The smoothing is sufficient to make the divergence visually obvious without hiding it under excessive noise.
For hidden divergence (continuation signals within trends), some traders prefer RSI(10) or RSI(12) to capture the momentum imbalance slightly earlier, particularly on intraday timeframes.
Learn more about spotting these patterns in our guides on RSI Divergence Explained: Master Bullish & Bearish Signals and Hidden RSI Divergence: The Advanced Signal Most Traders Miss.
Multi-Period RSI: Using Two Settings Together
Professional traders often use two RSI periods simultaneously to get both a fast signal and a confirmation filter. Common combinations include:
- RSI(7) + RSI(21): The fast RSI generates the signal; the slow RSI confirms momentum direction. Only take trades when both point the same way.
- RSI(9) + RSI(14): A moderate combination for daily chart swing traders who want slightly earlier signals with standard-period confirmation.
- RSI(2) + RSI(14): The 2-period triggers the mean-reversion entry; the 14-period confirms the stock isn't in a severe downtrend (should be above 40 for long trades).
This multi-period approach mirrors how the Stocks365 signals dashboard synthesizes multiple technical factors — including momentum readings across timeframes — into a unified trust score, rather than relying on a single indicator or setting.
How to Test and Validate Your RSI Settings
Before committing to any RSI configuration with real capital, proper backtesting is essential. Here's a structured approach:
- Define your rules precisely: What period? What thresholds? What constitutes an entry signal? What's the exit condition?
- Use sufficient historical data: At minimum, test across 200–500 signals or 3–5 years of data on your target timeframe.
- Test across multiple market conditions: Bull markets, bear markets, and sideways consolidation periods all behave differently. An RSI setting that crushes it in a bull market may destroy capital in a bear market.
- Measure what matters: Win rate alone is meaningless. Track risk-adjusted returns, maximum drawdown, and Sharpe ratio.
- Avoid overfitting: If you optimize RSI settings specifically to maximize past returns, those settings will likely underperform going forward. Use out-of-sample testing.
For a complete framework on applying RSI in real trading contexts after you've determined your settings, see How to Use RSI in Trading: The Ultimate Step-by-Step Guide.
Common RSI Settings Mistakes to Avoid
- Using day trading RSI settings on swing trade charts — A 7-period RSI on a daily chart will generate excessive signals that don't suit multi-day holding periods.
- Never changing the default — The 14-period RSI is a starting point, not a conclusion. Evaluate whether it genuinely suits your specific strategy.
- Ignoring the asset's volatility profile — High-volatility assets like TSLA may need slightly higher period settings to filter noise; low-volatility assets may benefit from shorter periods to capture enough movement.
- Not adjusting thresholds with period changes — As covered above, your overbought/oversold levels need to move with your period setting.
- Optimizing for one market phase — The best RSI setting for a bull market often performs poorly in a bear market. Your settings should be robust across conditions, not optimized for one.
Key Takeaways
- Period length controls RSI sensitivity: Shorter periods = more signals, more noise. Longer periods = fewer signals, higher reliability.
- Match settings to your timeframe: Day traders favor RSI(7–9); swing traders favor RSI(10–14); position traders favor RSI(14–21) on weekly charts.
- Always adjust thresholds with period changes: Short-period RSI needs higher overbought (80–90) and lower oversold (10–20) thresholds.
- RSI(2) is a specialized mean-reversion tool: Highly effective in uptrending markets when used with strict rules and risk management.
- Multi-period RSI approaches combine early signal detection with confirmation, improving both entry timing and signal quality.
- Backtest rigorously across multiple market conditions before applying any RSI setting with real capital.
- The 14-period default is a sensible starting point — but professional traders evaluate and refine it based on their specific strategy and asset class.
Frequently Asked Questions
What is the best RSI period setting for day trading?
For day trading on 1-minute to 5-minute charts, RSI(7) or RSI(9) with overbought/oversold levels set at 80/20 tends to work well. On 15-minute charts, RSI(14) with standard 70/30 levels is a solid choice. The key is matching the period to your holding time — shorter periods for shorter holds, longer periods for longer intraday positions.
Is RSI(14) still the best default setting in 2024?
RSI(14) remains the most widely used setting and performs adequately across most daily and weekly chart strategies. However, "best" depends entirely on your strategy. Many professional traders find RSI(10) or RSI(12) outperforms the default on daily charts for swing trading, while others use RSI(21) for higher-conviction signals. Test your specific use case rather than assuming the default is optimal.
How do I choose between RSI(9) and RSI(14)?
RSI(9) is more sensitive and generates earlier signals, which suits traders who want to enter positions before momentum fully develops. RSI(14) is smoother and more reliable, generating fewer but higher-quality signals. If you find RSI(14) signals are arriving too late for your entries, try RSI(10) or RSI(11) as an intermediate step before moving to RSI(9).
Should I use different RSI settings for different stocks?
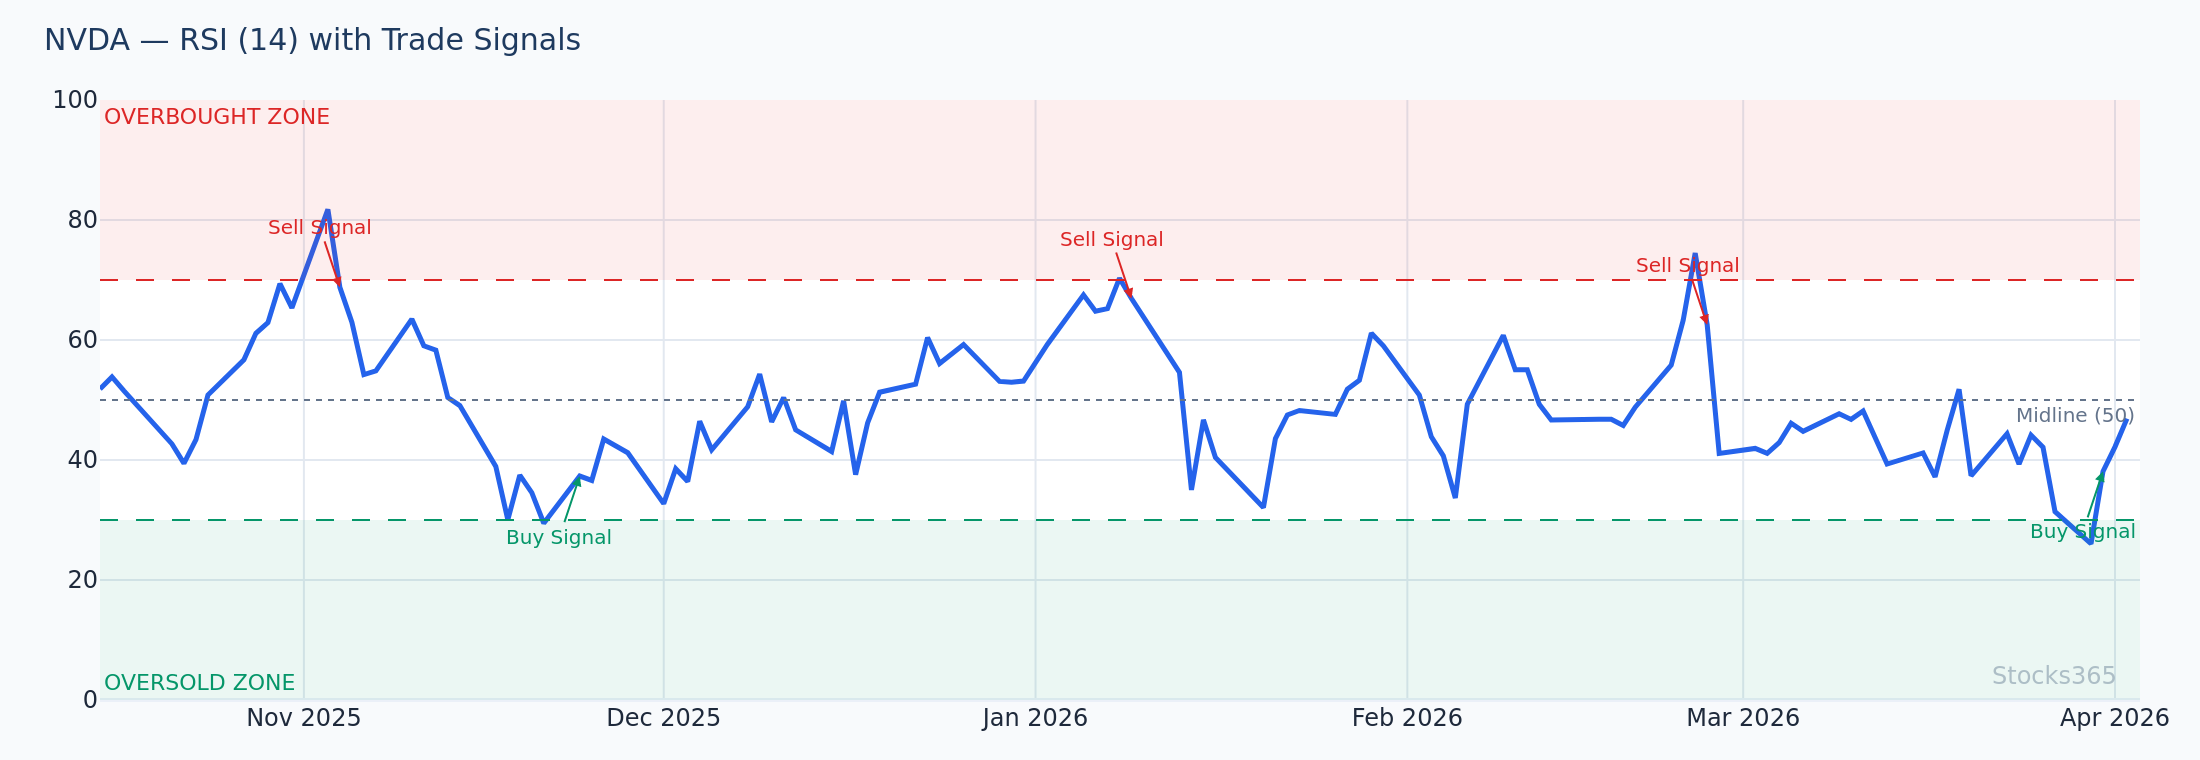
Yes — particularly when accounting for volatility. High-beta, high-volatility stocks like NVDA or TSLA may benefit from slightly longer RSI periods to filter noise, while lower-volatility blue chips may work fine with shorter settings. However, using dramatically different settings for every stock adds complexity. Many traders use one or two standard settings across all assets and adjust thresholds (overbought/oversold levels) instead of changing the period.
Can I use RSI settings to improve divergence signals?
Absolutely. RSI(14) on daily or 4-hour charts produces the clearest divergence patterns for most traders. Shorter periods can make divergences harder to spot due to noise, while longer periods may delay the signal considerably. For divergence trading specifically, RSI(14) is hard to beat as a baseline. See our complete guides on RSI Divergence and Hidden RSI Divergence for detailed strategies.