
What Is Hidden RSI Divergence and Why Most Traders Ignore It
Most traders learn about RSI divergence as a reversal signal — and stop there. They watch for regular divergence, fade exhausted trends, and move on. But buried beneath the surface is a far more powerful concept that the majority of retail traders never master: hidden RSI divergence.
While regular RSI divergence signals potential trend reversals, hidden divergence does the opposite. It signals trend continuation — arguably the more valuable of the two, since trading with the prevailing trend is statistically the higher-probability approach. If you've ever been stopped out of a perfectly good trend trade only to watch price resume its original direction without you, hidden RSI divergence is likely the signal you were missing.
In this guide, we'll break down exactly what hidden RSI divergence is, how it forms, how to trade it with precision, and why platforms like Stocks365's signals dashboard make identifying these setups dramatically more efficient.
Quick Refresher: How RSI Works Before Diving Into Hidden Divergence
Before we go deep, let's make sure the foundation is solid. The Relative Strength Index (RSI) is a momentum oscillator that fluctuates between 0 and 100. It measures the speed and magnitude of recent price changes to evaluate whether an asset is potentially overbought or oversold.
If you're new to the indicator altogether, start with our complete beginner's guide to RSI before continuing. For those who want to understand the math powering the signal, our formula breakdown explains RSI calculation step by step.
The critical insight for divergence trading is this: RSI doesn't just tell you overbought or oversold levels — it tells you whether momentum is confirming or contradicting price action. That relationship between price and momentum is the entire foundation of divergence analysis.
Regular vs. Hidden RSI Divergence: The Core Difference
To understand hidden divergence, you must first clearly distinguish it from regular divergence. These two concepts are mirror images of each other in terms of what they predict.
Regular RSI Divergence (Reversal Signal)
Regular bullish divergence occurs when price makes a lower low, but RSI makes a higher low. This means selling momentum is weakening even as price drops — a potential bottom is forming.
Regular bearish divergence occurs when price makes a higher high, but RSI makes a lower high. Buying momentum is fading even as price rises — a potential top is forming.
These are counter-trend signals. You're betting that the current trend is exhausted and about to reverse.
Hidden RSI Divergence (Continuation Signal)
Hidden bullish divergence occurs when price makes a higher low, but RSI makes a lower low. Price is respecting the uptrend structure (higher lows), while RSI temporarily dips lower — suggesting a brief pullback within a larger uptrend is nearing its end.
Hidden bearish divergence occurs when price makes a lower high, but RSI makes a higher high. Price is respecting the downtrend structure (lower highs), while RSI temporarily pops higher — suggesting a brief bounce within a larger downtrend is nearing its end.
The golden rule: Regular divergence tells you the trend may be ending. Hidden divergence tells you the trend is likely to continue. Hidden divergence traders aren't fading the trend — they're joining it at a discount.
Hidden Bullish RSI Divergence: Deep Dive and Trade Setup
How Hidden Bullish Divergence Forms
Hidden bullish RSI divergence appears during uptrends. As price pulls back to a higher low — confirming the uptrend structure is intact — RSI drops to a reading that is actually lower than the previous RSI low. This seems counterintuitive at first. Shouldn't stronger price structure mean stronger RSI?
Not necessarily. RSI is measuring recent momentum relative to recent price action. During a healthy pullback in an uptrend, short-term selling pressure can push RSI temporarily lower, even though the broader trend structure remains bullish. The divergence tells you that this pullback is likely temporary — the underlying trend momentum is still present and will reassert itself.
Real Trading Example: NVDA Hidden Bullish Divergence
Consider a practical scenario on NVIDIA (NVDA) during a sustained uptrend:
- Swing 1: Price bottoms at $420, RSI reads 38
- Trend resumes: NVDA rallies to $490
- Pullback begins: Price retraces to $445 (a higher low vs. $420 — uptrend intact)
- RSI at pullback low: RSI reads 32 (lower low vs. 38 — hidden divergence confirmed)
The price structure says "uptrend" (higher low at $445). The RSI says "momentum dipped lower" (32 vs. 38). This contradiction is your hidden bullish divergence signal. The smart trade? Enter long near $445 with a stop below $420, targeting a continuation toward $500+.
Entry, Stop, and Target Guidelines for Hidden Bullish Setups
- Entry: Enter long at or near the higher low in price, ideally confirmed by a bullish candlestick pattern (hammer, engulfing, or morning star)
- Stop loss: Place below the most recent swing low — if price breaks that level, the uptrend structure is violated and the signal is invalidated
- Target: Prior highs, measured move projections, or key resistance levels
- Risk-reward: Look for a minimum 1:2 risk-reward ratio; hidden divergence in strong trends can easily deliver 1:3 or better
Hidden Bearish RSI Divergence: Deep Dive and Trade Setup
How Hidden Bearish Divergence Forms
Hidden bearish RSI divergence appears during downtrends. Price bounces to a lower high — confirming the downtrend structure — while RSI rises to a higher high. Again, the paradox: price is making a weaker bounce, but RSI is recording stronger short-term momentum?
Yes. During a relief bounce within a downtrend, buying pressure can temporarily elevate RSI above recent readings even as price fails to recapture prior highs. The hidden bearish divergence signals that this bounce is a selling opportunity — the downtrend has not ended and is likely to resume.
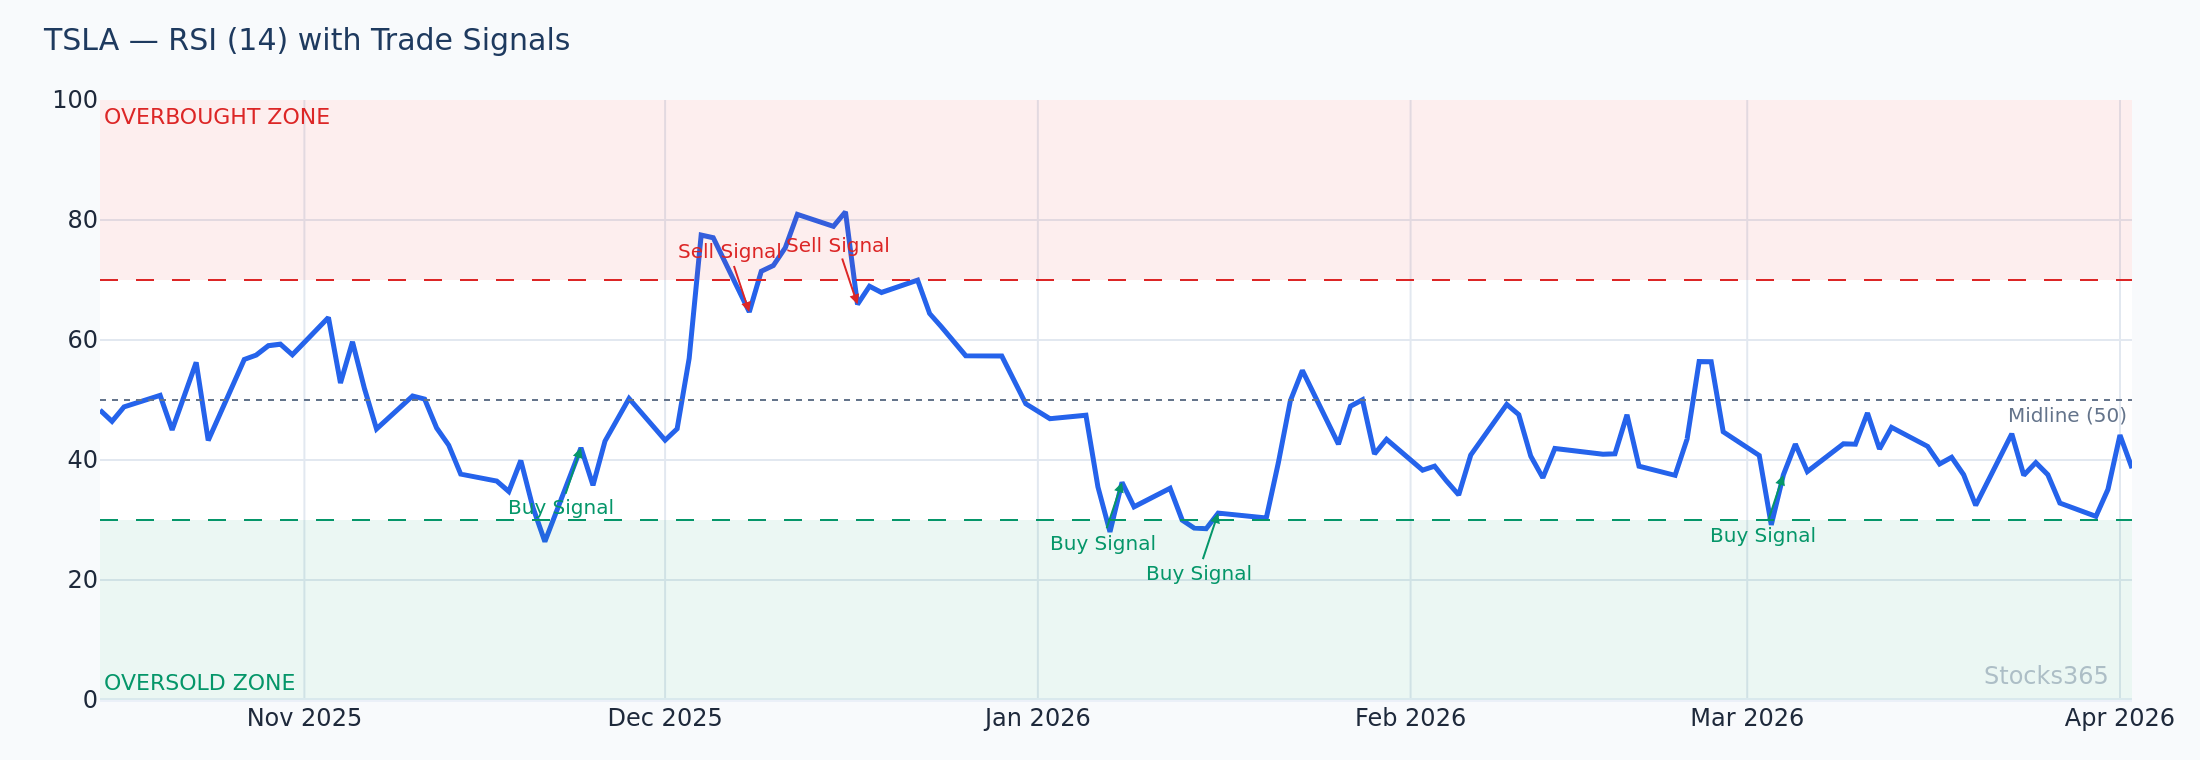
Real Trading Example: TSLA Hidden Bearish Divergence
Here's how this might look on Tesla (TSLA) during a downtrend:
- Swing 1: Price peaks at $210 during a bounce, RSI reaches 58
- Downtrend resumes: TSLA falls to $175
- Bounce begins: Price recovers to $195 (a lower high vs. $210 — downtrend intact)
- RSI at bounce high: RSI reads 63 (higher high vs. 58 — hidden bearish divergence confirmed)
Price is making a weaker bounce ($195 vs. $210), but RSI is temporarily elevated (63 vs. 58). This is your hidden bearish divergence signal. The trade: short near $195 with a stop above $210, targeting a continuation toward $160 and below.
Entry, Stop, and Target Guidelines for Hidden Bearish Setups
- Entry: Enter short at or near the lower high in price, confirmed by bearish candlestick signals (shooting star, bearish engulfing, evening star)
- Stop loss: Above the most recent swing high — a break there invalidates the downtrend structure
- Target: Prior lows, measured move projections, or key support levels
- Risk-reward: Target 1:2 minimum; momentum continuation in established downtrends can extend substantially
The 5-Step Framework for Trading Hidden RSI Divergence
Identifying hidden divergence is one thing. Trading it profitably requires a structured approach. Here's the exact five-step framework professional traders use:
Step 1: Confirm the Prevailing Trend
Hidden divergence only works with the trend, not against it. Before looking for hidden divergence signals, confirm the primary trend using higher timeframe analysis. Use the 50-day and 200-day moving averages, trendlines, or higher-highs/higher-lows structure. If the trend isn't clear, skip the setup entirely.
Step 2: Wait for a Meaningful Pullback or Bounce
You need price to pull back enough to create a new swing point. A trivial one-candle dip doesn't create a valid hidden divergence setup. Look for multi-day pullbacks in daily timeframes, or multi-bar retracements on intraday charts. The pullback should feel uncomfortable — like the trend might actually be ending. That's usually when hidden divergence appears.
Step 3: Identify the RSI Contradiction
Compare the RSI reading at the new swing point to the RSI reading at the previous corresponding swing point. For hidden bullish divergence: new RSI low should be lower than the previous RSI low, while price made a higher low. For hidden bearish divergence: new RSI high should be higher than the previous RSI high, while price made a lower high.
Understanding RSI overbought and oversold levels helps contextualize these readings — but note that in hidden divergence, you're not necessarily looking for extreme levels. The divergence itself is the signal.
Step 4: Look for Candlestick Confirmation
Never enter on the divergence alone. Wait for a reversal candlestick at the swing point to confirm that price is actually turning back in the trend direction. A hammer, bullish engulfing, or doji at a hidden bullish divergence point significantly increases the probability of a successful trade.
Step 5: Execute With Defined Risk
Set your stop loss at a logical invalidation point (below the swing low for longs, above the swing high for shorts). Calculate your position size based on that stop distance and your risk tolerance. For a deeper look at full trading execution with RSI, see our ultimate step-by-step RSI trading guide.
Common Mistakes When Trading Hidden RSI Divergence
Mistake 1: Trading Hidden Divergence Against the Trend
This is the most common — and most costly — error. If you spot what looks like hidden bullish divergence but the broader trend is bearish, you're misreading the signal. Hidden divergence only works as a continuation pattern. Trading it in the wrong trend direction essentially turns it into a random entry with no statistical edge.
Mistake 2: Ignoring Timeframe Context
A hidden bullish divergence on a 5-minute chart might form within a larger bearish trend on the hourly chart. Always anchor your hidden divergence analysis to the dominant timeframe for your trading style. Day traders should check the daily trend; swing traders should check the weekly trend.
Mistake 3: Entering Without Confirmation
Just because you see the RSI contradiction doesn't mean the pullback is over. Price can continue lower (or higher) before resuming trend direction. Waiting for candlestick confirmation or a break of a short-term resistance (for longs) or support (for shorts) dramatically improves win rates.
Mistake 4: Confusing Regular and Hidden Divergence
This is a critical conceptual error that leads to taking continuation trades when reversal signals are present, and vice versa. Always ask: Is the price structure making higher lows or lower highs (trend continuation context)? If yes, you might have hidden divergence. If price is making lower lows or higher highs (against trend), look for regular divergence instead.
How Stocks365 Helps You Catch Hidden RSI Divergence Signals
Manually scanning hundreds of stocks for hidden RSI divergence setups is time-intensive and error-prone. This is exactly where algorithmic signal detection creates a genuine trading edge.
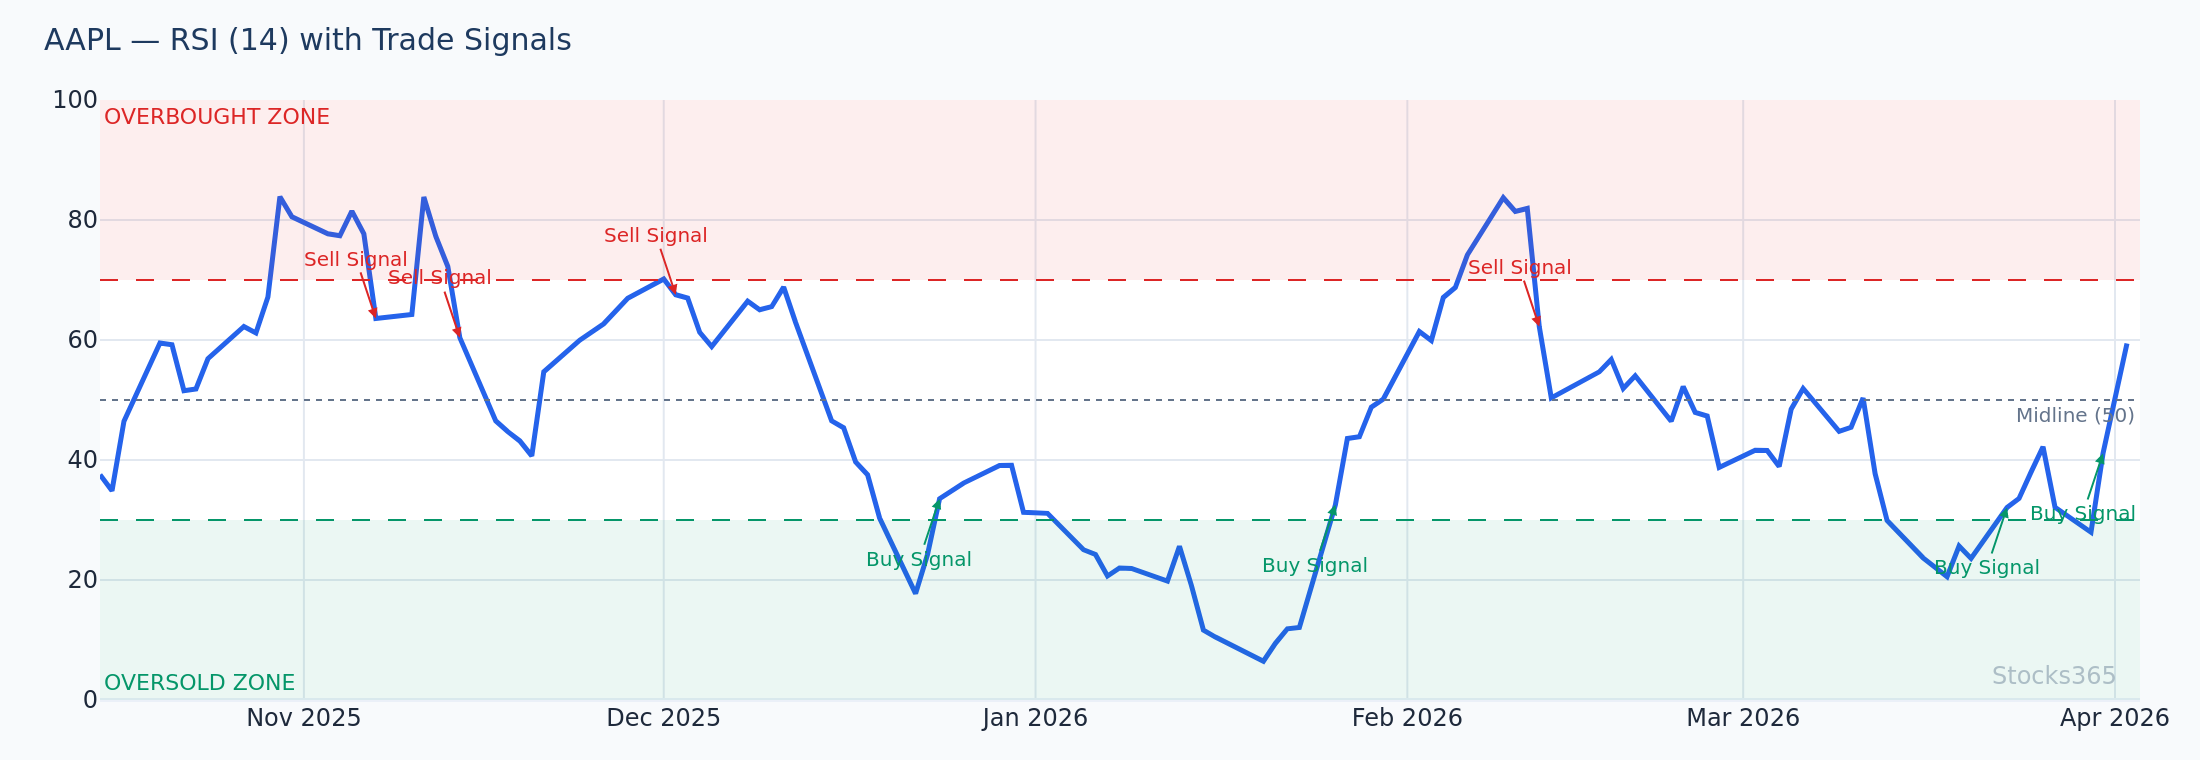
The Stocks365 signals dashboard applies systematic momentum analysis across thousands of instruments in real time, surfacing setups that human scanning would miss. Each signal comes with a Trust Score — a composite rating that evaluates the quality and confluence of the setup based on multiple technical factors.
When a stock like Apple (AAPL) generates a hidden divergence-based continuation signal, the Trust Score reflects not just the RSI condition, but also volume behavior, trend strength, and candlestick confirmation — giving you a richer picture than any single indicator could provide.
The practical result: instead of spending hours hunting for setups, traders can focus on evaluating and executing high-quality signals that have already been pre-screened for technical validity.
Hidden RSI Divergence Across Different Markets and Timeframes
Stocks and Equities
Hidden RSI divergence works exceptionally well in trending equity markets. Growth stocks in sustained uptrends — especially in sectors like technology or semiconductors — frequently offer textbook hidden bullish divergence setups during earnings-driven or macro-driven pullbacks.
Forex and Crypto
In forex, currency pairs in established trends (driven by interest rate differentials or economic divergence) provide clean hidden divergence setups. Cryptocurrencies, known for volatile but often trend-persistent moves, also offer frequent hidden divergence opportunities — though the higher volatility demands wider stops and more conservative position sizing.
Timeframe Considerations
Hidden RSI divergence functions on any timeframe, but signal reliability increases with higher timeframes. A hidden bullish divergence on the weekly chart carries significantly more weight than the same pattern on a 15-minute chart. For swing traders, the daily and weekly timeframes offer the best balance of signal quality and trade frequency.
📌 Key Takeaways
- Hidden RSI divergence is a trend continuation signal, not a reversal signal — this is the most important distinction from regular divergence.
- Hidden bullish divergence: price makes higher low, RSI makes lower low — signals uptrend continuation after a pullback.
- Hidden bearish divergence: price makes lower high, RSI makes higher high — signals downtrend continuation after a bounce.
- Always confirm the prevailing trend first. Hidden divergence only works in the direction of the dominant trend.
- Wait for candlestick confirmation before entering — never trade on the RSI signal alone.
- Use defined stop losses placed at logical trend-invalidation points.
- The Stocks365 Trust Score system helps quantify signal quality by combining RSI analysis with other technical factors.
- Higher timeframes produce more reliable hidden divergence signals than lower timeframes.
Frequently Asked Questions
What is the difference between hidden RSI divergence and regular RSI divergence?
Regular RSI divergence is a reversal signal — it occurs when price and RSI move in opposite directions at trend extremes, suggesting the trend may be ending. Hidden RSI divergence is a continuation signal — it occurs during pullbacks within existing trends, where price maintains its trend structure but RSI temporarily contradicts it. The two signals predict opposite outcomes, which is why correctly identifying which type you're looking at is critically important.
Is hidden bullish divergence reliable?
Hidden bullish divergence is considered one of the higher-probability technical signals when properly applied, primarily because it aligns with the prevailing trend. Like any technical signal, it is not 100% reliable and should be combined with trend confirmation, candlestick analysis, volume context, and sound risk management. Its reliability improves significantly on higher timeframes (daily, weekly) compared to intraday charts.
What RSI settings work best for hidden divergence trading?
The default 14-period RSI is the most widely used setting for divergence analysis and remains the standard recommendation. Some traders use a shorter period (9 or 10) for more sensitivity on intraday charts. The key is consistency — use the same setting for identifying both the reference swing RSI reading and the new swing RSI reading when looking for divergence.
Can hidden RSI divergence occur at overbought or oversold levels?
Yes, it can, though it doesn't require extreme RSI readings. In a strong uptrend, hidden bullish divergence might form with RSI readings in the 40–55 range — well away from oversold territory. The divergence is about the relationship between two RSI readings at successive swing points, not about the absolute level. That said, when hidden divergence occurs near meaningful RSI levels, confluence increases the signal quality.
How do I find hidden RSI divergence signals automatically?
Manual scanning for hidden RSI divergence across many stocks is time-consuming and prone to human error. Algorithmic platforms like Stocks365 scan markets systematically for divergence conditions in real time, applying additional filters like trend strength and volume confirmation. This significantly reduces the time required to surface quality setups and helps eliminate the cognitive bias of seeing patterns that aren't truly there.