
What Is RSI Divergence? The Signal Most Traders Miss
Of all the tools available in technical analysis, RSI divergence stands out as one of the most powerful — and most misunderstood — signals a trader can use. While most beginners focus on whether RSI is overbought or oversold, experienced traders know that the relationship between price movement and RSI often tells the deeper story.
In simple terms, RSI divergence occurs when the price of an asset moves in one direction while the RSI indicator moves in the opposite direction. This disconnect — or divergence — is a warning that the current trend may be losing momentum and a reversal could be on the horizon.
If you're new to the RSI indicator altogether, we recommend starting with our complete beginner's guide to RSI before diving into divergence. Understanding the foundation makes everything else click much faster.
Key Concept: Divergence doesn't tell you when a reversal will happen — it tells you that the current move is weakening. It's a warning signal, not a trigger.
The Two Main Types of RSI Divergence
RSI divergence comes in two core flavors: bullish divergence and bearish divergence. Each sends a different message about where price may be heading. Let's break both down with real-world context.
Bullish RSI Divergence: A Hidden Buy Signal
Bullish RSI divergence forms when price makes a lower low — a new bottom below the previous trough — but the RSI simultaneously makes a higher low. In other words, price is still falling, but the selling momentum is clearly weakening.
This pattern suggests that bears are exhausting themselves. Despite pushing prices lower, they're doing so with decreasing force. Smart money often begins accumulating during this phase, and a reversal to the upside frequently follows.
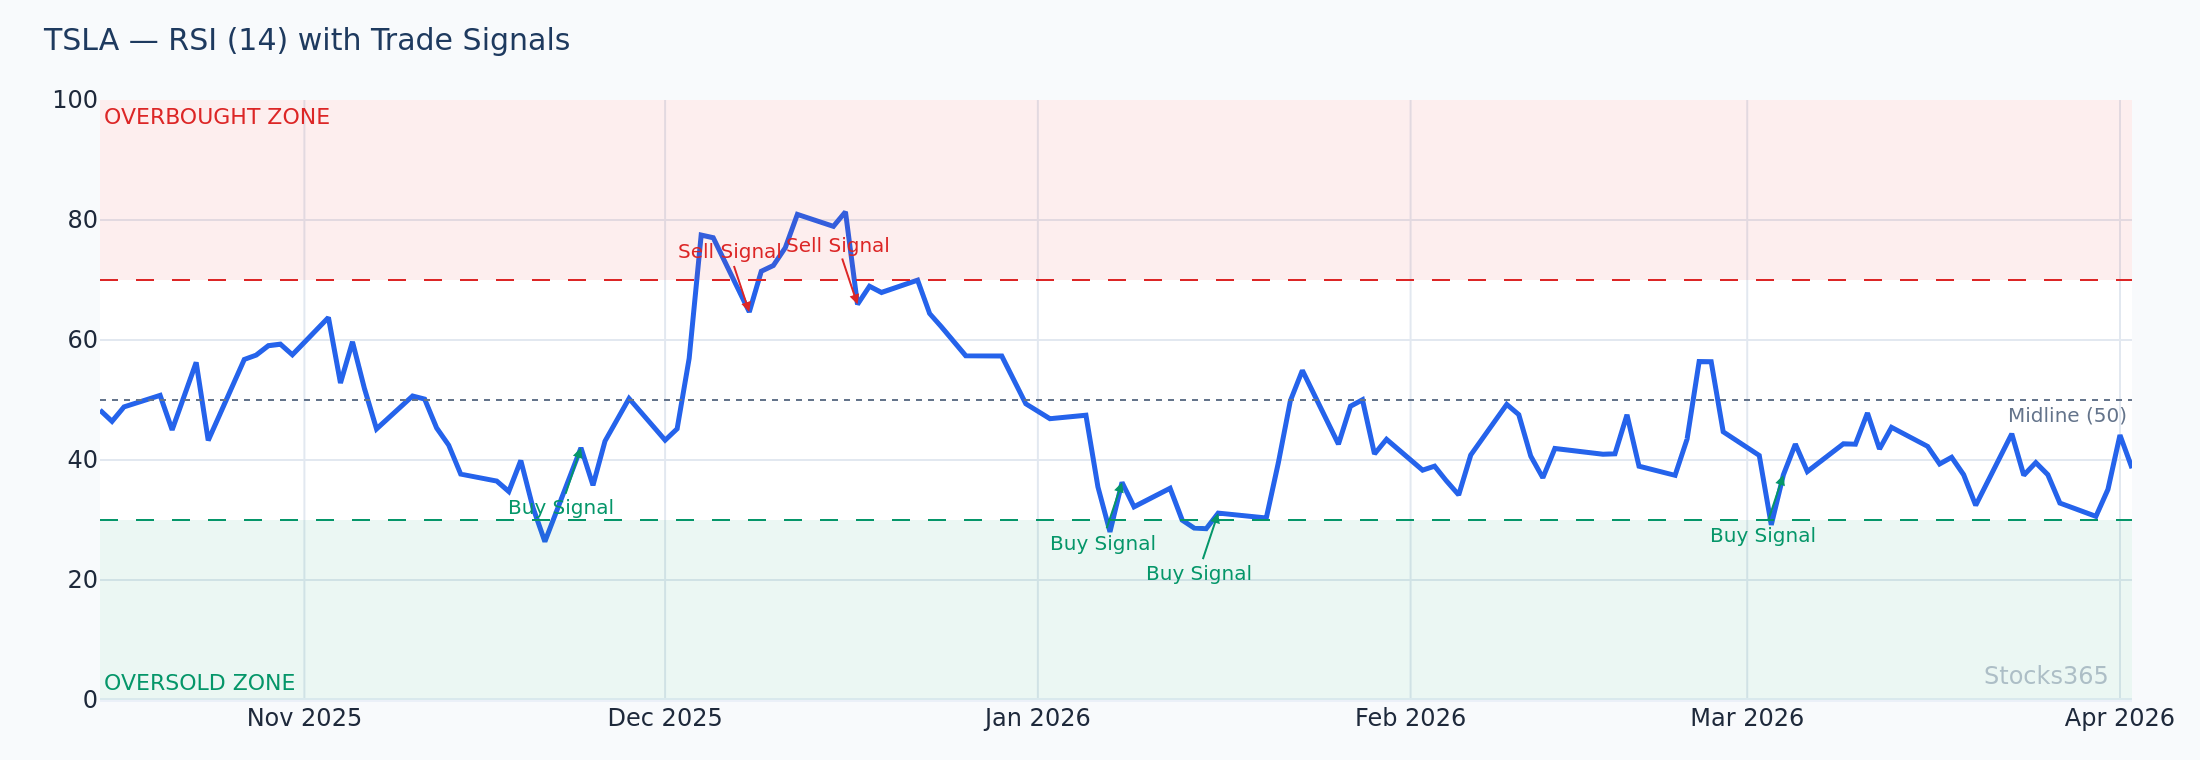
Practical Example: Imagine TSLA drops from $250 to $210 (Low #1), then pulls back to $230, then falls again to $195 (Low #2 — a lower low). Meanwhile, the RSI reads 32 at the first low and 38 at the second low (a higher low). This is textbook bullish divergence. Price went lower, but RSI went higher — the bears are running out of steam.
- Price pattern: Lower low (price #2 < price #1)
- RSI pattern: Higher low (RSI #2 > RSI #1)
- Signal: Potential bullish reversal ahead
- Best context: Often appears near or below the RSI oversold zone (below 30)
Bearish RSI Divergence: A Hidden Sell Signal
Bearish RSI divergence is the opposite. It forms when price makes a higher high — a new peak above the prior top — while RSI prints a lower high. Price is still climbing, but it's doing so on weakening momentum. Buyers are pushing price up, but with less conviction each time.
This is one of the most reliable warning signals that an uptrend may be nearing its end. Institutional traders often begin reducing exposure or initiating short positions when they spot this pattern forming near key resistance levels.
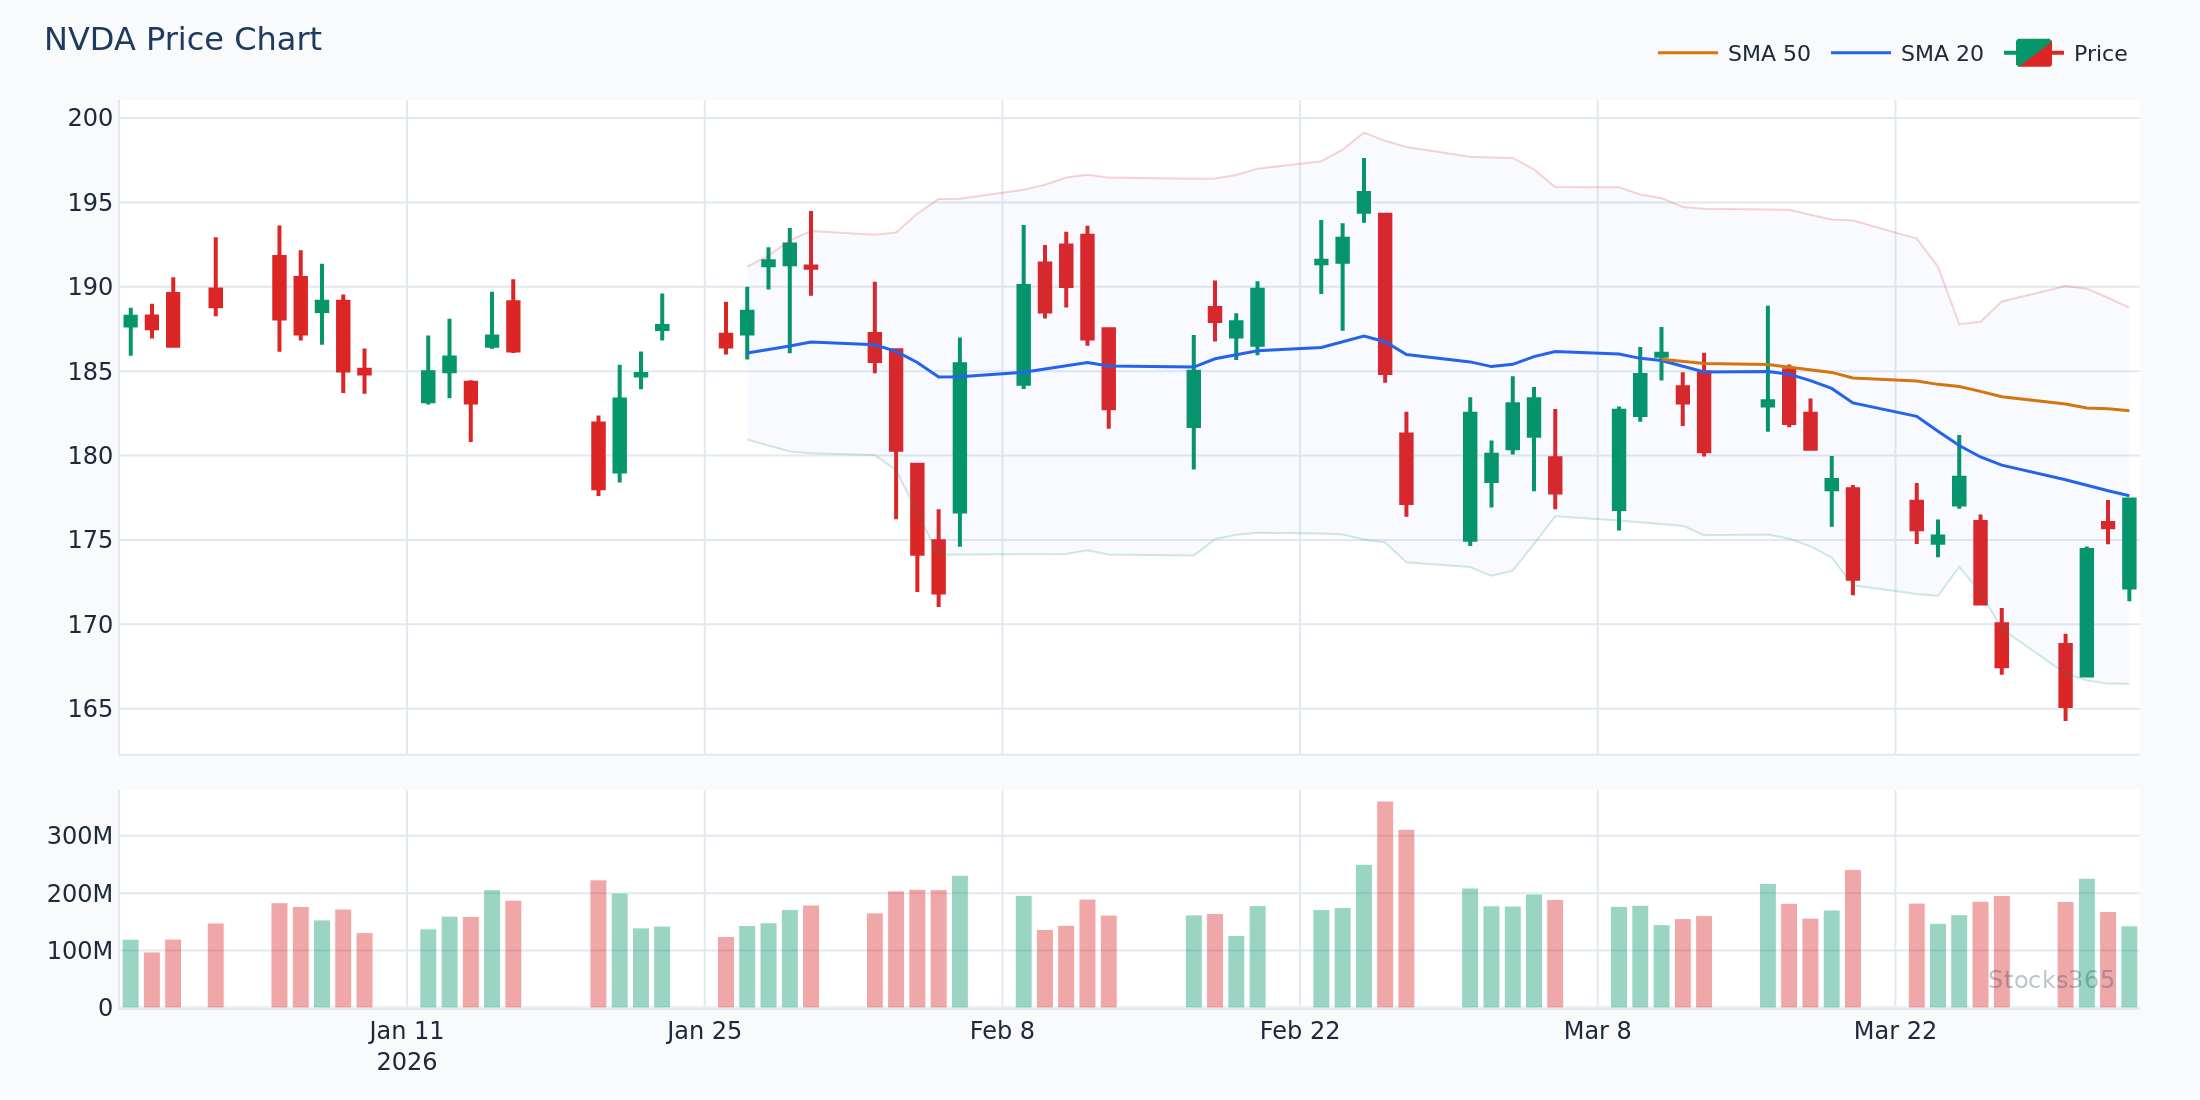
Practical Example: NVDA rallies from $800 to $950 (High #1), dips to $880, then pushes up again to $985 (High #2 — a higher high). But RSI registered 71 at High #1 and only 64 at High #2. Price made a new high; RSI didn't. That's bearish divergence — and a potential short opportunity or exit signal for longs.
- Price pattern: Higher high (price #2 > price #1)
- RSI pattern: Lower high (RSI #2 < RSI #1)
- Signal: Potential bearish reversal ahead
- Best context: Often appears near or above the RSI overbought zone (above 70)
Hidden Divergence: The Advanced Version Most Traders Don't Know
Beyond the classic divergence patterns, there's a more advanced concept called hidden divergence. While regular divergence signals potential reversals, hidden divergence signals potential trend continuation.
Hidden Bullish Divergence
This occurs when price makes a higher low (staying above the prior trough — bullish structure) but RSI makes a lower low. This suggests the pullback is temporary and the uptrend is likely to resume. It's particularly useful for traders looking to enter pullbacks within an existing uptrend.
Hidden Bearish Divergence
This forms when price makes a lower high (downtrend structure intact) but RSI makes a higher high. This suggests the bounce is merely corrective and the downtrend will likely continue — a signal to stay short or avoid buying the dip.
Pro Tip: Use hidden divergence to stay in trades, and regular divergence to exit or reverse trades. Together, they form a complete divergence trading framework.
How to Identify RSI Divergence: A Step-by-Step Process
Spotting divergence correctly requires discipline and a systematic approach. Many traders misidentify it because they draw their trendlines sloppily or look in the wrong places. Here's a reliable method:
Step 1: Identify Significant Swing Points on Price
Look for clear, notable swing highs or swing lows on the price chart. These should be obvious turning points, not minor noise. On a daily chart, this means distinct peaks and troughs that lasted at least several sessions.
Step 2: Find Corresponding Swing Points on the RSI
Directly below (or above, if applicable) each price swing, locate the corresponding RSI swing. These don't have to occur on the exact same candle — they should be in the same general region.
Step 3: Compare Direction
Now compare: Is price making a higher high while RSI makes a lower high? Or a lower low while RSI makes a higher low? If the directions diverge, you've found your signal. If they move in the same direction, there's no divergence.
Step 4: Draw Trendlines on Both
Connect the two price swing points with a straight line. Do the same on the RSI. The visual angle of these lines should clearly diverge — not just be slightly different. The more obvious the divergence, the more meaningful the signal.
Step 5: Confirm with Context
Divergence is most powerful when it forms at key support/resistance levels, after extended trends, or when RSI is already in overbought/oversold territory. Learn more about RSI overbought and oversold levels to sharpen your confirmation process.
Why RSI Divergence Works: The Momentum Logic
To truly trust any technical signal, you should understand why it works. RSI divergence is rooted in the mathematics of momentum. The RSI formula measures the average gain versus average loss over a set period. When price makes a new high but RSI doesn't, it means the most recent rallying sessions were less powerful than the previous ones — even though price got higher.
Think of it like a sprinter who keeps winning races but by smaller and smaller margins. They're still winning, but they're clearly getting tired. Eventually, they'll lose. That's exactly what bearish RSI divergence captures.
For a deeper understanding of the math behind this, our article on how RSI is calculated walks through the formula step by step — understanding it gives you a real edge in interpreting divergence correctly.
RSI Divergence Trading Strategy: Practical Rules
Divergence alone is rarely enough to pull the trigger on a trade. The most successful traders combine it with other factors to build high-probability setups. Here's a structured approach:
Rule 1: Wait for Price Confirmation
Don't enter the moment you spot divergence. Wait for a confirming price action signal — a bearish engulfing candle, a break below support, or a decisive close in the reversal direction. Divergence can persist for multiple candles before resolving.
Rule 2: Use Higher Timeframes for Reliability
Divergence on a 4-hour or daily chart carries far more weight than on a 5-minute chart. Short-term divergence produces many false signals due to noise. Build your analysis on daily or weekly charts, then drill down to hourly for entry timing.
Rule 3: Align with Key Price Levels
Bearish divergence at a major resistance level? That's a high-quality setup. Bullish divergence bouncing off a key support zone? Even better. When technical confluence aligns — divergence + key level + RSI extreme — the probability of a successful trade rises significantly.
Rule 4: Set Clear Stop Losses
For bullish divergence trades, place your stop just below the most recent price low. For bearish divergence trades, stop just above the most recent price high. If the divergence thesis is correct, price shouldn't breach that level.
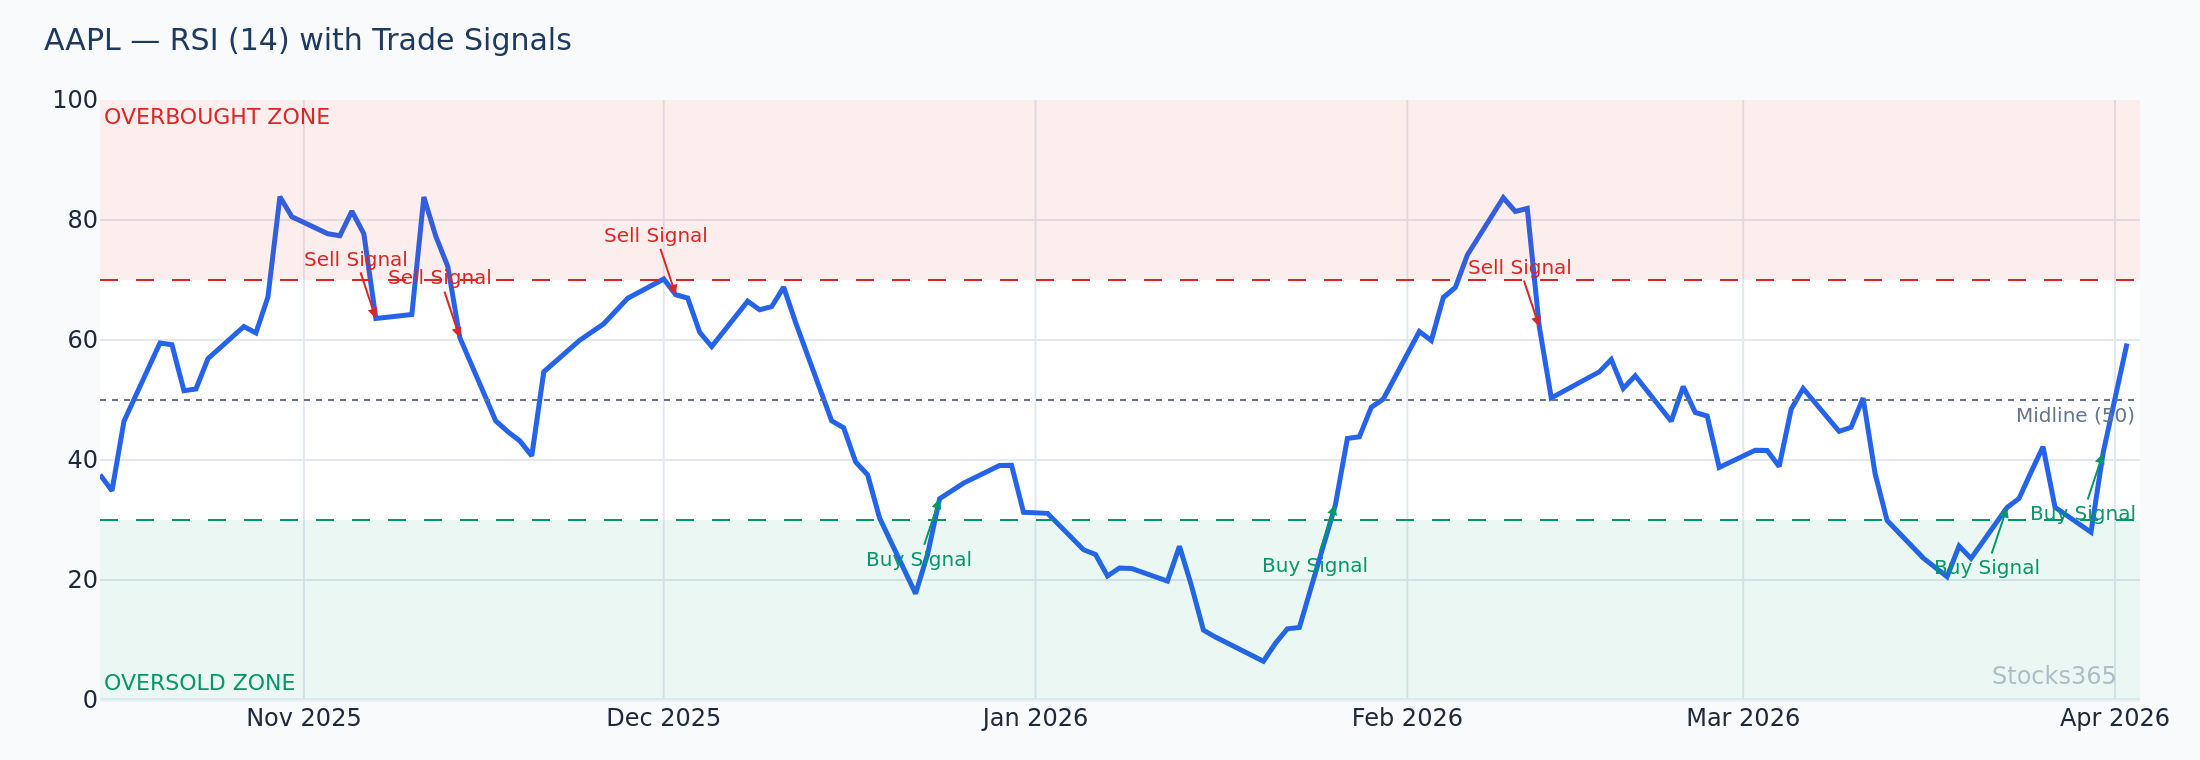
Rule 5: Use the Stocks365 Trust Score as a Filter
When trading based on divergence signals, the Stocks365 Trust Score provides an invaluable layer of validation. Stocks with high trust scores have more reliable technical setups — meaning divergence signals on a high-trust-score stock like AAPL are more likely to resolve cleanly than on illiquid, low-trust assets. Always check your asset's signal quality before committing capital.
Common RSI Divergence Mistakes to Avoid
Even experienced traders fall into traps when trading divergence. Here are the most common errors — and how to sidestep them:
- Comparing non-adjacent swings: Divergence should be drawn between the two most recent, adjacent swing points — not peaks separated by months of price action.
- Trading against a powerful trend: Divergence against a strong, momentum-driven trend (think NVDA in 2023) can be painful. Strong trends can sustain divergence for a long time before reversing.
- Ignoring volume: Low-volume divergence is less reliable. If price makes a new high on declining volume and RSI diverges, that's a much stronger warning than RSI divergence alone.
- Using the wrong RSI period: The default 14-period RSI is standard, but some traders use 9 or 21. Make sure your comparison is consistent — don't compare swings using different settings.
- Treating divergence as a standalone signal: Divergence is a warning, not a confirmed signal. Always require additional confirmation before entering.
RSI Divergence Across Different Markets
RSI divergence works across virtually every liquid market — stocks, ETFs, forex, commodities, and crypto. However, the optimal settings and interpretation may vary slightly:
Stocks and ETFs
Daily and weekly charts produce the most reliable divergence signals in equities. Earnings seasons can cause RSI to behave erratically, so be cautious trading divergence setups immediately before major earnings reports. For comprehensive guidance on applying RSI in stock trading, our ultimate RSI trading guide covers stock-specific strategies in depth.
Forex
In currency markets, 4-hour and daily divergence signals are widely used by professional traders. The 24/5 nature of forex means fewer gaps, making RSI readings cleaner and more consistent.
Crypto
Crypto markets are highly volatile, and RSI divergence here requires extra confirmation. False divergence signals are more common due to extreme moves. Use 4-hour or daily charts, and always pair with volume analysis.
Integrating RSI Divergence with Your Broader Trading System
The most profitable traders don't rely on a single signal — they build systems where multiple signals align before taking action. RSI divergence fits naturally into a broader technical toolkit:
- RSI divergence + Moving Average crossover: When bearish divergence aligns with a bearish MA crossover, conviction increases significantly.
- RSI divergence + Bollinger Band squeeze: A BB squeeze followed by divergence can signal explosive moves in the divergence direction.
- RSI divergence + candlestick patterns: A bearish engulfing or doji at the divergence high point is powerful confirmation.
- RSI divergence + support/resistance: The classic setup — divergence at a key level remains one of the most consistently profitable technical scenarios.
The Stocks365 signals dashboard makes this multi-factor analysis easier by aggregating key technical signals across thousands of stocks, saving you hours of manual scanning.
Key Takeaways
📊 RSI Divergence — Summary of What You've Learned:
- ✅ Bullish divergence: Price makes lower lows, RSI makes higher lows → potential upward reversal
- ✅ Bearish divergence: Price makes higher highs, RSI makes lower highs → potential downward reversal
- ✅ Hidden divergence signals trend continuation, not reversal
- ✅ Always wait for price confirmation before entering a trade based on divergence
- ✅ Divergence is most reliable on daily or higher timeframes
- ✅ Combine with key support/resistance levels for high-probability setups
- ✅ Use the Stocks365 Trust Score to filter for the highest-quality divergence setups
- ✅ Divergence is a warning signal, not a guaranteed reversal trigger
Frequently Asked Questions
What is RSI divergence in simple terms?
RSI divergence occurs when the price of an asset and the RSI indicator move in opposite directions. For example, if price makes a new high but RSI makes a lower high, that's bearish divergence — a warning that upside momentum is fading and a reversal may be coming. It's one of the most widely used momentum signals in technical analysis.
Is RSI divergence reliable?
RSI divergence is a reliable warning signal, but it's not a guaranteed predictor of reversal. Its reliability increases significantly when: it appears on higher timeframes (daily, weekly), it forms at key support or resistance levels, RSI is already in overbought or oversold territory, and it's confirmed by price action signals like candlestick patterns. Never trade divergence in isolation.
What is the difference between regular and hidden RSI divergence?
Regular divergence (bullish or bearish) signals a potential trend reversal. Hidden divergence signals a potential trend continuation. Regular bullish divergence: price lower low, RSI higher low. Hidden bullish divergence: price higher low, RSI lower low. Regular bearish divergence: price higher high, RSI lower high. Hidden bearish divergence: price lower high, RSI higher high.
Which RSI settings work best for spotting divergence?
The default 14-period RSI is the industry standard and works well for divergence analysis on most timeframes. Some swing traders prefer a 9-period RSI for more sensitivity, while position traders may use 21 periods for smoother signals. The most important thing is consistency — choose a setting and stick with it so your divergence comparisons are always apples-to-apples.
Can RSI divergence be used for day trading?
Yes, but with caution. RSI divergence on 5-minute or 15-minute charts produces far more false signals than on daily charts due to market noise. If you day trade using divergence, stick to at least the 1-hour chart for signal identification, and always combine with a strong price action confirmation. Intraday divergence is best used as a secondary signal rather than a primary entry trigger.