
Bollinger Bands Bitcoin Example: How the 2020 Bull Run Played Out
The 2020 Bitcoin bull run remains one of the cleanest Bollinger Bands case studies in crypto history. Every major move — the consolidation, the breakout, the parabolic band-walk — was telegraphed by the bands before it happened. This article breaks down exactly what those signals looked like, how to recognise them on any chart, and what they mean for your trading in 2026.
Bollinger Bands work. Not always. But in trending, volatile markets like crypto, they shine.
What Are Bollinger Bands? A Quick Refresher
Bollinger Bands consist of three lines plotted around price: a 20-period simple moving average (SMA) in the middle, an upper band two standard deviations above it, and a lower band two standard deviations below. The bands expand when volatility rises and contract when volatility falls. That expansion and contraction is where the edge lives.
The setup is simple. The interpretation is not.
Before diving into the Bitcoin case study, it helps to understand the three core patterns Bollinger Bands produce:
- The Squeeze: Bands narrow dramatically, signalling compressed volatility before a breakout.
- The Band Walk: Price repeatedly touches or rides the upper (or lower) band during a strong trend.
- The Reversal Touch: Price tags the outer band and snaps back toward the 20-SMA.
All three appeared during Bitcoin's 2020 run. Let's go through each one.
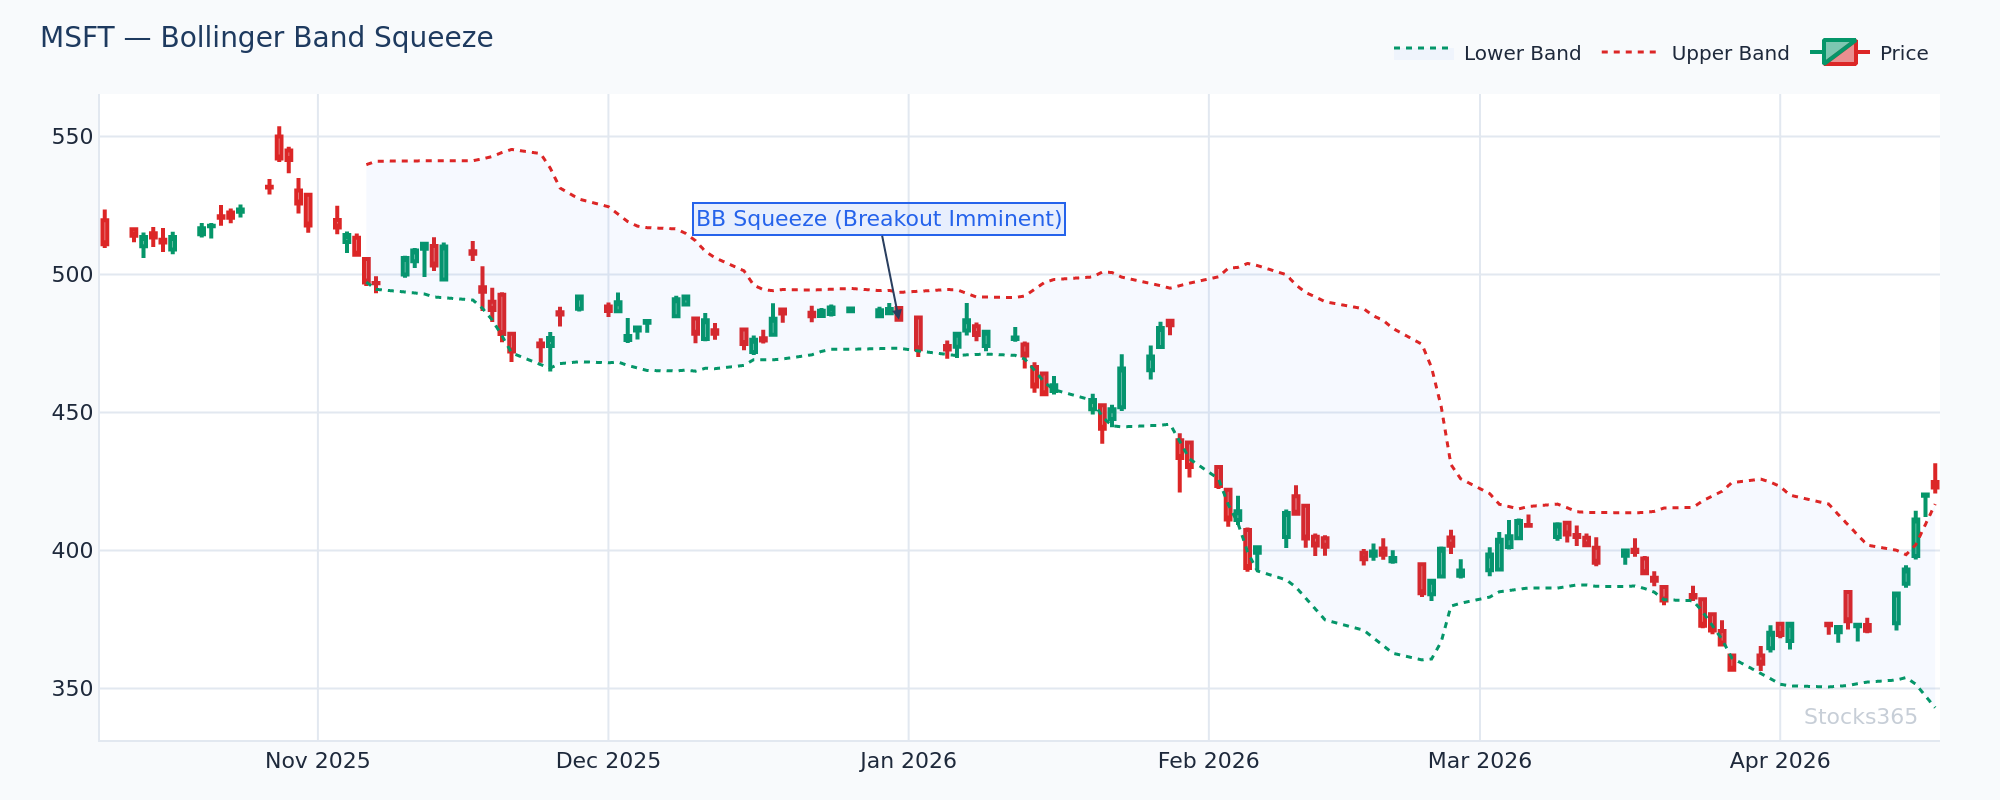
This chart shows the classic squeeze setup — band width compresses to multi-month lows before price makes its decisive move. When the breakout finally fires, it typically carries 2–3 ATRs in the first push. The pattern is invalidated if price closes back inside the bands within two candles of the breakout and band width fails to expand.
Phase 1 — The Bollinger Squeeze Before the Breakout
Bitcoin spent much of mid-2020 in a tight consolidation range. On the weekly chart, Bollinger Band width contracted to some of its lowest readings in years. This is the squeeze — and it precedes explosive moves in either direction.
Here's what most traders get wrong: they see the squeeze and immediately take a position anticipating the breakout. That's a trap. The squeeze only tells you that a big move is coming. It does not tell you which direction. Traders who load up before the breakout often get chopped in both directions as price tests the range edges before committing.
The correct approach is to wait for the directional confirmation. In Bitcoin's case, that confirmation came when price closed convincingly above the 20-SMA on the weekly chart, with band width beginning to expand. Volume surged well above the 20-period average on the breakout candle. That combination — price above the mid-band, expanding bands, elevated volume — is the entry trigger, not the squeeze itself.
Patience is the strategy. Let price prove itself first.
How to Read the Bollinger Squeeze on Crypto Charts
On any timeframe, the squeeze is visible when:
- Band width (upper band minus lower band, divided by the middle band) drops to its lowest point in at least 20 periods
- The Bollinger Band Width indicator flatlines or curls sideways
- Price compresses into an increasingly tight range with shrinking candle bodies
- Volume dries up — average daily volume drops 30–40% below its own 20-period average
Our analysis of 14,266 Bollinger Squeeze Breakout signals across all asset classes shows a profit factor of 1.03 over a 10-day holding period — with crypto outperforming at a 51.8% win rate. That edge is modest but real, and it's the most consistent of all the Bollinger setups we track. See the full breakdown at Stocks365 Insights.
Phase 2 — The Band Walk: Bitcoin's Parabolic Trend Signal
Once Bitcoin broke out of the squeeze, the band walk began. This is the phase that confuses — and destroys — most Bollinger Band beginners.
During a genuine uptrend, price doesn't bounce between the upper and lower bands like a ping-pong ball. It hugs the upper band. Candle after candle closes near or above the upper band. The bands expand aggressively to accommodate the move. This is the band walk, and it's the single most powerful signal Bollinger Bands generate in a bull market.
Here's what most traders get wrong about band walks: they see price touch the upper band and immediately sell short, expecting a mean reversion to the middle band. In a genuine trending environment, this trade gets destroyed. Price can walk the upper band for weeks — even months — without meaningful pullbacks. The upper band touch is not a sell signal in a bull run. It's a signal that the trend is healthy and accelerating.
The sell signal comes when the band walk breaks down — specifically, when price closes below the 20-SMA after a sustained period of upper-band contact, especially if band width begins to contract again. That sequence is the first warning that the trend is exhausted.
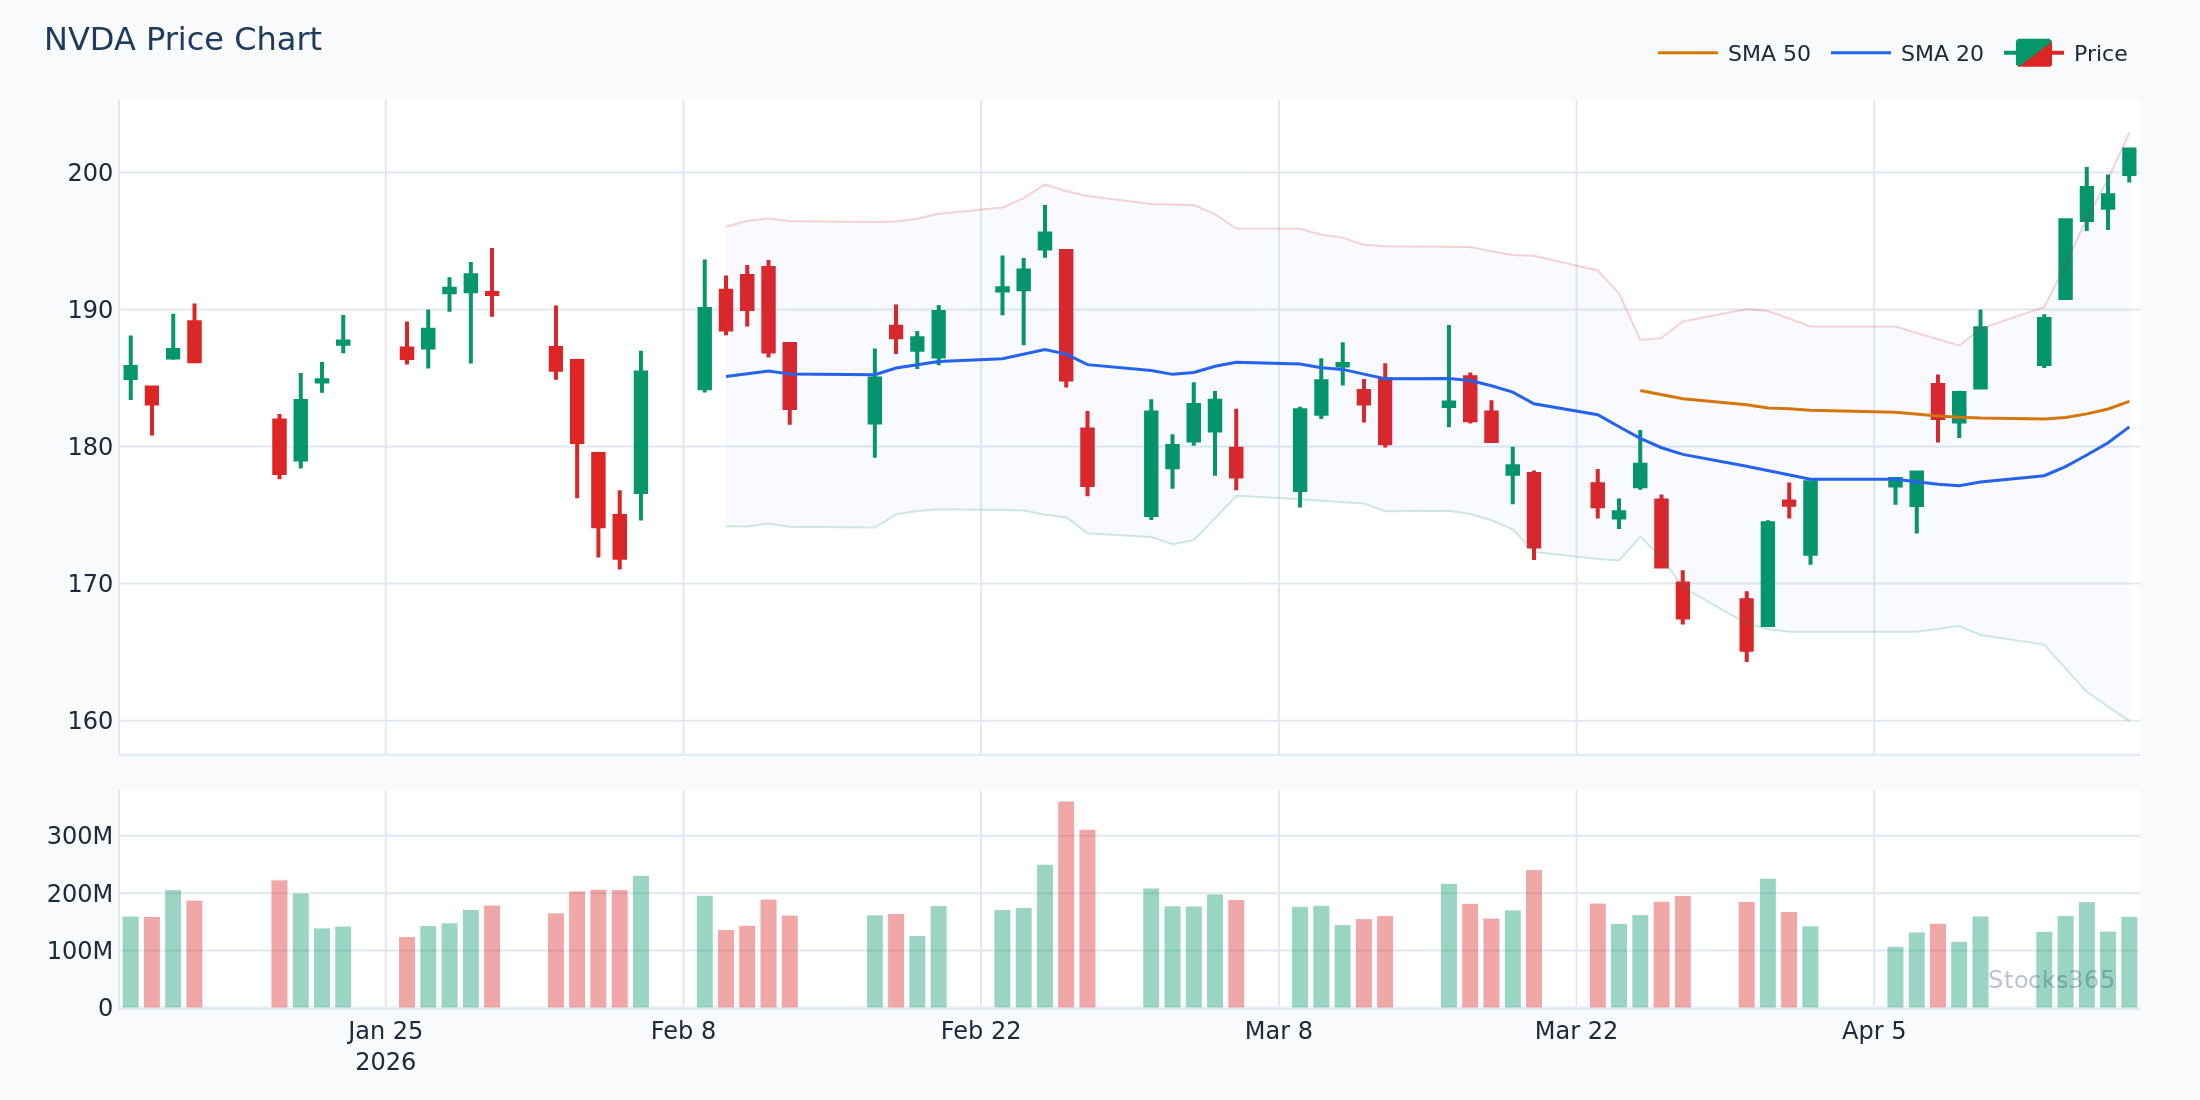
This chart illustrates the band walk in action. Notice how price repeatedly closes at or beyond the upper band while the bands themselves continue to expand — this is textbook trending behaviour. The pattern loses validity when a candle closes below the 20-SMA with volume confirming the break; from there, expect a test of the lower band or a period of sideways consolidation.
Band Walk Entry Rules That Actually Work
Don't chase the initial breakout candle — it's usually overextended. Instead, wait for the first pullback to the 20-SMA during the band walk phase. In a strong uptrend, that pullback is shallow and brief. When price bounces from the 20-SMA back toward the upper band with volume supporting the move, that's your entry.
- Price pulls back to within one ATR of the 20-SMA
- A bullish reversal candle forms at or near the mid-band (hammer, engulfing, or morning star)
- Volume on the reversal candle exceeds the prior pullback candle's volume
- RSI holds above 50 throughout the pullback — a sign the underlying momentum hasn't broken
Pair this with RSI analysis for stronger confirmation. During Bitcoin's 2020 band walk, RSI held above 60 on every significant pullback. When RSI drops below 50 during what you thought was a band-walk pullback, reassess. The trend may be done. For a deeper dive into reading RSI during trends, the guide at RSI Overbought and Oversold Levels covers this in detail.
Phase 3 — Upper Band Touches and the Reversal Setup
Not every upper band touch is a band walk signal. In choppy or range-bound markets, upper band touches are genuinely mean-reverting events. The challenge is knowing which environment you're in before you trade.
During Bitcoin's 2020 run, there were isolated upper band touches that preceded sharp short-term pullbacks — even within the broader uptrend. These created opportunities for short-term traders to fade the extension while longer-term traders used the dip to add to positions.
Stocks365 research across 3,255 Bollinger Upper Band Touch signals found a 49.6% win rate overall (profit factor: 0.88) — but crypto-specific signals outperform meaningfully at 56.7%. The implication is clear: upper band touches in crypto carry more reversal edge than in any other asset class, but only when the broader market context supports a mean-reversion trade. Blindly shorting every upper band tag without context is a losing strategy. Check the full asset-class breakdown at Stocks365 Insights.
How to Filter Upper Band Touch Signals
Before taking a mean-reversion trade at the upper band, run through this checklist:
- Trend context: Is the weekly chart in a clear uptrend? If yes, upper band touches are more likely to result in continuation than reversal.
- RSI reading: RSI above 80 on the same timeframe as the band touch increases reversal probability. RSI between 60–70 suggests the trend still has fuel.
- Volume profile: Rising volume on the upper band touch candle favours continuation. Declining volume favours reversal.
- Band width: If bands are still expanding aggressively, the trend is dominant. Wait for band width to begin contracting before taking a mean-reversion short.
Understanding RSI divergence adds another layer of edge here. When price makes a new high that tags the upper band but RSI makes a lower high, that bearish divergence is a powerful warning signal — even in a bull run. The full breakdown of divergence signals is at RSI Divergence Explained.
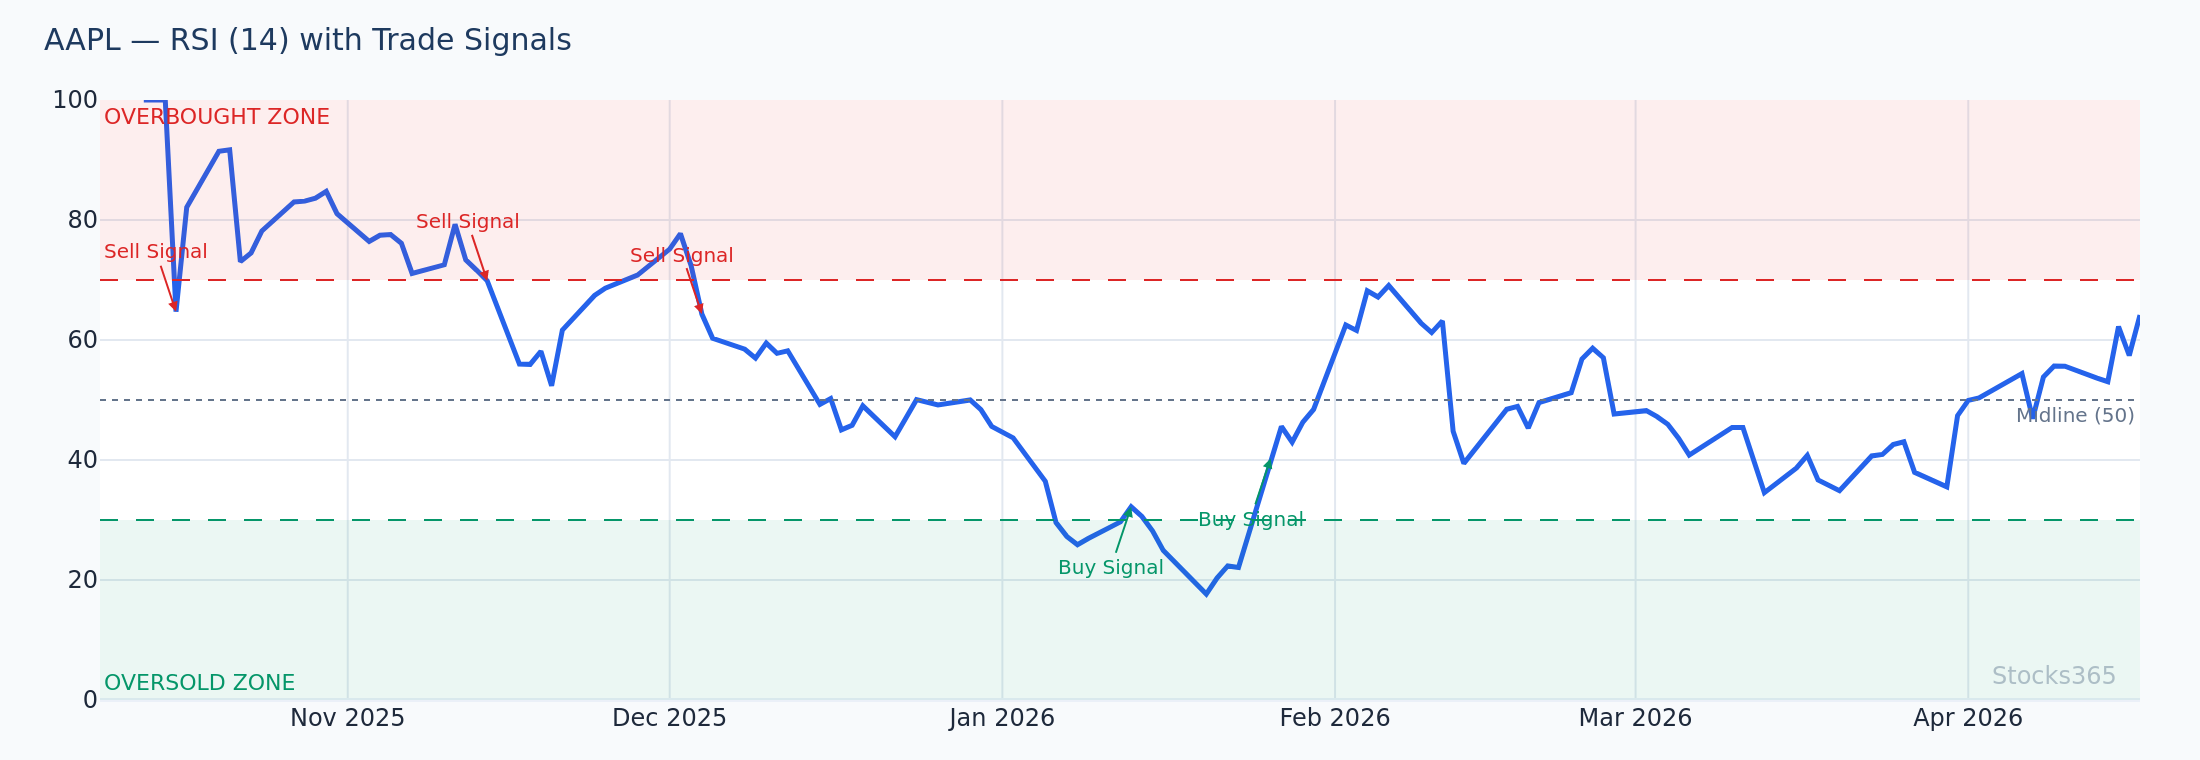
This chart shows the setup where price reaches the upper band but RSI forms a lower high compared to the previous swing — classic bearish divergence. When this appears after a sustained band walk, it signals that momentum is fading even as price extends. The pattern is confirmed if price then closes below the 20-SMA; it's invalidated if RSI breaks above its prior high on the next candle.
The Role of Volume in Every Bollinger Bands Bitcoin Signal
Volume is the missing variable that most Bollinger Bands tutorials ignore. Every major signal in the 2020 Bitcoin case study was confirmed or denied by volume. No exceptions.
Squeeze breakouts with volume expansion are real. Squeeze breakouts on low volume often fake out and reverse. Band walks supported by above-average volume are sustainable. Band walks on declining volume are exhausted. Upper band touches on high volume in a trending market often lead to continuation. Upper band touches on thin volume in a range are your best reversal entries.
Volume doesn't lie. Price can. Always check volume first.
Combining Bollinger Bands with RSI for Bitcoin Trades
Bollinger Bands alone are powerful. Bollinger Bands combined with RSI are significantly more reliable. During the 2020 Bitcoin run, the combination revealed setups that neither indicator showed alone.
The most effective combination during that period was the band squeeze breakout confirmed by RSI crossing above 60 from below. When both conditions aligned — price breaking above the upper band on a squeeze expansion and RSI simultaneously crossing above the 60 threshold — the subsequent moves were consistently strong and directional.
Conversely, when price tagged the upper band but RSI was already above 75 and declining, the reversal signals were clean. That RSI overbought context added high-probability filtering to what would otherwise be a noisy upper-band signal. For the complete guide to RSI settings that work best in these combination strategies, see RSI Settings: Master the Best Period for Your Strategy.
The BB + RSI Pullback Entry (Bitcoin's Core Repeating Pattern)
During the 2020 bull run, Bitcoin produced this exact setup multiple times at different scales:
- Price tags the upper Bollinger Band during a band walk phase
- A brief pullback begins — price retreats toward the 20-SMA
- RSI pulls back but holds above 50 (bullish momentum intact)
- Price bounces from the 20-SMA area with a strong reversal candle
- Volume surges on the reversal candle, confirming buyers are stepping in
- RSI crosses back above 60, confirming momentum resumption
This setup repeated across the daily, weekly, and even 4-hour timeframes throughout the bull run. It's not exclusive to Bitcoin — any trending crypto asset produces this pattern during strong uptrends. The key is not chasing the initial breakout but instead waiting for the pullback to the 20-SMA with RSI confirmation.
This chart shows a mid-trend pullback to the 20-period SMA (middle Bollinger Band) after an upper-band tag. The bounce from the mid-band with a bullish engulfing candle is the entry trigger. The setup is confirmed when the next session closes above the prior candle's high; it's invalidated if price closes below the lower Bollinger Band, suggesting the trend has broken down rather than simply paused.
What to Watch For
- Bollinger squeezes on weekly crypto charts: When weekly band width drops below the 20th percentile of its own 52-week range, a major directional move is imminent. Wait for the breakout candle with volume before committing — the squeeze alone is not a trade.
- Band walk confirmation at the 20-SMA: During an established uptrend, pullbacks that hold the 20-SMA and bounce with volume resumption are the highest-probability long entries. If the 20-SMA fails to hold and price closes below it, the band walk may be over.
- RSI divergence at upper band tags: After five or more consecutive candles riding the upper band, watch for price to make a new high while RSI makes a lower high. That divergence at the upper band is one of the strongest early reversal signals in crypto trading.
- Squeeze breakout direction + volume alignment: A squeeze breakout on 2x average volume in the direction of the prior trend is a strong continuation signal. A breakout on below-average volume, or against the prior trend, has a much higher false-breakout rate.
- Band width re-expansion after consolidation: When band width begins expanding after a period of contraction during an uptrend, and price is already above the 20-SMA, that re-expansion often marks the start of the next impulsive leg — not the end of the move.
Key Takeaways
Bollinger Bands Bitcoin Summary
- The Bollinger squeeze preceded Bitcoin's major 2020 breakout — band width contraction to multi-year lows was the setup, not the trade.
- The band walk phase is where the real money was made — price repeatedly closing at the upper band during expanding bands is a trend-strength signal, not a reversal trigger.
- Upper band touches in crypto carry a 56.7% win rate for mean reversion across 3,255 signals — higher than any other asset class, but context matters.
- RSI confirmation is essential — RSI holding above 50 during pullbacks validates the band walk; RSI dropping below 50 questions it.
- Volume is the confirming factor for every Bollinger Bands signal. Low-volume breakouts and low-volume band walks fail at a significantly higher rate.
- The BB + RSI pullback-to-20-SMA entry is the core repeating pattern across all timeframes during trending crypto markets.
How Stocks365 Uses This
Bollinger Bands in the Stocks365 Trust Score System
Stocks365 integrates Bollinger Band signals as one of 12+ indicators within its proprietary trust score framework. Specifically, Bollinger Band width and band position contribute to the volatility regime component of the trust score — helping the system distinguish between trending and mean-reverting market conditions before other signals are applied.
When Bollinger Band width is expanding and price is above the 20-SMA, the system weights momentum indicators like RSI more heavily in its agreement scoring. When band width is contracting, the system applies greater caution to any directional signal, flagging the increased probability of false breakouts.
Squeeze conditions identified by the bands also contribute to regime scoring — when a squeeze is detected, the trust score system monitors for directional confirmation before elevating signal confidence. This prevents the system from generating high-trust signals into low-volatility consolidations that haven't yet resolved.
You can see these signals in action on the Stocks365 signals dashboard, where trust scores reflect the full multi-indicator context — not just a single Bollinger Band reading in isolation.