
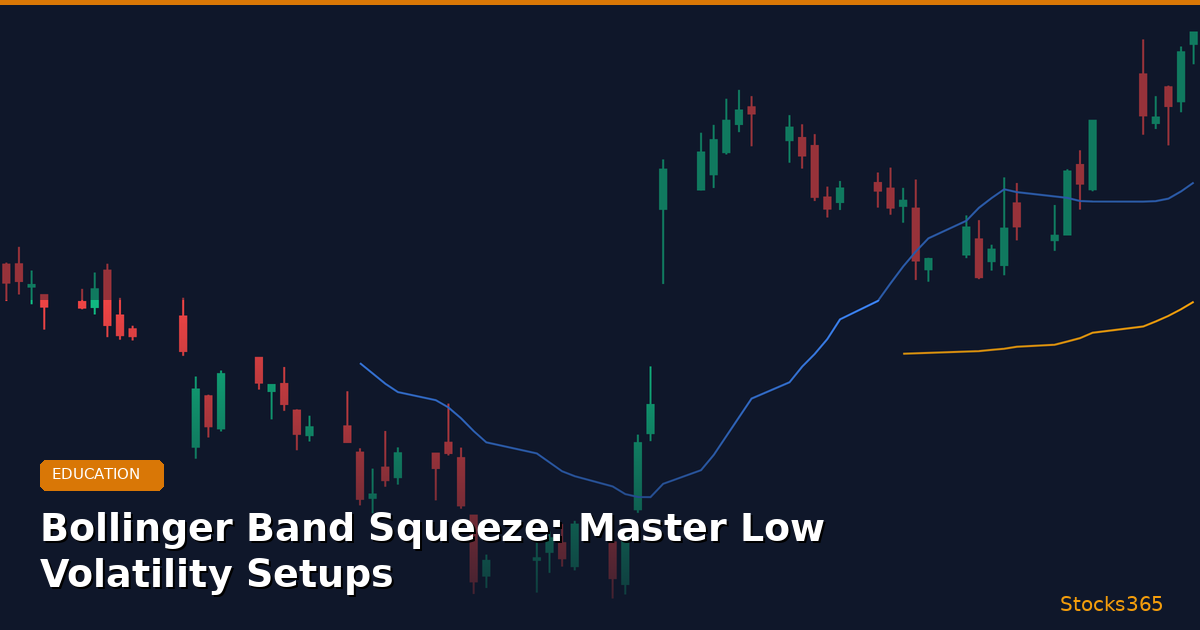
What Is a Bollinger Band Squeeze?
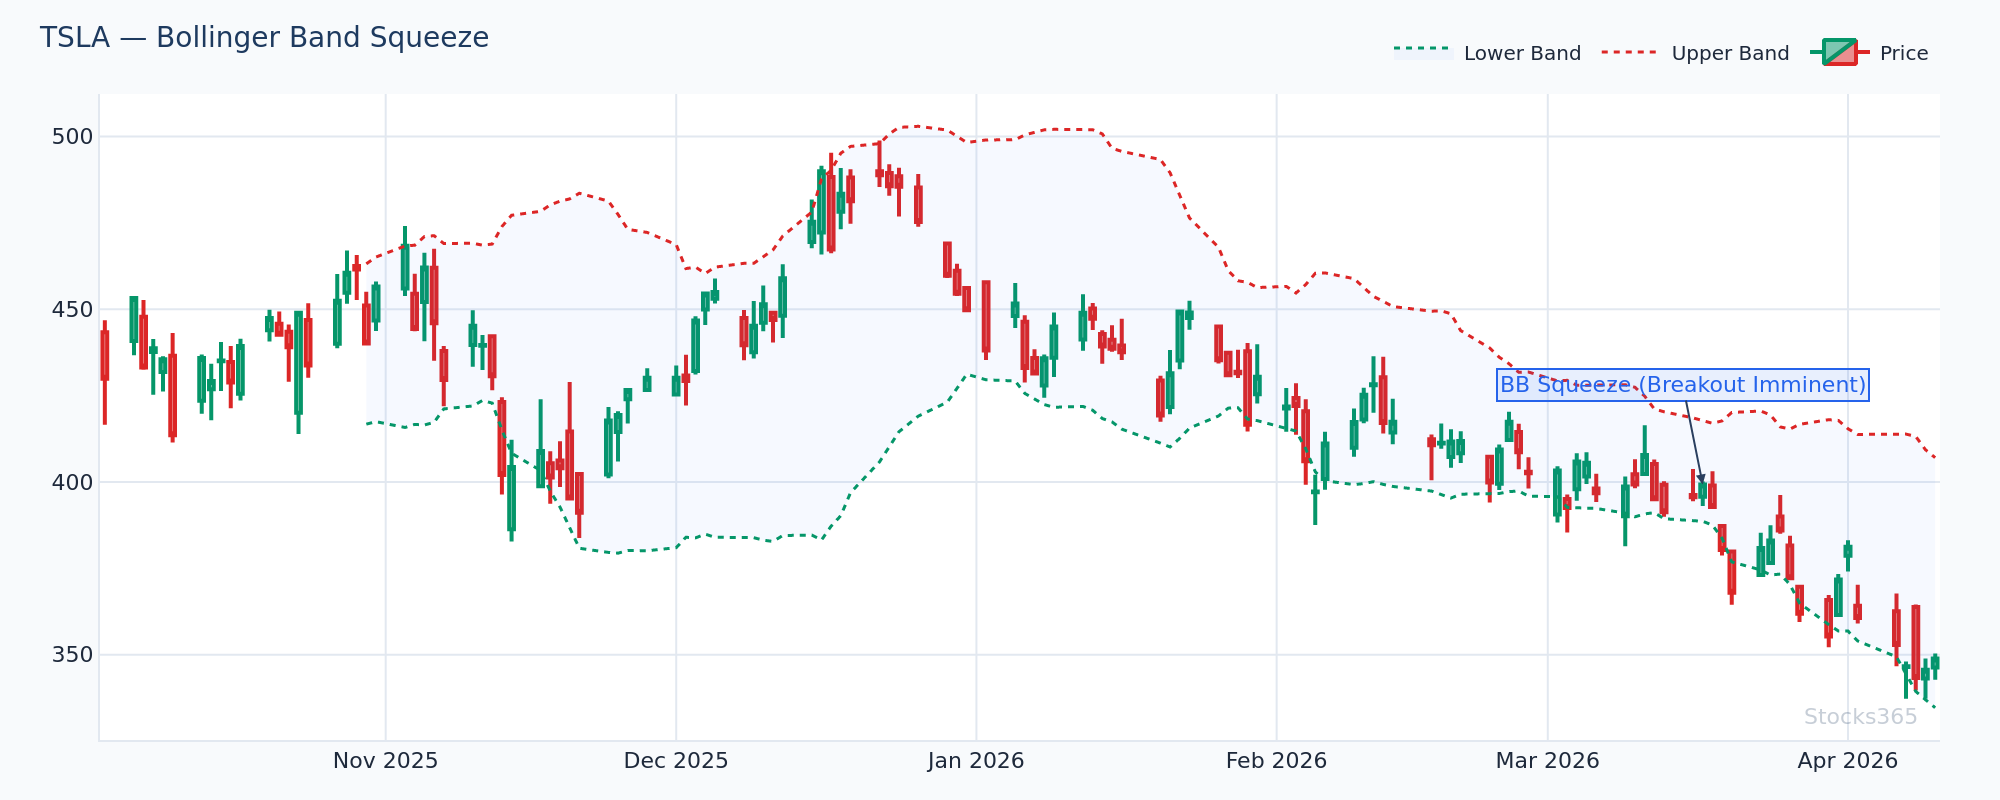
The Bollinger Band squeeze is one of the most powerful and reliable setups in technical analysis. It occurs when the upper and lower Bollinger Bands contract sharply toward the 20-period moving average, signaling a period of unusually low volatility. In trading, low volatility is rarely permanent — it is almost always followed by a violent expansion of price in one direction or the other.
Developed by legendary technician John Bollinger, this concept is rooted in a simple but profound truth about markets: volatility is cyclical. When markets compress, energy builds beneath the surface. Traders who can identify the squeeze before the breakout gain a significant edge over those who react after the move has already begun.
In 2026's fast-moving markets — characterized by algorithmic trading, rapid news cycles, and heightened cross-asset correlations — the Bollinger Band squeeze remains as relevant as ever. Knowing how to identify and trade it correctly can be the difference between catching a 15% move early and chasing it late.
Understanding Bollinger Bands: A Quick Primer
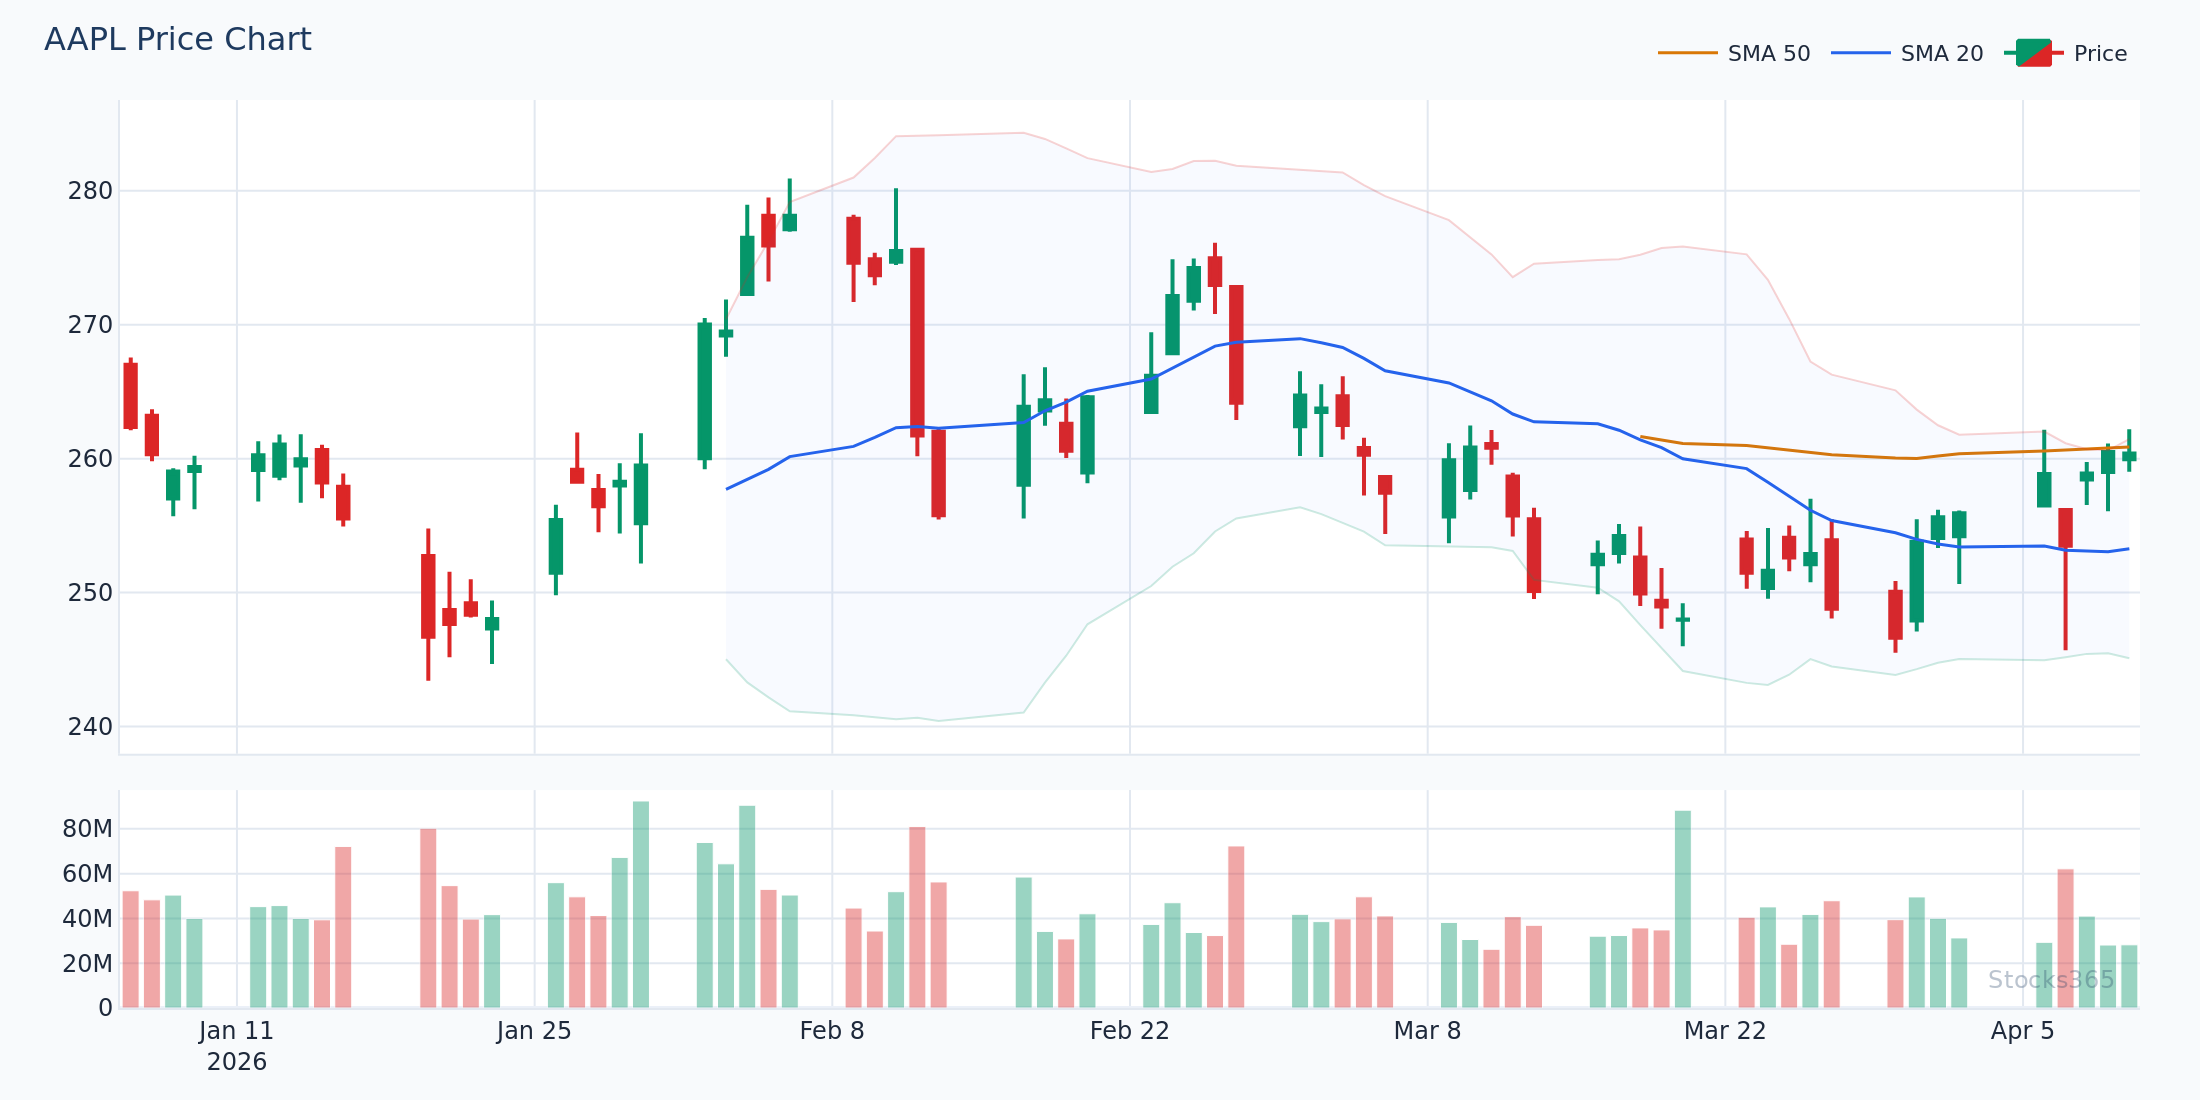
Before diving into squeeze mechanics, it helps to understand what Bollinger Bands actually measure. Each band consists of three lines plotted on a price chart:
- Middle Band: A 20-period simple moving average (SMA) of closing prices
- Upper Band: The 20-SMA plus two standard deviations
- Lower Band: The 20-SMA minus two standard deviations
Standard deviation is the key. It measures how much prices are deviating from the average. When standard deviation is high, the bands widen — reflecting high volatility. When standard deviation is low, the bands narrow — reflecting low volatility. The squeeze is simply a visual representation of standard deviation reaching its lowest point in a defined lookback period.
Most professional traders use the default settings (20-period SMA, 2 standard deviations) as a baseline. However, swing traders working on weekly charts may adjust to 20 periods with 2.5 standard deviations to reduce noise, while scalpers on 5-minute charts may use tighter settings to catch intraday squeezes faster.
How to Identify a Bollinger Band Squeeze
Visual Method: Spotting the Pinch
The most straightforward way to identify a Bollinger Band squeeze is visually. Look for a chart where the upper and lower bands appear to be running nearly parallel — almost like a pair of train tracks — with very little space between them. The wider this channel was previously, the more significant the compression becomes.
Key visual characteristics of a valid squeeze include:
- Bands are visibly closer together than at any recent point in the chart's history
- Price action is choppy and range-bound, respecting the narrowing channel
- Volume is often declining as the squeeze deepens — a sign of indecision
- Candlestick bodies become smaller, with more doji and inside-bar patterns forming
The Bandwidth Indicator: Quantifying the Squeeze
For traders who prefer a data-driven approach, John Bollinger created the Bandwidth indicator, which quantifies exactly how tight the bands are relative to recent history. The formula is simple:
Bandwidth = (Upper Band − Lower Band) / Middle Band × 100
When Bandwidth reaches its lowest reading in the past 125 trading days (approximately 6 months), this is often called the Squeeze Signal. Many professional platforms, including the Stocks365 signals dashboard, flag these compression events automatically so traders never miss a developing setup.
The Bollinger Band Squeeze Indicator (TTM Squeeze)
Another popular quantification tool is the TTM Squeeze, developed by John Carter. It overlays Bollinger Bands with Keltner Channels — when the Bollinger Bands move inside the Keltner Channels, a squeeze is confirmed with a dot on the histogram. When the Bollinger Bands expand outside the Keltner Channels, the squeeze fires, and momentum determines direction. This dual-channel approach reduces false signals considerably and is widely used by active traders in 2026.
Why Squeezes Happen: The Market Psychology Behind the Setup
Understanding why squeezes occur makes you a better trader than simply knowing what they look like. Squeezes typically develop in three scenarios:
- Pre-earnings consolidation: A stock trades in a tight range as market participants wait for earnings results. The uncertainty suppresses volatility until the report drops, triggering a directional explosion.
- News vacuum periods: When a stock or sector is temporarily out of the news cycle, institutional activity slows, range tightens, and a squeeze develops. Any catalyst — analyst upgrade, sector rotation, macro event — can ignite the breakout.
- Post-trend consolidation: After a significant trending move, prices often pause to consolidate gains or losses. The squeeze marks the exhaustion of the corrective phase before the next leg begins.
In each case, the psychological story is the same: bulls and bears are in a standoff, and neither side has enough conviction to drive price strongly in either direction. The squeeze is the market holding its breath. The breakout is the exhale.
How to Trade the Bollinger Band Squeeze: Step-by-Step
Step 1 — Confirm the Squeeze Is Valid
Not every narrow band reading deserves your attention. A valid squeeze should meet at least two of these criteria:
- Bandwidth is at or near a 6-month low
- Price has been range-bound for at least 5–10 candles on your chosen timeframe
- Volume has been declining during the consolidation
- The setup aligns with a higher-timeframe trend (weekly chart is bullish while daily squeeze develops)
Step 2 — Determine Directional Bias Before the Breakout
This is where most traders fail. They see the squeeze, enter randomly, and get stopped out when price breaks in the opposite direction. The key is to develop a directional bias before the breakout using complementary indicators.
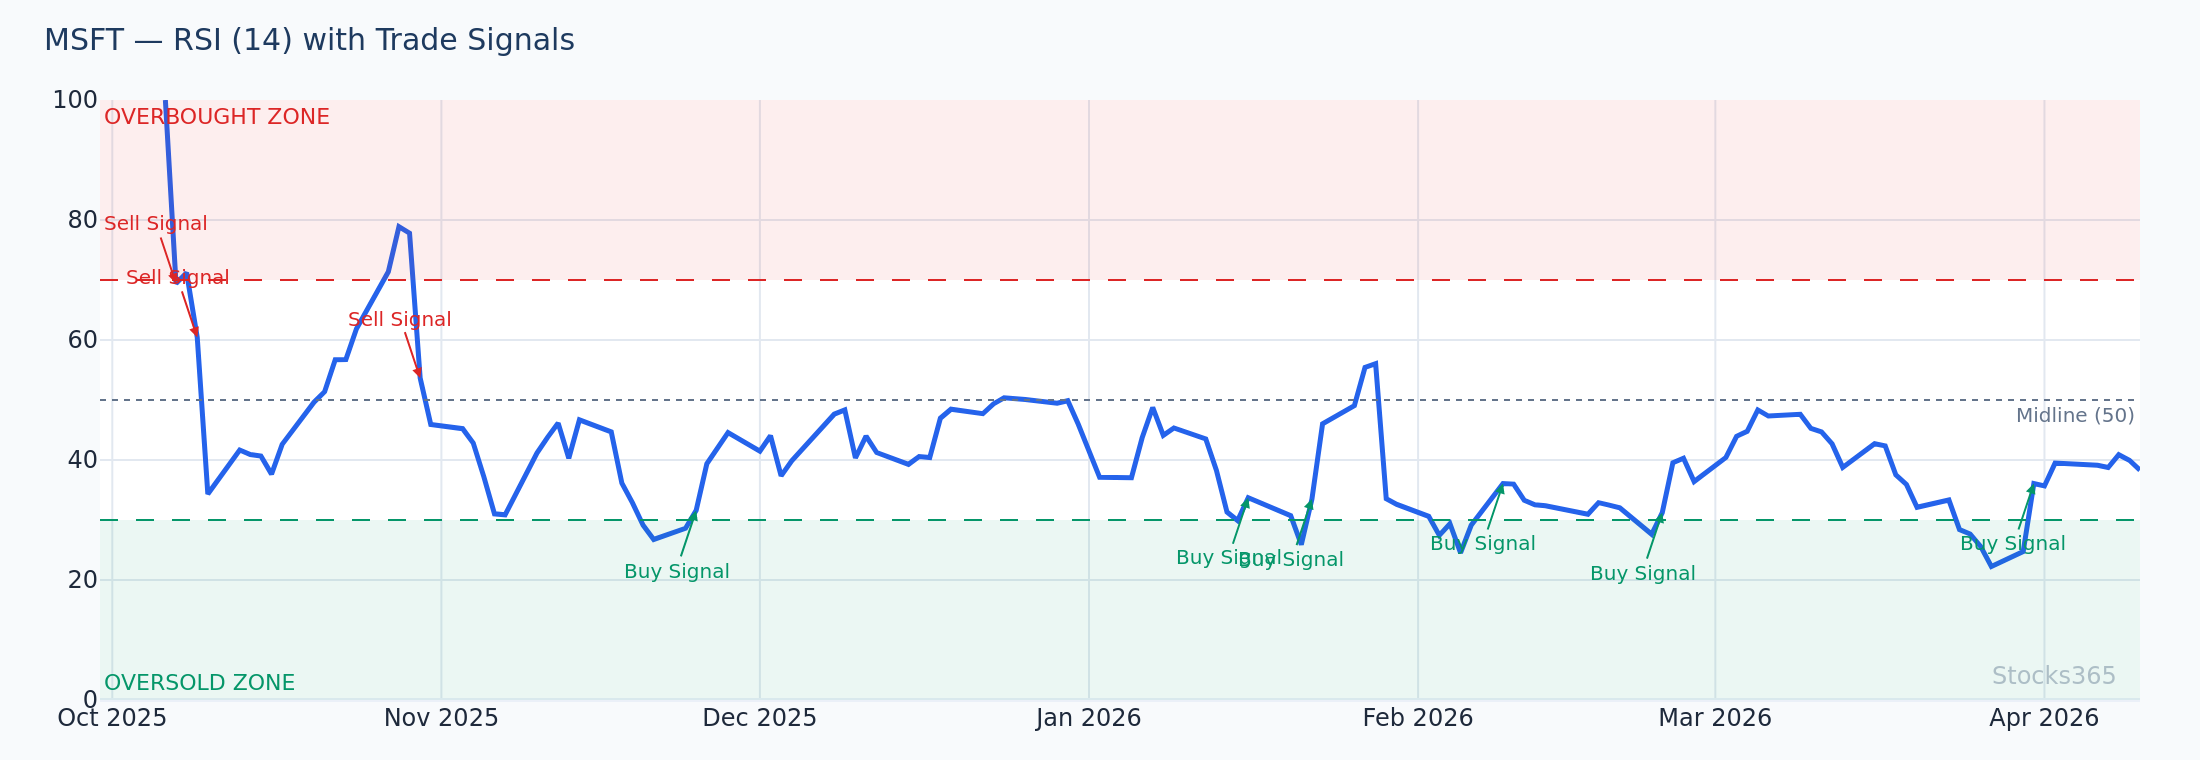
Momentum indicators are your best friends here. If the squeeze is developing and momentum is already showing bullish divergence or rising from oversold territory, the probability of an upside breakout increases substantially. Consider pairing your squeeze analysis with RSI — for a deep dive, check out our guide on How to Use RSI in Trading: The Ultimate Step-by-Step Guide.
Other confluence factors to consider:
- Higher-timeframe trend: A squeeze in the direction of a weekly uptrend has far higher odds of resolving bullishly
- RSI positioning: RSI holding above 50 during the squeeze suggests underlying bullish pressure. Learn more about interpreting these levels in our article on RSI Overbought and Oversold Levels: Master the Signals
- Price structure: Higher lows forming within the squeeze zone signal accumulation and a bullish resolution
- Sector strength: Is the broader sector in a strong uptrend? Stocks moving with sector tailwinds have higher breakout success rates
Step 3 — Enter on the Breakout Candle
There are two primary entry approaches for the Bollinger Band squeeze breakout:
Aggressive Entry: Enter as price closes beyond the upper or lower band for the first time after the squeeze. This gets you in early but carries more risk of a false breakout.
Conservative Entry: Wait for price to close beyond the band, pull back to retest the band or the middle SMA, and then enter on the retest candle. This entry has a better risk-reward profile but means you may miss fast movers that don't pull back.
For most traders, the conservative entry on the retest is preferable, especially in choppy macro environments where false breakouts are more common.
Step 4 — Set Your Stop Loss
Stop placement is critical in squeeze trading. Two logical stop locations:
- Below the opposite band: For a bullish breakout, place your stop below the lower Bollinger Band at the time of breakout. This defines the full range of the squeeze as your maximum risk.
- Below the middle band (20 SMA): A tighter stop for traders who want to risk less capital, accepting that a deeper pullback would invalidate the breakout.
Step 5 — Define Your Target
Bollinger Bands naturally help define targets. After a squeeze breakout, price will often travel the full width of what the bands were at their widest point prior to the squeeze. This is called the band expansion target. Additionally, measure the height of the squeeze range and project it from the breakout point for a technical price target.
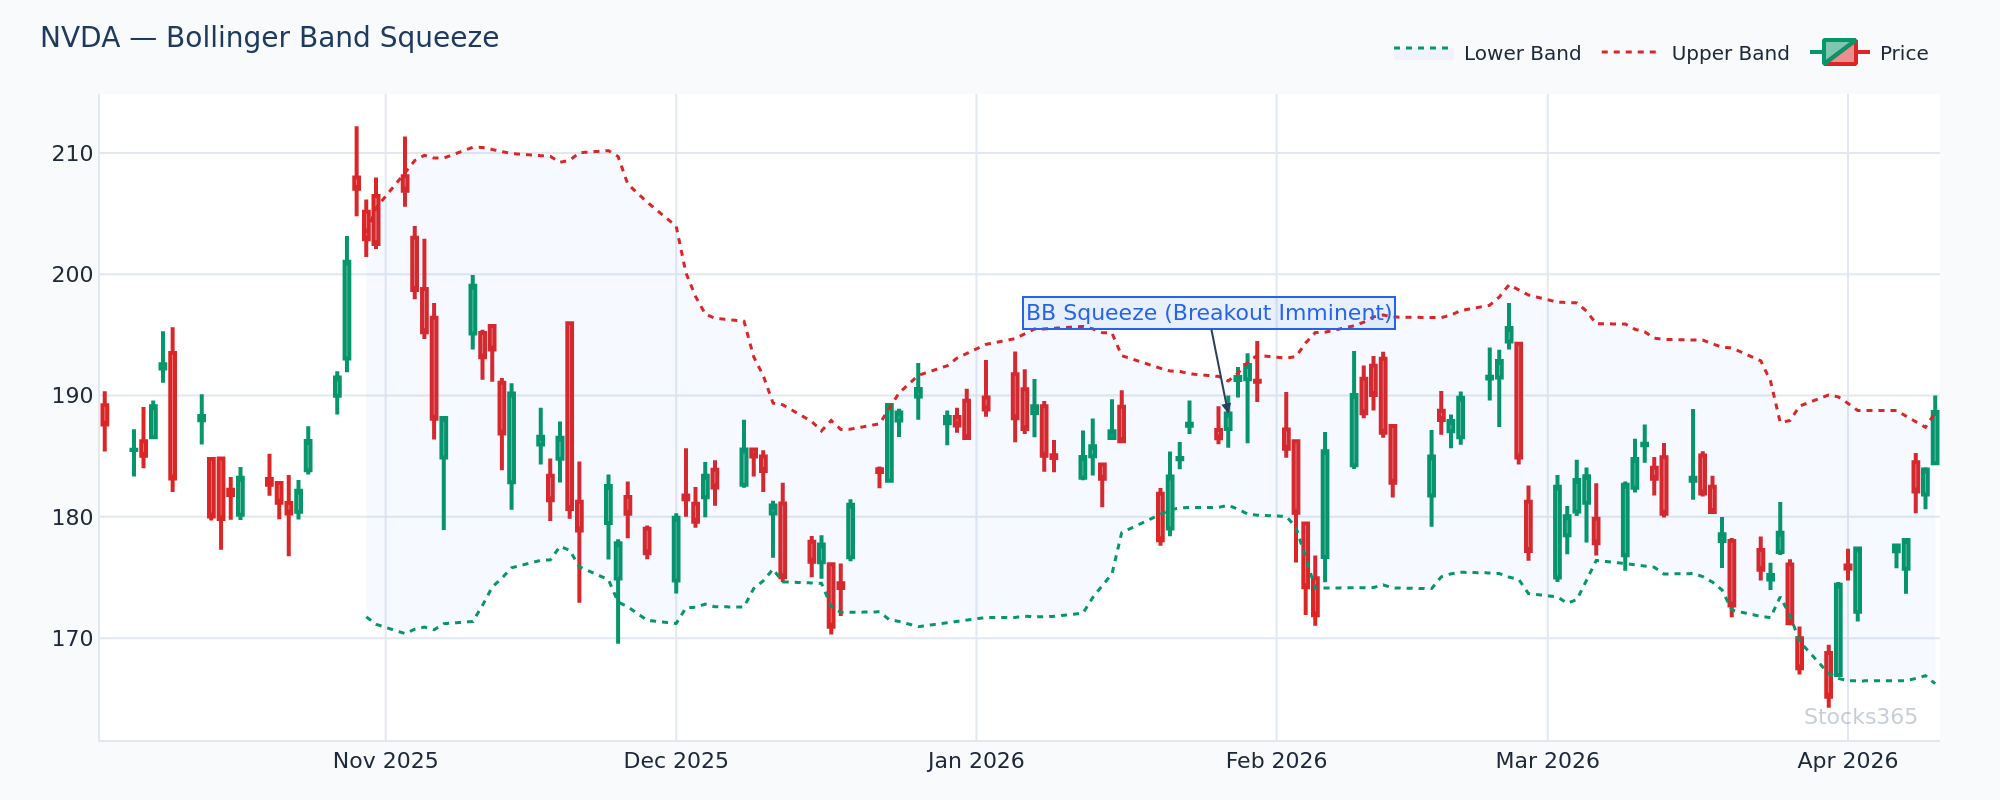
Practical Trading Example: NVDA Squeeze Setup
Let's walk through a real-world style example to illustrate how this plays out in practice. Imagine NVDA has been trading in a tight range between $142 and $148 for three weeks following a strong earnings-driven rally. The Bollinger Bands have compressed dramatically — Bandwidth has fallen to its lowest reading in five months.
During this consolidation, RSI has been holding between 52 and 58, suggesting neither overbought nor oversold conditions but with a slight bullish tilt — price is consolidating above the midline. The weekly chart shows NVDA remains in a strong uptrend. Volume has been decreasing each week during the range.
These conditions create a high-probability squeeze setup with a bullish bias. A trader would:
- Wait for NVDA to close above $148 (the top of the squeeze range and upper Bollinger Band)
- Enter on the breakout candle close at $149.50, or on a retest of the $148 level if it pulls back
- Set a stop loss at $141.50 — just below the lower band at the time of breakout
- Target $162 — the band expansion target based on the prior band width of roughly $14
The risk on this trade is approximately $8 per share, with a potential reward of $12.50 — a risk-reward ratio of better than 1.5:1. If the breakout is strong and sector conditions are favorable, traders may scale out half the position at the first target and trail the stop for the remainder. You can track live setups like this on the Stocks365 signal pages for major tickers.
Combining the Squeeze With Other Indicators for Higher-Probability Setups
Bollinger Band Squeeze + RSI Divergence
One of the most powerful combinations in technical trading is pairing the squeeze with RSI divergence. When price is making lower lows within the squeeze zone while RSI is making higher lows, this bullish divergence strongly suggests accumulation is occurring beneath the surface — and that the eventual breakout will likely be to the upside. For a comprehensive guide on this technique, read our article on RSI Divergence Explained: Master Bullish & Bearish Signals.
Bollinger Band Squeeze + Volume Analysis
Pay close attention to volume as the squeeze resolves. A valid breakout should ideally be accompanied by a surge in volume — at least 1.5 times the average daily volume. A breakout on low volume is suspect and may be a false move designed to trap breakout traders before price reverses.
Bollinger Band Squeeze + Moving Average Crossovers
When a squeeze breakout is accompanied by a short-term moving average crossing above a longer-term moving average (such as the 9 EMA crossing the 21 EMA), this adds another layer of confirmation that momentum is genuinely shifting in the breakout direction.
Bollinger Band Squeeze + Stochastic Oscillator
For traders who prefer multiple oscillator confirmation, using the Stochastic alongside RSI during a squeeze can help identify when both short-term and medium-term momentum are aligned with the anticipated breakout direction. Our comprehensive comparison of RSI vs Stochastic Oscillator: The Essential Guide explains when each is most effective.
Common Mistakes Traders Make With Bollinger Band Squeezes
Even experienced traders fall into predictable traps with squeeze setups. Here are the most costly mistakes to avoid:
- Trading the squeeze before the breakout: Entering simply because bands are tight — without waiting for directional confirmation — leads to repeated stopped-out trades as price chops within the range.
- Ignoring the higher timeframe: A bearish weekly trend can easily overwhelm a bullish daily squeeze signal. Always check the higher timeframe context before committing capital.
- Oversizing positions: Squeezes can take time to resolve. If you enter too large and price continues to compress for another two weeks, the psychological pressure can force premature exits before the real move begins.
- Chasing false breakouts: Price often pokes above or below the bands momentarily during a squeeze without a genuine directional commitment. Waiting for a full candle close beyond the band — rather than an intrabar poke — dramatically reduces false breakout trades.
- Neglecting market conditions: During highly uncertain macro environments (Federal Reserve meeting weeks, major geopolitical events), even high-quality squeeze setups can fail because market-wide risk-off sentiment overwhelms individual stock technicals.
The Stocks365 signals dashboard uses a proprietary trust score system that weighs these macro and technical factors together, giving each squeeze setup a confidence rating that helps traders avoid low-quality setups in difficult market conditions.
Bollinger Band Squeeze Across Different Timeframes
The squeeze works on virtually every timeframe, but the implications differ significantly:
- Weekly charts: Squeezes on weekly charts are rare and extremely significant. When they fire, the resulting moves can last weeks to months and generate 20–40% price moves in individual stocks.
- Daily charts: The most commonly traded timeframe for swing traders. Squeezes typically resolve within 5–15 trading days and can generate moves of 5–15%.
- 4-hour and 1-hour charts: Popular with active traders and short-term swing traders. Moves tend to last 1–5 days and are more susceptible to false breakouts.
- 15-minute and 5-minute charts: Used by intraday traders. Squeezes can resolve within hours, and tight stop placement is critical given the noise at this timeframe.
The most reliable squeezes occur when multiple timeframes align — a weekly squeeze resolving in the same direction as a daily squeeze, for example, creates a powerful confluence that institutional traders also recognize and participate in.
Pro Tip: The most explosive moves come from squeezes that have been building for the longest time on the highest timeframes. A monthly chart squeeze that resolves is a generational trading opportunity. They are rare — but when they appear, they deserve your full attention.
Key Takeaways
- The Bollinger Band squeeze occurs when bands contract to their tightest point in recent history, signaling a period of extreme low volatility that typically precedes a powerful directional move
- Use the Bandwidth indicator or TTM Squeeze to quantify compression and receive objective squeeze signals
- Develop a directional bias before the breakout using RSI, volume analysis, price structure, and higher-timeframe trend alignment
- Enter on confirmed breakout candle closes — not intrabar pokes — and consider the retest entry for better risk-reward ratios
- Place stops below the opposite band and target the projected band expansion width from the breakout point
- Combine the squeeze with RSI divergence, volume surges, and MA crossovers to dramatically improve breakout probability
- Avoid the most common mistake of entering before the breakout fires — patience is the squeeze trader's greatest edge
- Multiple timeframe alignment creates the highest-probability squeeze setups available in technical trading