
Bollinger Bands vs Price Envelopes: The Channel Tool Showdown
Two tools. One goal: define where price is "too high" or "too low" relative to recent history. Bollinger Bands and price envelopes both draw channels around price — but they do it in fundamentally different ways, and those differences matter enormously in live trading.
Stocks365 backtested 14,266 Bollinger Squeeze Breakout signals across equities, crypto, forex, and commodities — and found a profit factor of 1.03 with meaningful variation by asset class. That single stat tells you something important: the tool works, but only when you understand where and how to deploy it. The same logic applies when choosing between Bollinger Bands and price envelopes.
This guide breaks down the mechanics, the strengths, the failure modes, and exactly which setup favors which tool.
The Core Difference: Dynamic vs. Fixed Width
Here's the key distinction most traders gloss over.
Bollinger Bands use a moving average as the centerline, then plot upper and lower bands at a set number of standard deviations away from that average. Typically 2 standard deviations above and below a 20-period simple moving average. The bands breathe — they expand when volatility rises and contract when it falls. The width is never fixed; it's always a function of recent price behavior.
Price envelopes (also called moving average envelopes) use a moving average as the centerline too — but the upper and lower bands sit at a fixed percentage above and below that average. You set 2.5%, the bands stay 2.5% away, regardless of whether the market is grinding sideways or exploding on earnings.
That one difference — dynamic standard deviation vs. fixed percentage — cascades into very different behavior across market conditions.
To understand the math behind Bollinger Bands more deeply, read our full breakdown of how Bollinger Bands work and the math behind them.
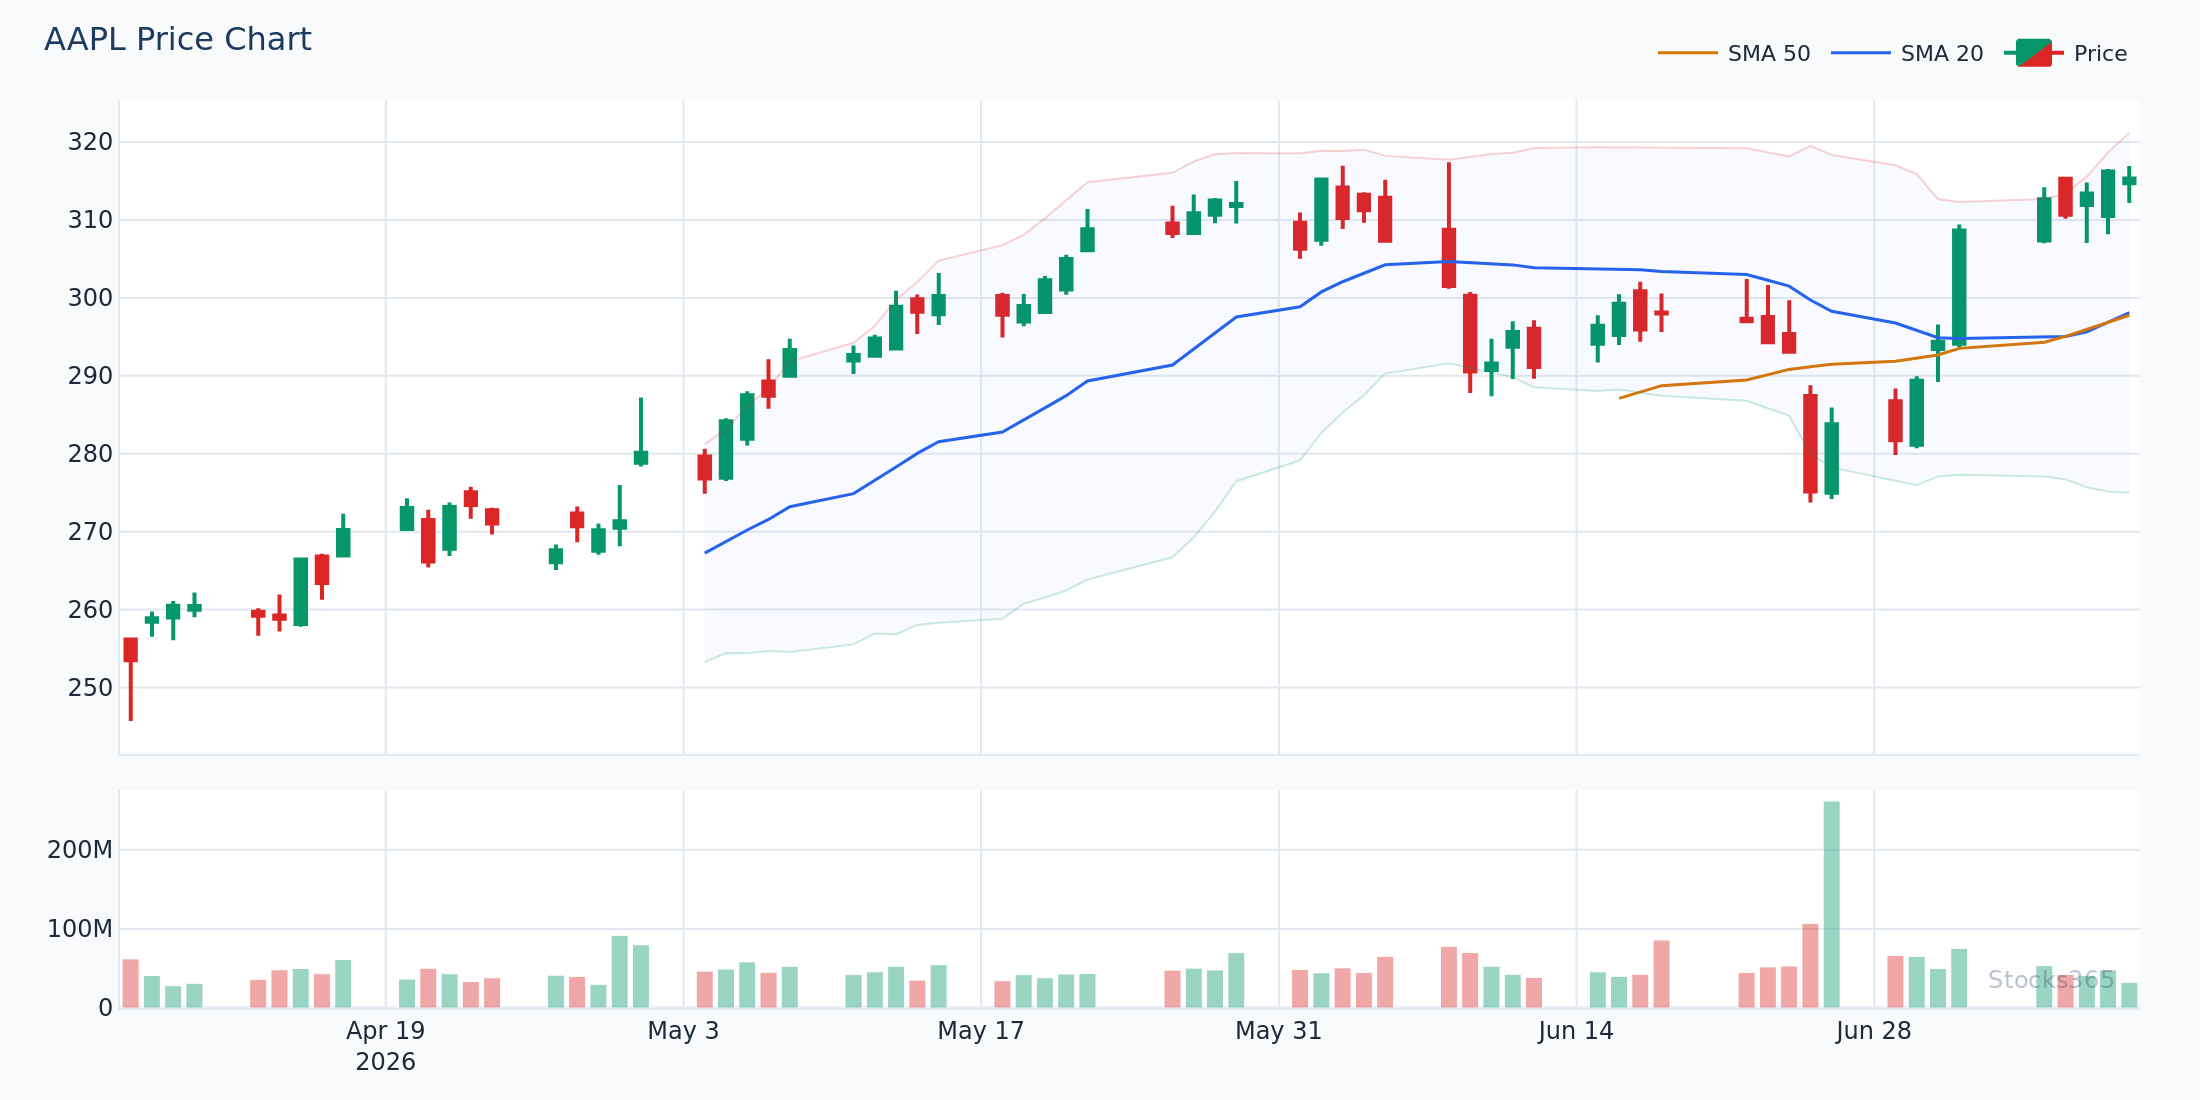
This chart illustrates exactly why the dynamic vs. fixed distinction matters. During the low-volatility consolidation phase, the Bollinger Bands compress toward the centerline while the envelope bands stay rigidly parallel — a divergence that creates completely different trade signals from the same price action. When price eventually breaks out of the BB squeeze, it immediately breaches the upper Bollinger Band but may still sit comfortably inside the envelope, giving a false sense of calm to envelope traders. What confirms the move: a surge in volume above the 20-period average combined with a close above the upper band on expanding width.
How Price Envelopes Work in Practice
The Mechanics of Fixed-Percentage Channels
Price envelopes are simple. Choose a moving average — 20-day SMA is common — then apply a fixed offset. A 2% envelope on a 20-SMA means the upper band is always 2% above the moving average and the lower band is always 2% below it. Clean. Predictable. Easy to parameterize.
The percentage you choose matters a lot. A 1% envelope on a volatile growth stock is almost meaningless — price tags the bands constantly with no signal value. A 5% envelope on a low-beta utility might trigger so rarely the tool is useless. Envelope traders spend considerable time calibrating their percentage to match the instrument's typical volatility profile.
This is also the envelope's core weakness: you're essentially hardcoding volatility into your setup. When volatility regimes shift — and they always do — your envelope becomes miscalibrated. What worked as a mean-reversion trigger in a calm market gives false signals in a trending, high-volatility environment.
Where Envelopes Have an Edge
Envelopes aren't without merit. In one specific scenario, they outperform Bollinger Bands: stable, low-volatility instruments with consistent historical volatility profiles. Think blue-chip dividend stocks, certain ETFs, or instruments where volatility doesn't swing dramatically. When you know an instrument oscillates within a predictable historical range, a fixed envelope becomes a reliable reversion tool.
Envelopes are also more intuitive for newer traders and easier to explain in systematic strategies. "Price hit 3% above its 50-day average" is a concrete, reproducible trigger. No standard deviation math required.
How Bollinger Bands Work in Practice
The Adaptive Advantage
Bollinger Bands adapt. When markets go quiet — when daily ranges compress and volume dries up — the bands contract. When volatility explodes, the bands expand to match. This is not a small advantage. It's the entire reason Bollinger Bands became one of the most widely used technical indicators in professional trading.
The squeeze is the most powerful setup Bollinger Bands generate. When band width compresses to historically low levels, it signals that volatility is coiling. The market is building energy. That compression almost always precedes a significant directional move — the bands don't tell you which direction, but they tell you something is coming. Combine that signal with a directional catalyst — a breakout above the upper band on rising volume, a momentum confirmation from a secondary indicator — and you have a high-conviction entry framework.
For crypto traders specifically, Bollinger Bands have shown consistent alpha. Our full guide on Bollinger Bands for crypto trading covers the specific setups that work best on Bitcoin and high-cap altcoins.
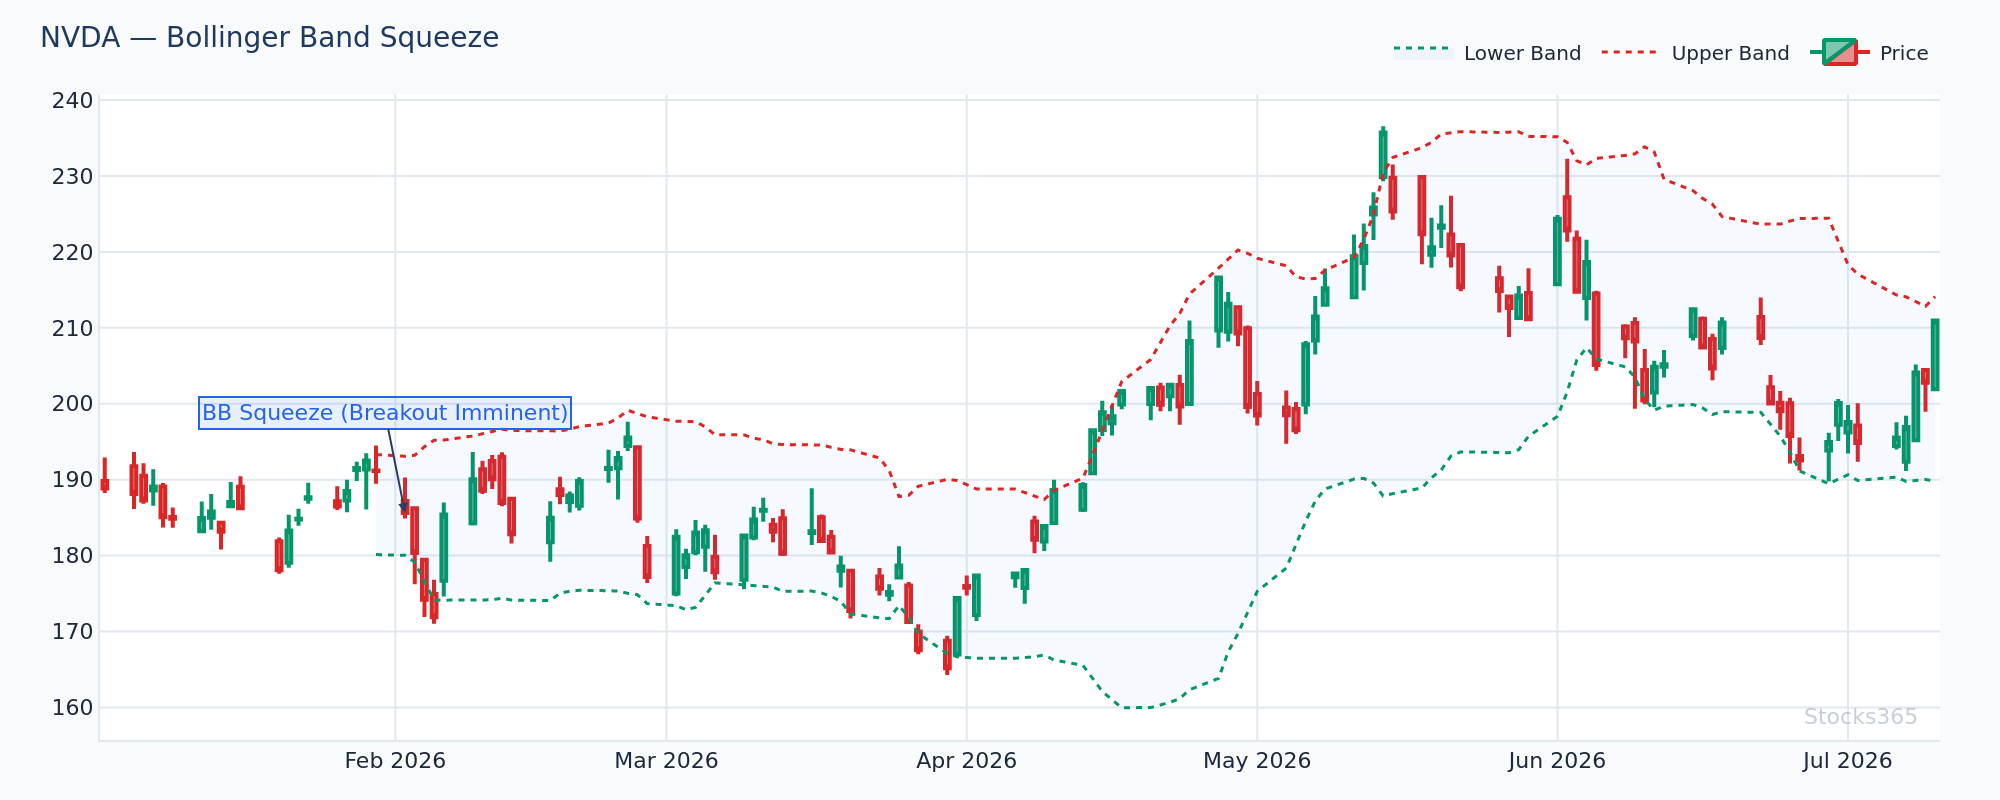
This squeeze setup on NVDA shows band width compressing to its lowest level in several months — the textbook coiling pattern that precedes large directional moves. Price is trapped in a tight range just above the 20-SMA centerline. What typically follows: a decisive break above the upper band (bullish scenario) or a break below the lower band (bearish scenario) with a surge in volume confirming direction. The pattern is invalidated if price continues to chop sideways without any band expansion — that signals the squeeze is being resolved through time rather than price movement, weakening the eventual breakout's follow-through.
The Upper Band Touch — What the Data Says
Here's a setup many traders misread. The Bollinger upper band touch — price reaching or briefly exceeding the upper band — is often treated as an automatic short signal. Mean reversion thinking: price went "too far," so it must come back.
Our analysis of 3,255 Bollinger Upper Band Touch signals found a 49.6% win rate over a 10-day holding period (profit factor: 0.88). That's slightly below breakeven as a standalone reversal signal. The best asset class? Crypto at 56.7%. The worst? Commodities at 41.5%. The raw upper band touch, used alone as a fade, is not an edge — it's a coin flip that skews negative.
The lesson: Bollinger Band touches need confirmation. They identify a condition, not a signal. That's a critical distinction.
Here's What Most Traders Get Wrong
Most traders treat price touching the upper Bollinger Band as a sell signal. In trending markets, price rides the upper band for extended periods — sometimes weeks. Repeatedly fading the upper band in a strong uptrend is one of the most common ways traders blow up mean-reversion strategies. The real signal isn't the touch. It's when price fails to maintain contact with the upper band and rolls back through the 20-SMA centerline on increasing volume. That failure is the reversal signal — not the initial touch.
The same mistake happens with price envelopes. Traders set up an envelope, watch price tag the upper band, short immediately — and get steamrolled by a trend that keeps extending beyond their fixed percentage threshold. Fixed channels don't care about momentum.
Direct Comparison: When Each Tool Wins
Trending Markets
Bollinger Bands win here. In a strong trend, the bands expand to accommodate price movement and the outer band becomes a dynamic support/resistance level that moves with the trend. Price "walking" the upper band in an uptrend is a bullish signal within the Bollinger framework — it means momentum is strong enough to continuously justify statistically elevated prices.
Envelopes struggle in trends. A stock that gaps up 15% on earnings immediately breaks the fixed envelope — but that doesn't mean it's overbought. It might just be repricing to a new level. The fixed channel has no mechanism to account for sudden regime changes.
Range-Bound Markets
This is where envelopes become more competitive. In a stable, range-bound instrument with consistent volatility, the fixed envelope defines the trading range cleanly. The calibration effort pays off when the market cooperates by staying within that regime.
Bollinger Bands still work in ranging markets, but the signals are less distinctive. When volatility is consistently low and price oscillates predictably, both tools perform similarly — and envelope users avoid the complexity of standard deviation math.
Volatile, Event-Driven Markets
Bollinger Bands are clearly superior. When earnings, macro data, or geopolitical events spike volatility, the adaptive nature of standard deviation-based bands immediately reflects the new reality. The bands expand, recalibrate, and continue generating relevant signals. An envelope that was calibrated to normal volatility becomes instantly obsolete — bands that made sense last week now sit at levels that never get tagged because price is moving in a completely different magnitude.
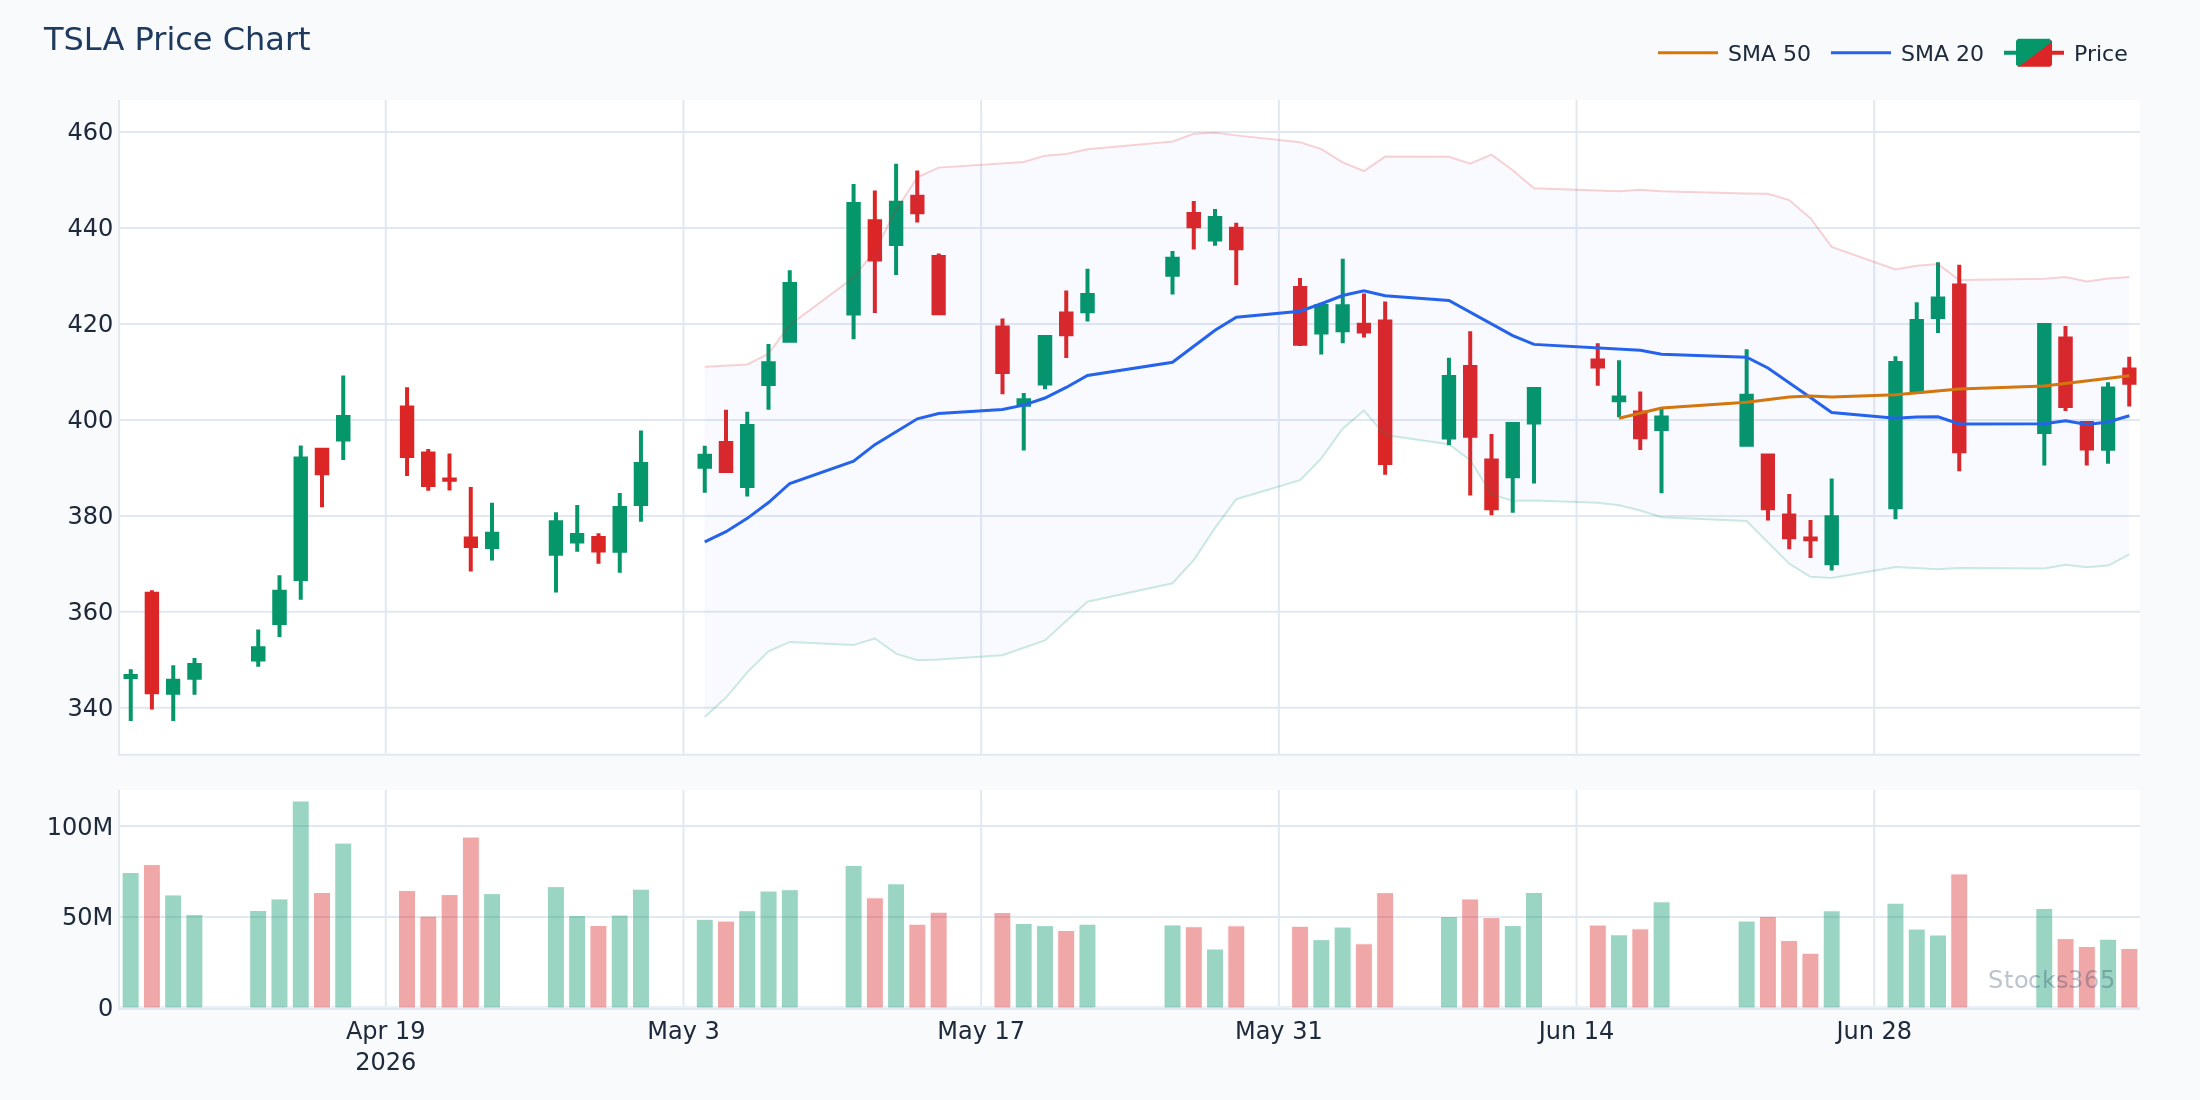
TSLA's high-volatility periods are a perfect stress test for both channel tools. Here, the Bollinger Bands widen dramatically to accommodate the new volatility regime — upper and lower bands adjust in real time, keeping the 2-standard-deviation threshold statistically meaningful. A fixed 3% envelope (shown as reference) becomes nearly useless: price slices through the upper band with no reversal, because 3% is no longer a statistically significant move in this environment. The pattern to watch: when BB width begins to contract again after a high-volatility expansion, that's the signal that a new squeeze is forming and the next directional move is building.
Combining Channel Tools With Other Indicators
Bollinger Bands + Momentum Oscillators
Channel tools define where price is relative to its recent range. They say nothing about momentum direction. Adding an oscillator creates a complete picture.
Pairing Bollinger Bands with RSI is a proven combination. When price tags the lower Bollinger Band and RSI drops below 30, you have a double confirmation of oversold conditions — from both a volatility and momentum perspective. Our complete RSI trading guide for 2026 covers exactly how to structure these confluence setups.
The Stochastic Oscillator is another common pairing. When Bollinger Bands signal a potential reversal and Stochastic confirms momentum exhaustion, the combined signal has historically shown better accuracy than either tool alone. Though as our backtested data shows, even the BB + Stochastic double overbought combination across 3,026 signals produced only a 49.9% win rate at the 10-day mark (profit factor: 0.91) — with crypto performing best at 58.0% and commodities worst at 40.7%. Asset class selection matters more than indicator selection. For a full comparison of momentum tools, see our MACD vs Stochastic breakdown.
Channel Tools + Moving Average Crossovers
The moving average that forms the Bollinger Band centerline (typically the 20-SMA) can itself serve as a signal line. When price breaks above the 20-SMA centerline after bouncing from the lower band, that's a directional trigger within the channel framework. Adding a second moving average crossover — say, the 20-SMA crossing above the 50-SMA — provides trend confirmation at a higher timeframe. Our complete moving average crossover guide covers how to build that layered approach.
Volume matters too. No channel signal — Bollinger or envelope — carries much weight without volume confirmation. A breakout above the upper band on below-average volume is suspect. The same breakout on 2x average volume is a conviction move.
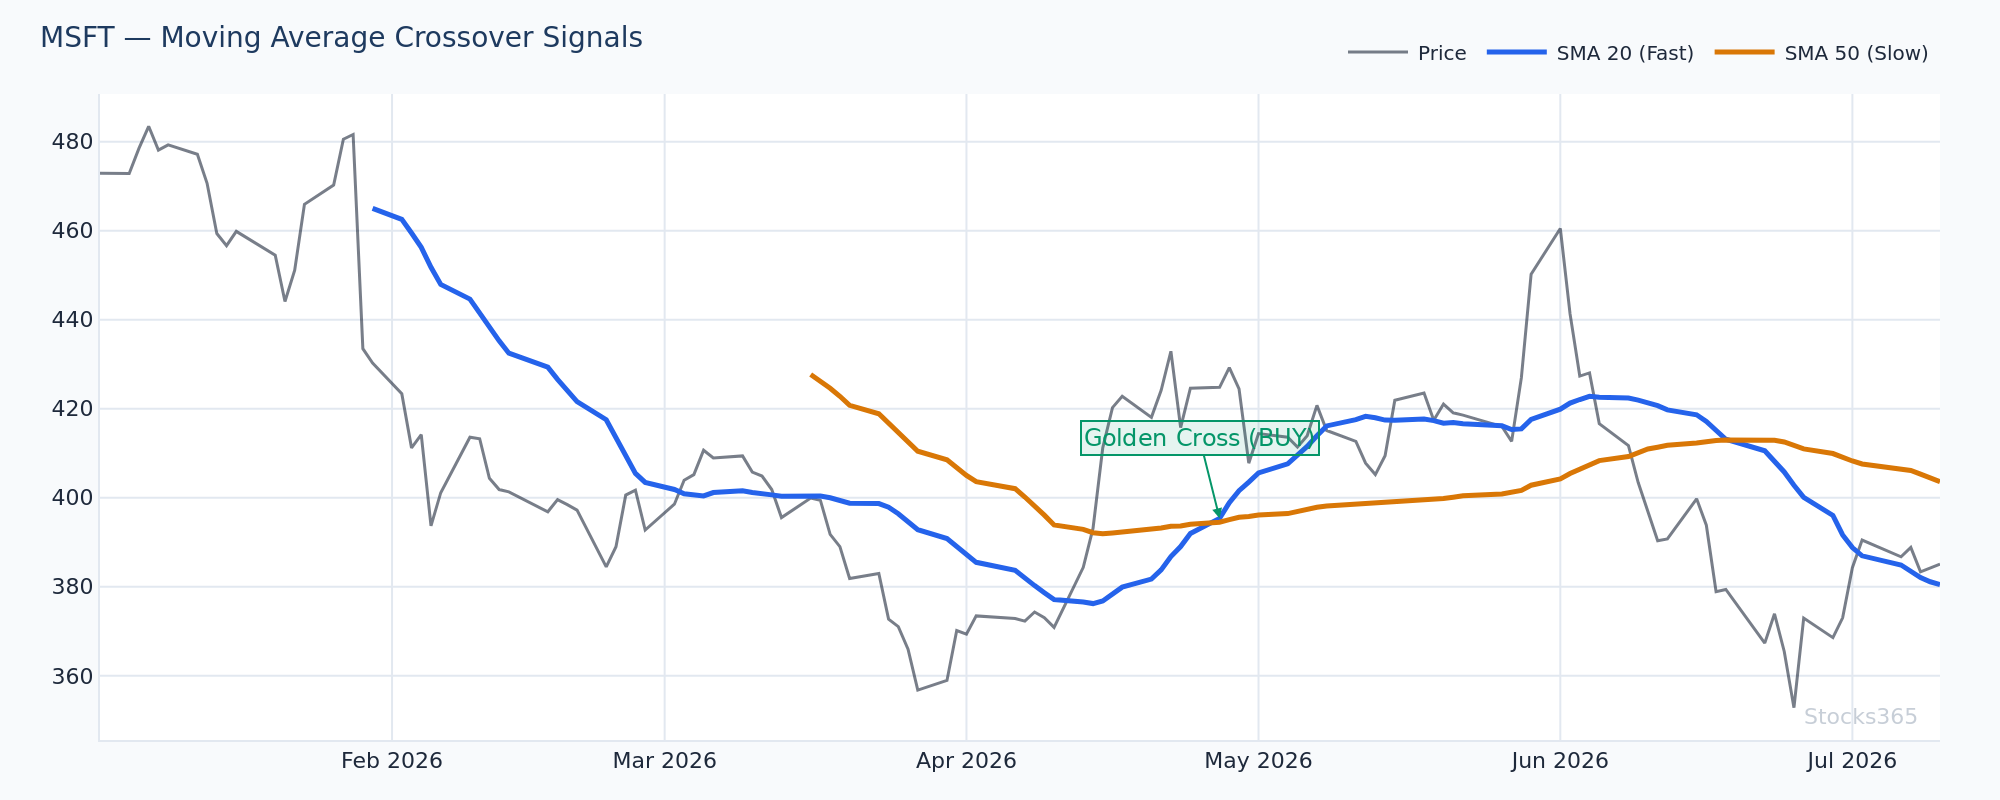
This chart shows MSFT resolving a Bollinger Band squeeze simultaneously with a 20-SMA/50-SMA bullish crossover — a powerful confluence of signals. The squeeze breakout defines the timing (volatility expanding), while the SMA crossover confirms the trend direction. What typically follows: a sustained directional move that lasts several weeks as both momentum and volatility align. The pattern is invalidated if the SMA crossover reverses within two to three candles — a false crossover signals weak underlying momentum and suggests the squeeze breakout may fail.
Practical Setup Guide: Applying Both Tools
Bollinger Band Setup for Active Traders
- Centerline: 20-period SMA
- Band width: 2 standard deviations (standard); consider 2.5 for crypto
- Primary setups: squeeze breakouts, band walks in trends, failed upper/lower band touches
- Best asset classes: equities, crypto (especially altcoins)
- Confirmation tools: RSI, volume, MACD histogram, or Stochastic
Price Envelope Setup for Systematic Traders
- Centerline: 20-period SMA for short-term; 50-period SMA for swing trading
- Band percentage: Calibrate to instrument's average true range over 3-6 months — 1-2% for low-vol blue chips, 3-5% for mid-volatility equities
- Primary setups: mean reversion from envelope extremes in stable, range-bound instruments
- Best asset classes: low-vol ETFs, dividend stocks in stable regimes
- Recalibrate: Every quarter, or after any significant volatility regime change
The Hybrid Approach
Some systematic traders run both simultaneously. Bollinger Bands provide the adaptive volatility signal; envelopes provide a fixed reference point for "extreme" price extension. When price extends beyond both the Bollinger upper band AND the fixed envelope, the signal strength increases — you're seeing a statistical outlier through two different lenses. That convergence is rare. When it happens, pay attention.
What to Watch For
- Bollinger squeeze on tech stocks: When band width drops below the 20th percentile of its 52-week range, the subsequent expansion frequently produces a 2-3 ATR directional move. Wait for a confirmed close above or below the bands — not just an intraday wick — before committing.
- Upper band walk in a strong uptrend: If price closes above the upper Bollinger Band for three or more consecutive sessions, don't fade it. That's a band walk — a sign of powerful momentum. Trade with it, not against it. Look for entries on any pullback to the 20-SMA centerline.
- Failed envelope touch with volume divergence: When price tags the upper envelope band but volume is declining, the extension lacks conviction. That combination — price extended, volume fading — is a genuine mean-reversion setup with better odds than a raw band touch alone.
- Envelope recalibration after volatility spikes: After any period where price regularly exceeds your envelope bands, recalculate the appropriate percentage offset using the most recent 60-90 days of ATR data. A miscalibrated envelope is worse than no envelope — it generates noise, not signal.
- Bollinger Band contraction following crypto drawdowns: On major crypto assets, a BB squeeze that forms after a 20%+ drawdown and resolves with a breakout above the upper band — confirmed by RSI recovering above 50 — has historically marked early-stage trend reversals rather than dead-cat bounces.
How Stocks365 Uses This
Stocks365 Trust Score Integration
The Stocks365 Trust Score system integrates Bollinger Band analysis as one of 12+ technical components that contribute to a signal's overall confidence rating. Specifically, Bollinger Band width and positioning contribute to the volatility regime scoring layer — narrow bands signal low-volatility environments where breakout signals carry higher weight; wide bands flag elevated volatility where mean-reversion signals are downweighted automatically.
When a stock's price action generates a squeeze breakout signal that aligns with momentum indicators (RSI direction, MACD histogram slope) and volume confirmation, the Trust Score reflects that multi-indicator agreement — surfacing only the highest-conviction setups from our signal database. Price envelopes contribute to the system's trend extension assessment, flagging when price has moved an extreme distance from its moving average baseline — a key input for identifying exhaustion conditions across asset classes.
You can see these signals in action on the Stocks365 signals dashboard, or explore individual stock setups like AAPL's current technical positioning. Our research dashboard publishes the full backtested performance data behind these components.
Key Takeaways
- Bollinger Bands adapt to volatility; price envelopes don't. That single difference makes Bollinger Bands superior in most active trading scenarios.
- Price envelopes work best on stable, low-volatility instruments with consistent historical volatility — where fixed-percentage thresholds remain calibrated to actual price behavior.
- The Bollinger squeeze is the most actionable setup either tool generates — band width compression below the 20th percentile historically precedes significant directional moves.
- Upper band touches alone are not signals. Stocks365 analysis of 3,255 signals shows a 49.6% win rate — statistically coin-flip territory. Always require confirmation.
- Asset class matters. Bollinger Band strategies perform best in crypto, weakest in commodities. Calibrate your expectations accordingly.
- Combine channel tools with momentum oscillators (RSI, Stochastic, MACD) for the highest-conviction setups. Channels define location; oscillators define momentum. You need both.
- Never recalibrate envelopes lazily. A percentage offset that worked six months ago may be completely wrong today. Quarterly recalibration is the minimum.
The Verdict
Bollinger Bands win for most traders in most markets. The adaptive volatility mechanism is not a minor feature — it's the entire reason the tool has remained dominant for decades. Price envelopes have a niche: stable instruments, consistent volatility, systematic strategies that prioritize simplicity over precision.
But here's the real answer: the best channel tool is the one you understand deeply enough to know exactly when it fails. A Bollinger Band trader who blindly fades every upper band touch will lose money. An envelope trader who never recalibrates will lose money. The edge isn't the tool. The edge is knowing when the tool applies — and when it doesn't.
Use the data. Trust the setup. Ignore everything else.