
RSI Indicator: The Complete Trading Guide for 2026
The RSI indicator is one of the most used — and most misused — tools in trading. Open any chart on TradingView, Trading 212, or any other platform, and you'll likely see it already attached. Most traders glance at it. Few understand it deeply enough to profit from it.
This guide fixes that.
We'll cover everything: what RSI actually measures, how to configure it correctly on TradingView, the best RSI trading strategies in 2026, platform-specific setups, and the cold hard data on when RSI signals actually work — and when they don't.
Stocks365 Backtested Insight: Our analysis of 2,153 RSI Oversold Bounce signals found a 56.9% win rate with a profit factor of 1.61 over a 10-day holding period. Across stocks specifically, that figure climbs to 62.9%. This isn't a coin flip — it's a measurable edge when applied correctly. Explore the full data on our research dashboard.
What Is the RSI Indicator?
RSI stands for Relative Strength Index. J. Welles Wilder Jr. introduced it in 1978 in his book New Concepts in Technical Trading Systems. Nearly five decades later, it remains one of the most referenced momentum oscillators in the world.
RSI measures the speed and magnitude of recent price changes. It outputs a value between 0 and 100. Classic interpretation: readings above 70 signal overbought conditions, readings below 30 signal oversold conditions.
That's the textbook definition. The edge is in what comes next.
The RSI Formula Explained
RSI is calculated using this formula:
RSI = 100 − [100 / (1 + RS)]
Where RS (Relative Strength) = Average Gain over N periods ÷ Average Loss over N periods.
The default period is 14 — meaning RSI looks back 14 candles to calculate momentum. A shorter period (e.g., 7) makes RSI more sensitive and volatile. A longer period (e.g., 21) makes it smoother and slower to react.
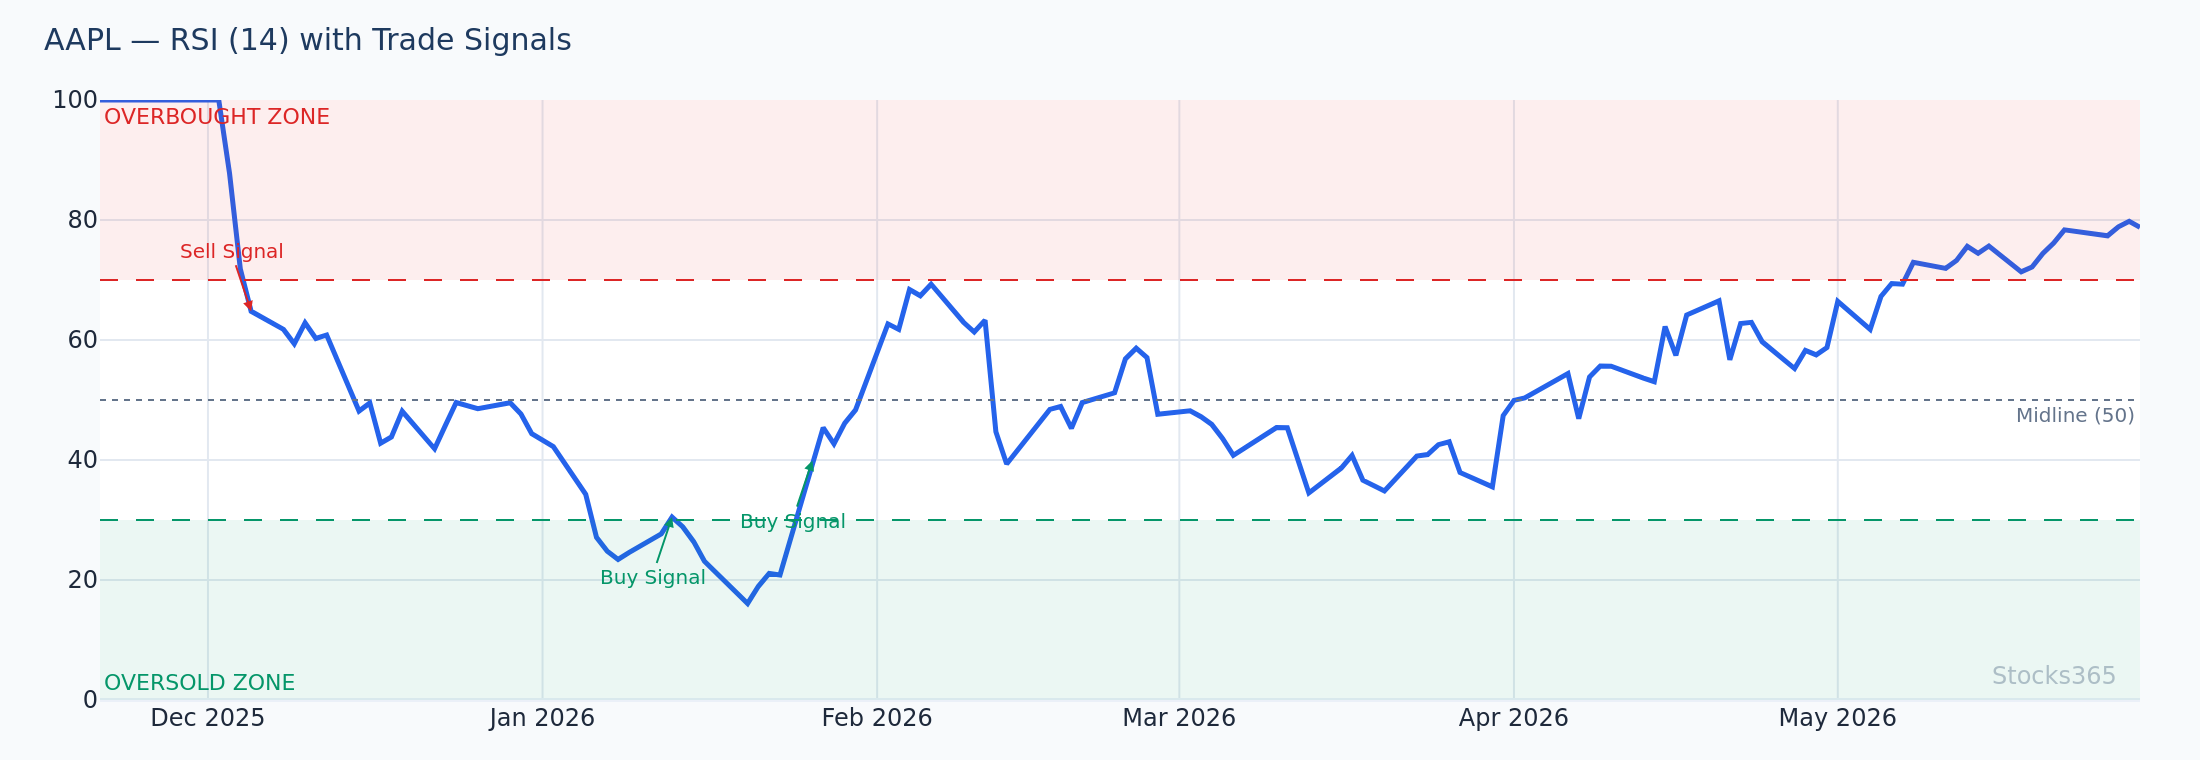
This chart highlights RSI dropping below 30 on AAPL while price forms a higher low — a classic oversold divergence pattern. When RSI then crosses back above 30, combined with a volume confirmation surge, the signal strengthens considerably. A failure to reclaim 30 on follow-through would invalidate the bounce thesis and suggest continued downside pressure.
RSI Indicator on TradingView: Setup & Settings Explained
TradingView is the platform most traders use to analyze RSI. Here's exactly how to configure it for maximum clarity.
How to Add RSI on TradingView (Free & Pro)
The RSI indicator on TradingView is completely free — no paid plan required. To add it:
- Open any chart on TradingView
- Click the Indicators button at the top toolbar
- Search for "RSI" or "Relative Strength Index"
- Click the result to apply it below your price chart
That's it. The default settings load automatically.
Best RSI Indicator TradingView Settings
Default settings work for most traders. But here's how to fine-tune based on your strategy:
- Length (Period): Default is 14. Day traders often drop to 7-9 for faster signals. Swing traders often raise to 21 for cleaner trends.
- Source: Default is "Close". This is almost always correct — leave it.
- Overbought Level: Default is 70. In strong bull trends, consider raising to 80.
- Oversold Level: Default is 30. In strong bear trends, consider lowering to 20.
- Moving Average Type: TradingView's RSI includes an optional MA overlay. A 9-period EMA on RSI is popular for additional signal confirmation.
One underrated TradingView feature: RSI-based alerts. Set an alert to fire when RSI crosses below 30 or above 70 on your watchlist. You'll never miss a setup again.
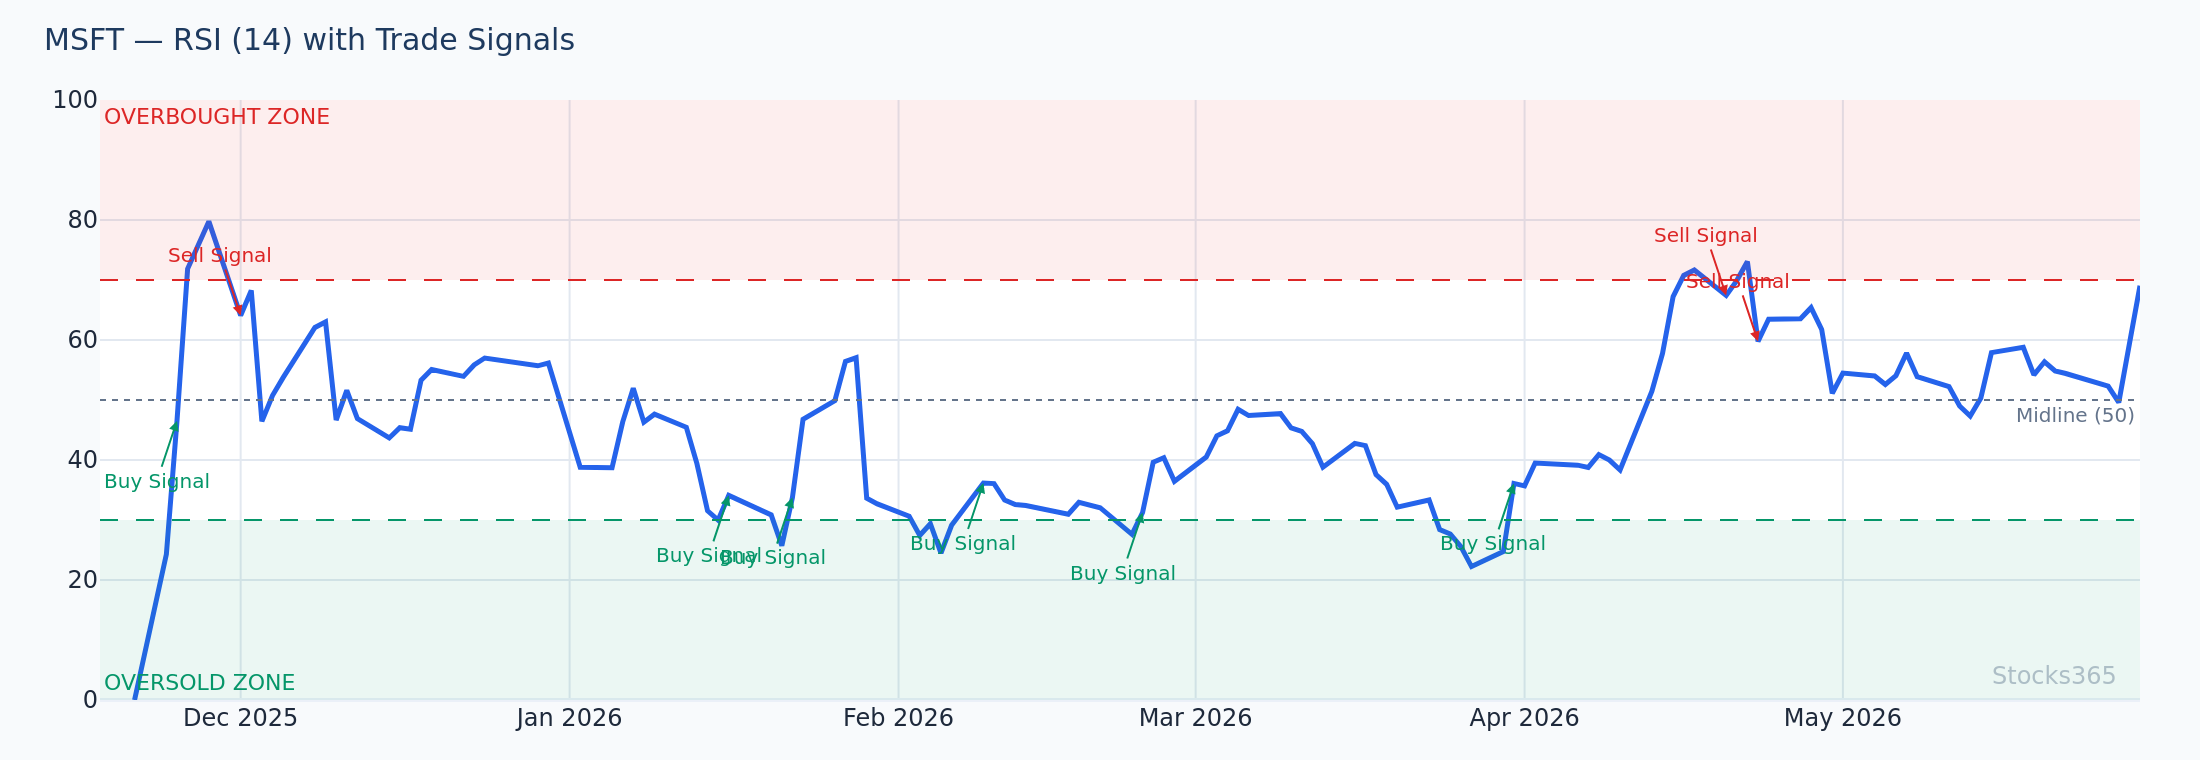
Here, MSFT's RSI approaches the 70 overbought threshold while the 9-EMA on RSI is still pointing upward — a sign that momentum hasn't reversed yet. The key signal to watch is when RSI breaks back below 70 while the MA crosses down through it. If RSI stalls below 70 without a prior clean break above it, the setup is less reliable and best skipped.
RSI Indicator on Trading 212
Trading 212 users can also access RSI directly in the platform's built-in chart tools. Navigate to the chart of any stock or ETF, open the indicator panel, and search "RSI." The interface differs from TradingView but the underlying calculation is identical.
Key difference: Trading 212's charting is less customizable than TradingView. If you want advanced RSI features — multi-timeframe RSI panels, divergence alerts, or custom RSI-based scripts — TradingView remains the superior free option. Many traders use Trading 212 for execution and TradingView for analysis.
What Is a Good RSI Reading?
"Good" depends entirely on context. Here's a practical breakdown:
- RSI 30–70 (Neutral Zone): Price is trending without extreme momentum in either direction. Most trades happen here.
- RSI Below 30 (Oversold): Selling pressure has been intense. A potential bounce zone — but not a guaranteed one.
- RSI Above 70 (Overbought): Buying pressure has been strong. A potential reversal zone — but in strong uptrends, RSI stays here for extended periods.
- RSI Above 80 or Below 20 (Extreme Readings): Rare and significant. These extremes on stocks often precede sharp mean reversions.
No single RSI reading is universally "good." A 28 RSI on a quality large-cap stock during a broad market dip is very different from a 28 RSI on a collapsing penny stock. Context is everything.
Is RSI a Reliable Indicator?
This is the most honest question traders ask — and it deserves a direct answer.
RSI alone is not reliable. Combined with price structure, volume, and broader market context, it becomes a genuinely useful edge.
The Data: Stocks365 backtested 3,679 RSI Overbought Reversal signals and found a 47.0% win rate with a profit factor of just 0.85 over a 10-day holding period. Taken in isolation, fading RSI overbought readings is a losing strategy. However, the same signal on crypto assets showed a 65.2% win rate — a massive divergence that illustrates why asset class context matters enormously. Check the breakdown on our research dashboard.
RSI overbought reversals fail most often on trending instruments. They work best in mean-reverting environments. Know your asset class before deploying any RSI strategy.
Here's What Most Traders Get Wrong
Most traders treat RSI 70 as an automatic sell signal. They see it flash red, they short, and then watch price grind higher for three more weeks while they're stopped out. In trending markets — especially during earnings momentum, sector rotations, or macro breakouts — RSI stays above 70 for extended periods. The actual edge isn't entering the moment RSI hits 70. The edge is watching RSI break back below 70 after a sustained overbought run. That reversion cross, especially when accompanied by a bearish candlestick pattern or a volume dry-up, is the real signal. The number itself is just a context clue.
Best RSI Trading Strategies in 2026
1. RSI Oversold Bounce Strategy
This is the highest-probability RSI setup in our backtested data. The setup:
- RSI drops below 30 on a quality stock (avoid applying this to commodities or distressed assets)
- Price forms a higher low or a bullish reversal candle (hammer, engulfing) near a prior support zone
- RSI crosses back above 30 on above-average volume
- Enter on the close of the crossover candle or the open of the next
This strategy works because oversold readings on fundamentally sound stocks often represent temporary fear-driven selloffs — not structural breakdowns. The 62.9% win rate on stocks (n=2,153) reflects this dynamic. For more on pairing RSI bounces with trendline analysis, see our dedicated guide: RSI Trendline Strategy: Master Drawing Lines for Better Signals.
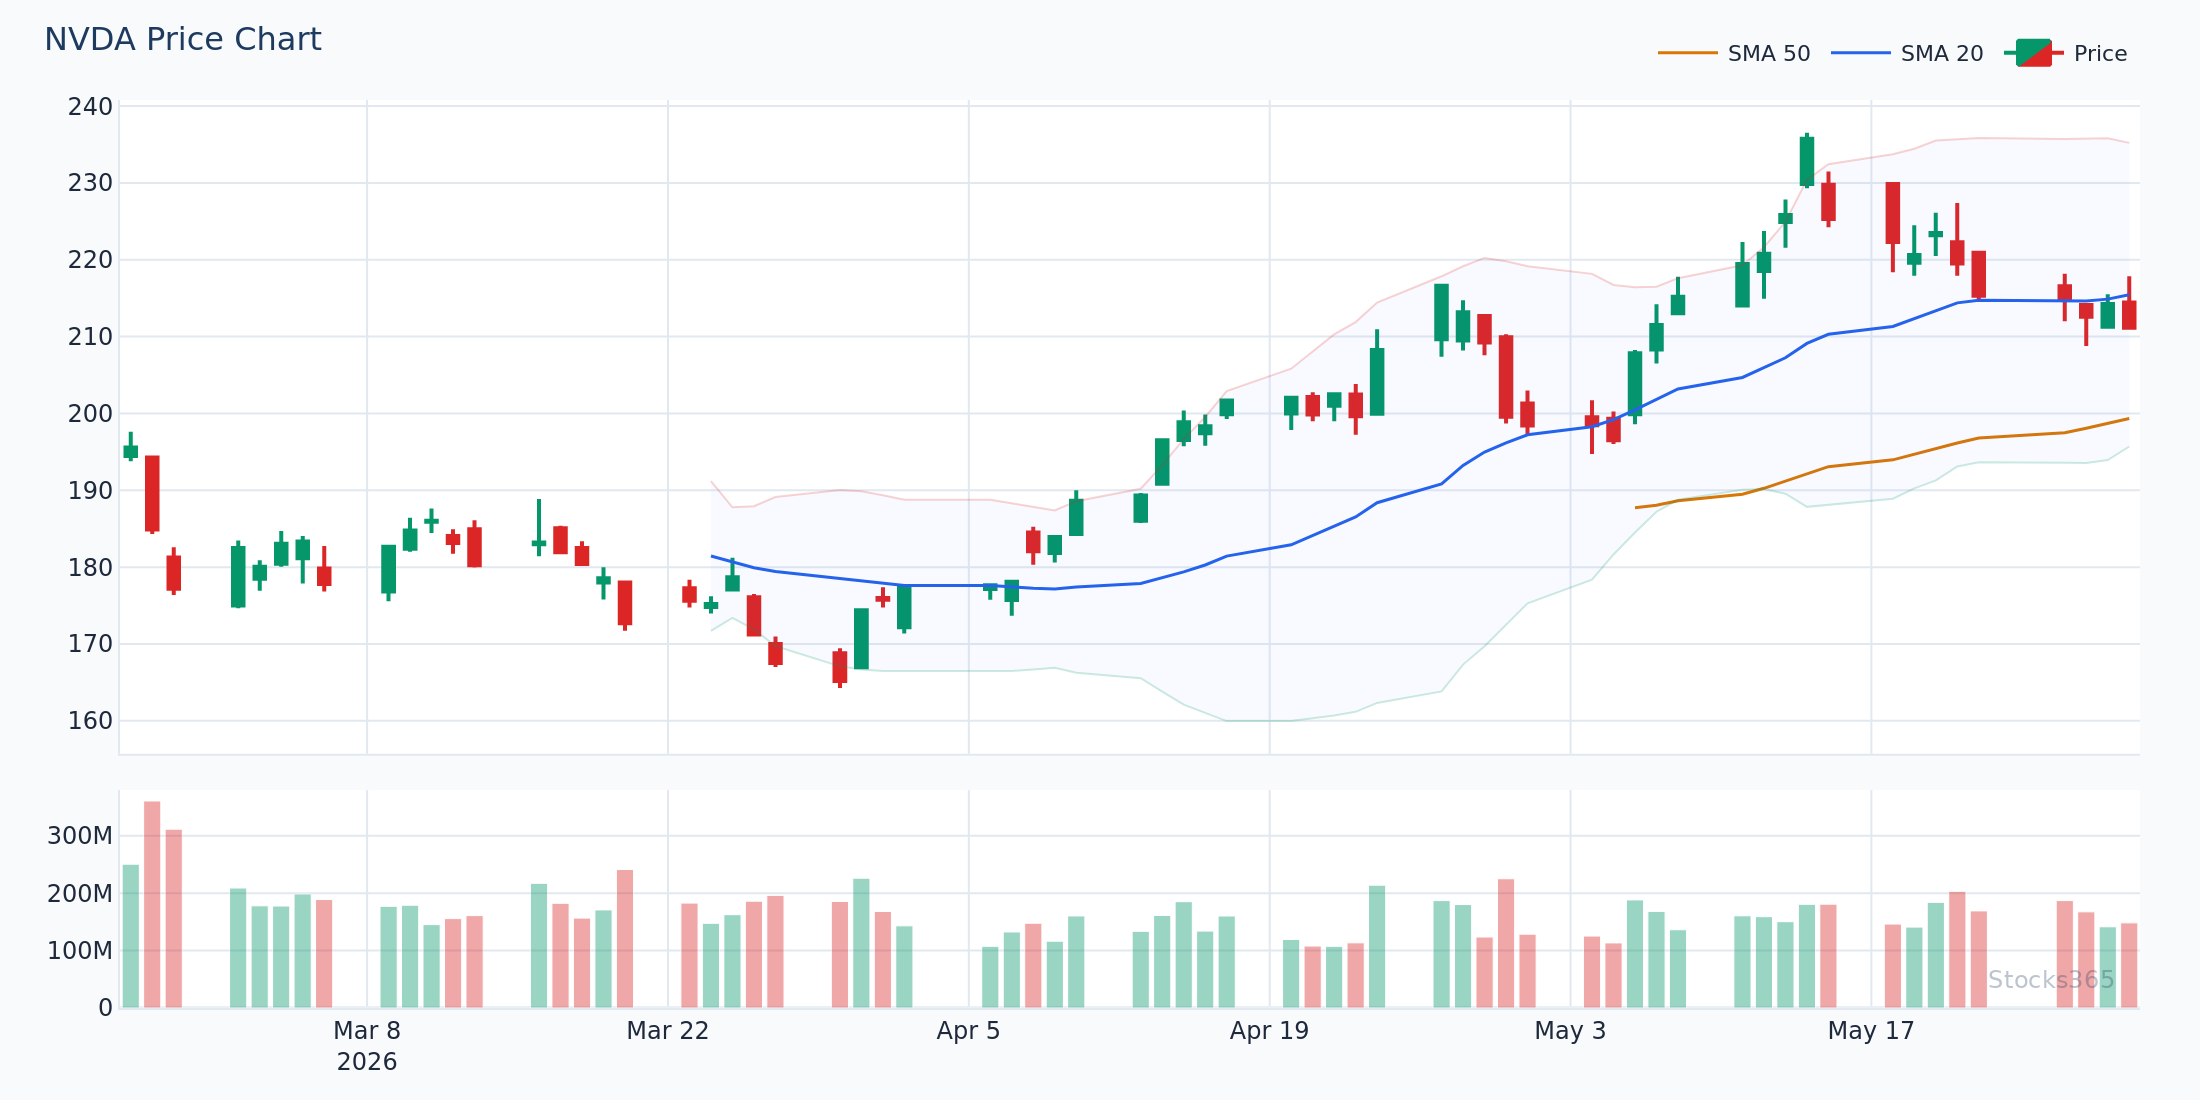
This NVDA setup shows price retesting a prior consolidation zone while RSI moves below 30 — the classic setup for a bounce. The confirming signal arrives when RSI crosses back above 30 and the candle closes with above-average volume. If the next two candles fail to hold the prior low and RSI rolls back below 30, that's an invalidation and the position should be exited.
2. RSI Divergence Strategy
Divergence is where RSI gets powerful. Bullish divergence: price makes a lower low, but RSI makes a higher low. Bearish divergence: price makes a higher high, but RSI makes a lower high.
Divergence signals weakening momentum before price reverses. It's not a trigger by itself — it's a warning. Combine divergence with a break of a trendline on the price chart or a moving average crossover for a cleaner entry. For complementary crossover techniques, see our Moving Average Crossover Strategy: Complete Trading Guide.
3. RSI Trend Confirmation Strategy
In strong uptrends, RSI consistently holds above 50. This is the 50-level rule. When RSI pulls back to the 50 zone during an uptrend and bounces — without breaking below it — that's a continuation signal, not a reversal warning.
Use the 50 level as a trend filter. If RSI is above 50, only take long setups. If RSI is below 50, only take short setups or stay in cash. Simple. Effective.
4. The WyseTrade Method: RSI Momentum Approach
The WyseTrade RSI strategy gained traction across retail trading communities for its structured approach to momentum entries. The core logic: wait for RSI to pull back from overbought (70+) levels, identify a "higher low" on the RSI itself in the 40-60 range, and re-enter when RSI turns back up through 50 in the direction of the primary trend.
This approach layers RSI with structure rather than treating extreme levels as binary signals. It aligns well with our momentum shift data. Combining it with a triple moving average system for trend confirmation further filters false entries — see our Triple Moving Average Strategy for Trend Confirmation for the full methodology.
5. RSI + MACD Combination Strategy
Pairing RSI with MACD creates a dual-momentum filter. RSI identifies momentum extremes; MACD confirms the direction of momentum. The setup: RSI is oversold (below 30) AND MACD histogram is contracting (reducing bearish momentum) simultaneously. When both conditions align, the probability of a bounce increases. Learn more about MACD as a complementary tool in our MACD in Forex Trading: Master Currency Pair Strategies guide.
RSI Across Different Asset Classes
RSI doesn't behave the same across all markets. This is critical and chronically under-discussed.
- Stocks: RSI oversold bounces perform best here. Quality companies with strong fundamentals tend to mean-revert after fear-driven drops. Win rate climbs significantly in large-cap equities.
- Crypto: Overbought reversals work better in crypto than most asset classes — 65.2% win rate in our dataset. Crypto's volatility creates cleaner RSI swings and larger mean-reversion moves.
- Commodities: RSI is least reliable on commodities. Supply/demand shocks can keep RSI oversold or overbought for much longer than equities. Both our oversold bounce (43.5% win rate) and overbought reversal (40.7% win rate) data confirm this. Avoid applying standard RSI strategies to commodities without significant additional filters.
- Forex: RSI works in ranging forex pairs. In trending currency pairs, the same overbought/oversold trap applies as with stocks — see the pairing with MACD above.
Know your market before you trust your indicator.
RSI vs. Stochastic Oscillator: Which Is Better?
Both RSI and the Stochastic Oscillator measure momentum. The key difference: Stochastic compares current price to the high-low range over a period, while RSI compares the magnitude of up-moves vs. down-moves.
In practice, Stochastic generates signals faster (more sensitive, more noise). RSI is smoother and produces fewer but cleaner signals. For new traders, RSI is the better starting point. For experienced traders, combining both can create confirmation layers. Dive into the Stochastic side of that equation with our guides: How the Stochastic Oscillator Works: Formula Explained and How to Read the Stochastic Oscillator: Step-by-Step.
RSI With Bollinger Bands: A Powerful Combination
RSI and Bollinger Bands complement each other naturally. When price tags the lower Bollinger Band AND RSI is below 30 simultaneously, the probability of a bounce increases sharply. The Bollinger Band confirms the price-level extreme; RSI confirms the momentum extreme. Two independent signals pointing the same direction.
For the complete framework of combining these two tools, see our Moving Average + Bollinger Bands: Complete Strategy Guide. For a real-world case study of Bollinger Bands in action on a major stock, see our Bollinger Bands Case Study: Apple Stock Decoded.
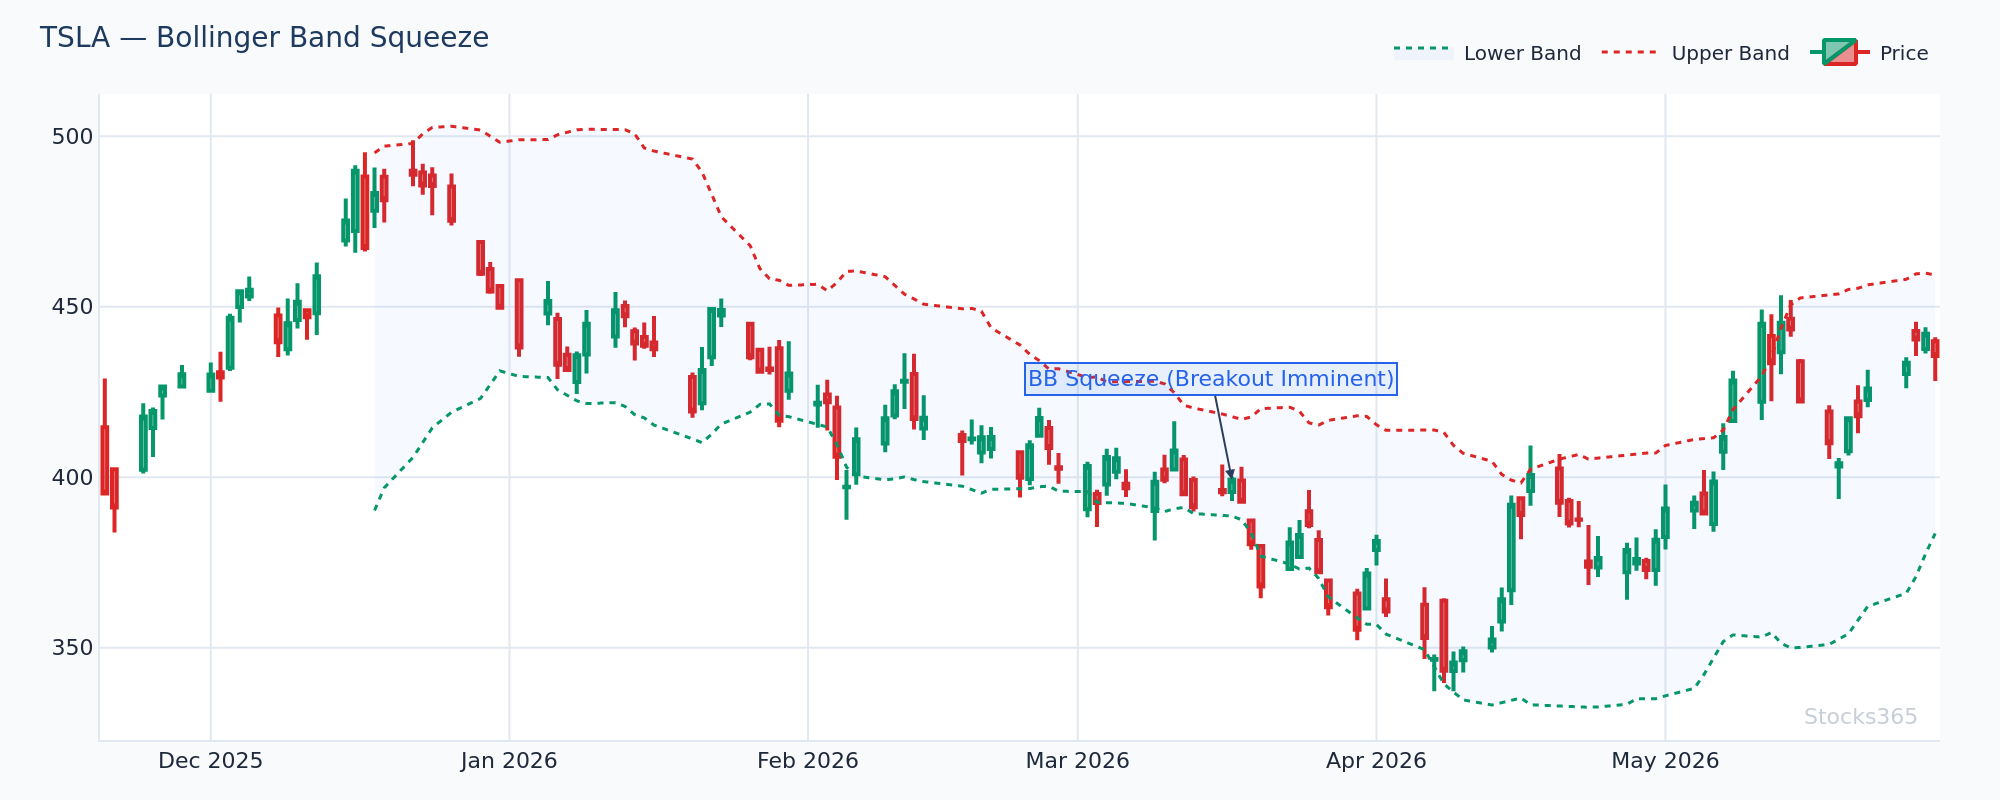
This TSLA setup illustrates the dual-confirmation approach: price pressing against the lower Bollinger Band while RSI simultaneously moves below 30 creates a high-conviction oversold read. The pattern resolves bullishly when price closes back inside the band and RSI begins recovering above 30. A close below the lower band on the next session — especially with rising volume — invalidates the bounce setup entirely.
What to Watch For
- RSI oversold bounces on large-cap tech stocks during broad market pullbacks: When the broader market index drops 5-8% and leading large-cap stocks show RSI below 30 with bullish divergence forming, the setup has historically produced the highest-probability RSI bounce trades. Confirmation comes from RSI recrossing 30 on above-average volume.
- Bearish RSI divergence after extended overbought runs in crypto: When a crypto asset has held RSI above 70 for 10+ sessions and price makes a new high while RSI makes a lower high, the setup signals weakening momentum. Wait for RSI to break below 70 before acting.
- RSI 50-level rejections in downtrending stocks: In a clear downtrend (price below the 200-SMA), watch for RSI rallies that stall at 50 and roll back over. This is a high-quality continuation short setup — the 50 level acts as resistance on the RSI just as price levels act as resistance on the chart.
- RSI compression before earnings in mid-cap stocks: When RSI tightens into the 45-55 range for 5+ sessions into an earnings event, a breakout in either direction tends to be amplified. The RSI coil pre-earnings is a setup worth tracking, not trading — use it to prep your post-earnings reaction plan.
- Multi-timeframe RSI alignment: When daily RSI and weekly RSI are both below 30 simultaneously on a quality asset, the confluence is rare and historically significant. These setups are worth placing on your Stocks365 signals dashboard for real-time monitoring.
How Stocks365 Uses This
How Stocks365 Integrates RSI Into Its Trust Score System
RSI is one of 12+ indicators that power the Stocks365 Trust Score — our proprietary signal-confidence rating system. Within the framework, RSI contributes primarily to the momentum agreement component: when RSI aligns with price structure, volume signals, and trend indicators simultaneously, the Trust Score for that signal rises. A high Trust Score doesn't mean "guaranteed win" — it means multiple independent indicators are confirming the same directional thesis.
RSI also feeds into the regime filter layer. When market-wide RSI readings are compressed (broad oversold conditions), the system adjusts signal thresholds to reduce false negatives on individual stock setups. This prevents the system from filtering out legitimate oversold bounces simply because they look "weak" in isolation.
Explore active RSI-based signals with Trust Scores on individual assets like AAPL signals, or browse the full Stocks365 signals dashboard to see RSI momentum in context across your watchlist.
Key Takeaways
- RSI measures momentum, not price direction. It tells you how fast price is moving, not where it's going next — context determines the trade.
- The oversold bounce is the highest-probability RSI setup: 56.9% win rate, 1.61 profit factor across 2,153 signals — climbing to 62.9% on stocks specifically.
- RSI overbought signals underperform on their own (47.0% win rate, profit factor 0.85). Never fade overbought RSI in a trending market without additional confirmation.
- Asset class matters enormously. RSI strategies work best on stocks, worst on commodities. Crypto shows unique overbought reversal tendencies not seen in other asset classes.
- TradingView is the best free platform for RSI analysis. Default settings (14-period, 70/30 levels) are a solid starting point — adjust based on timeframe and asset volatility.
- Combine RSI with price structure and volume for meaningful edge. RSI alone is noise. RSI + confluence is signal.
- The 50 level is underrated. It separates bullish regimes from bearish regimes on the RSI itself — use it as a trend filter, not just the 70/30 extremes.