
How to Read the Stochastic Oscillator: Step-by-Step Guide
The stochastic oscillator is one of the most misread indicators in technical analysis. Traders glance at it, see a line above 80, and immediately think "sell." That instinct costs them trades. Reading it correctly is a skill — and once you have it, the indicator becomes genuinely powerful.
This guide walks you through every layer of the stochastic oscillator: what the lines mean, how to identify high-probability setups, and when to trust the signal versus ignore it entirely.
Stocks365 Research: Our analysis of 8,204 stochastic oversold signals found a 54.7% win rate over a 10-day holding period (profit factor: 1.24). Forex led all asset classes at 57.0%. That edge is real — but only when you read the indicator correctly. See the full breakdown on our research dashboard.
What the Stochastic Oscillator Actually Measures
Before you read it, understand what it's telling you. The stochastic oscillator measures where the current closing price sits relative to the price range over a lookback period — typically 14 periods. It doesn't measure price direction. It measures momentum within a range.
The result is two lines:
- %K (the fast line) — the raw stochastic reading, plotted as a percentage between 0 and 100
- %D (the slow line) — a 3-period moving average of %K, used as a signal line
When price closes near the top of its recent range, %K climbs toward 100. When it closes near the bottom, %K drops toward 0. Simple concept. The complexity — and the edge — comes from knowing what to do with that information.
For a deeper dive into the math behind these calculations, read How the Stochastic Oscillator Works: Formula Explained.
This chart shows %K oscillating between 20 and 80 during a controlled uptrend. When %K dips toward 20 and curls back up, price typically resumes the trend direction within 2–3 candles. The setup is invalidated if %K breaks below 20 and stays there — that signals genuine selling pressure, not a brief pullback.
The Four Core Readings You Need to Know
1. Overbought and Oversold Zones
Readings above 80 are considered overbought. Readings below 20 are oversold. Most beginners stop here. Don't.
Here's what most traders get wrong: an overbought stochastic reading is NOT a sell signal. In a strong uptrend, the stochastic can stay above 80 for days or even weeks. Selling every time %K crosses 80 in a trending market is a fast way to miss massive moves. The real signal is when %K drops back below 80 after being overbought — that's the momentum shift you're watching for.
The same logic applies to oversold. An oversold reading means price has been weak relative to its recent range. It does not guarantee a bounce. The actionable signal is the exit from the oversold zone — when %K crosses back above 20, confirming that selling pressure is easing.
2. %K and %D Crossovers
The crossover between %K and %D is the stochastic's primary signal. When the fast %K line crosses above the slower %D line, that's a bullish signal. When %K crosses below %D, that's bearish.
Crossovers mean more when they happen inside the extreme zones:
- Bullish crossover below 20 — %K crosses above %D while both lines are in oversold territory. High-probability long setup.
- Bearish crossover above 80 — %K crosses below %D while both are overbought. High-probability short or exit signal.
Crossovers in the middle of the range (between 40 and 60) produce significantly more false signals. Filter those out until you have enough experience to read the surrounding context.
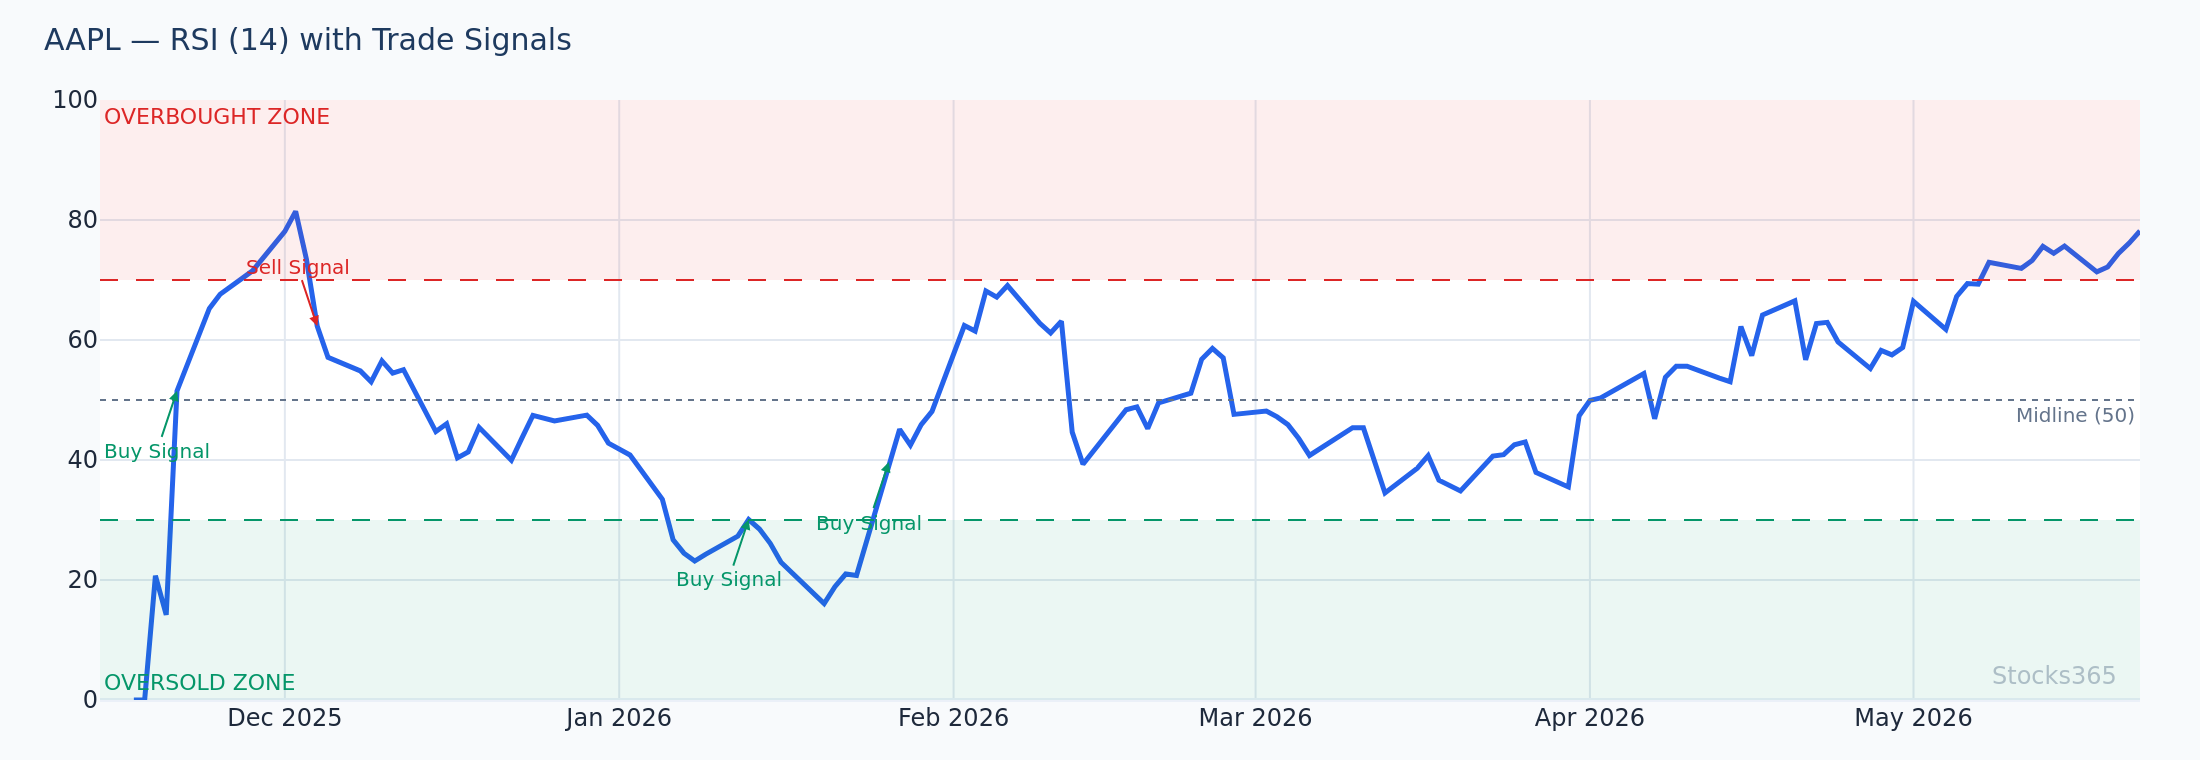
Here, a bullish %K/%D crossover forms just as both lines exit the sub-20 oversold zone. Price gaps slightly higher on the following session and then trends upward for several candles. The pattern is confirmed when %K stays above %D for more than one candle — a single-candle crossover that immediately reverses is a false signal and should be disregarded.
3. Stochastic Divergence
Divergence is where the stochastic gets genuinely powerful — and genuinely tricky. Divergence occurs when price makes a new high (or low) but the stochastic fails to confirm it.
Bearish divergence: Price prints a higher high, but %K makes a lower high. Momentum is weakening even as price climbs. A reversal often follows.
Bullish divergence: Price makes a lower low, but %K makes a higher low. Sellers are losing steam. Watch for a bounce.
Divergence signals on the stochastic work best when confirmed by price action — a reversal candle, a break of a short-term trendline, or a volume spike. Divergence alone is a warning. Divergence plus confirmation is a trade.
If you're already familiar with divergence concepts from RSI, the logic transfers directly. See Hidden RSI Divergence: The Advanced Signal Most Traders Miss for a parallel breakdown that complements this approach.
4. The Midpoint Cross (50 Level)
Often ignored. Shouldn't be. When %K crosses above 50 from below, it signals that price is closing in the upper half of its recent range — bullish momentum is taking over. When %K drops below 50, sellers are dominating short-term price action.
Use the 50 level as a trend filter. In an uptrend, only take bullish crossover signals when %K is above 50. In a downtrend, only trade bearish signals when %K is below 50. This single filter dramatically reduces false signals.
Step-by-Step: Reading a Stochastic Setup in Real Time
Here's the exact process. Follow these steps every time you open a chart with the stochastic oscillator.
Step 1: Identify the trend. Look at the price chart first, not the indicator. Is price making higher highs and higher lows? Lower highs and lower lows? Sideways? The stochastic reads differently in each regime.
Step 2: Note the stochastic zone. Is %K above 80, below 20, or somewhere in between? Extreme readings carry more weight than mid-range readings.
Step 3: Watch for the crossover. Wait for %K to cross %D. Don't anticipate — wait for the candle to close and confirm the crossover. Early entries on anticipated crosses are a beginner mistake.
Step 4: Check for divergence. Compare the current %K high or low to the previous swing high or low. Does the stochastic confirm price? Or is there a discrepancy?
Step 5: Look for confluence. One indicator is never enough. Combine the stochastic signal with support/resistance levels, a moving average, or a volume reading. Three aligned factors make a trade. One factor makes a guess.
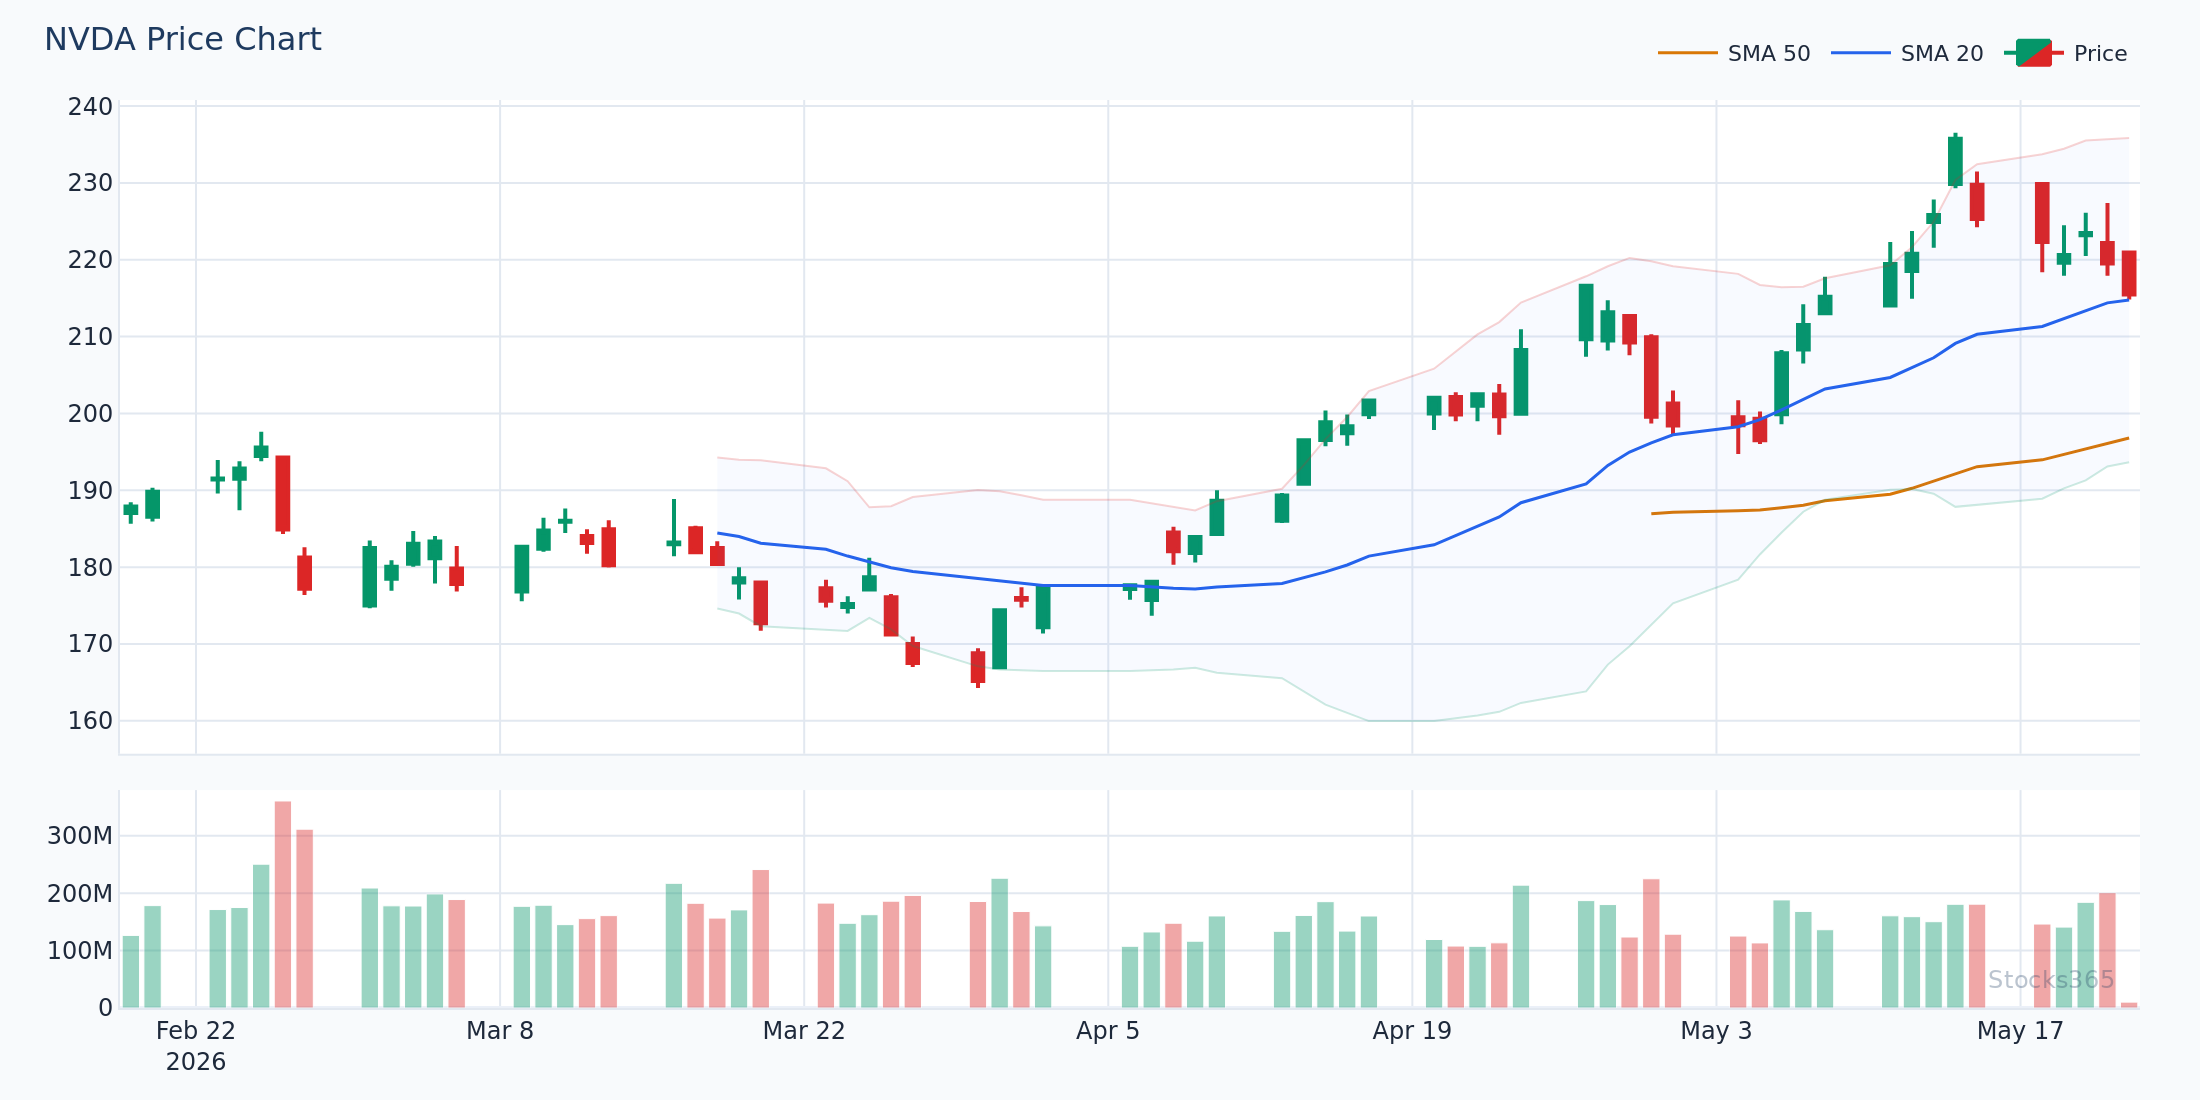
In this setup, price is in a clear short-term downtrend with lower highs forming on the daily chart. The stochastic drops into oversold territory, then %K crosses above %D while price simultaneously touches a well-established support zone. Volume on the reversal candle is 1.5x the 20-day average — three confluence factors align. The signal is invalidated if price closes below the support zone on the following session regardless of where the stochastic sits.
Stochastic Settings: Which Version to Use
The default setting is 14 periods for %K and 3 periods for %D. That's the most widely used configuration. But not the only one.
- Fast Stochastic (5,3,3) — More sensitive, more signals, more false positives. Works on lower timeframes for scalpers.
- Slow Stochastic (14,3,3) — The standard. Good for swing traders on daily and 4-hour charts.
- Full Stochastic — Customizable version where you control the smoothing of both %K and %D. Best for experienced traders who want precise control.
Start with the default 14,3,3. Master it before experimenting with alternatives.
Combining the Stochastic with Other Indicators
Stochastic + Bollinger Bands
This combination is one of the highest-probability setups available. When price touches the lower Bollinger Band and the stochastic is in oversold territory, you get a double-confirmation setup. Both indicators are saying the same thing from different angles — price has stretched too far, too fast.
Stocks365 Backtested Result: The Bollinger Band + Stochastic double oversold setup produced a 58.9% win rate across 2,501 signals (profit factor: 1.61) over a 10-day holding period. Commodities led at 61.1%. This is one of the stronger combined setups in our entire signal library.
For a full breakdown of how to construct this combined strategy, read Moving Average + Bollinger Bands: Complete Strategy Guide.
Stochastic + Moving Averages
Use a moving average to define the trend, then use the stochastic to time entries within that trend. A common setup: price above the 50-period SMA signals an uptrend. Wait for the stochastic to pull into oversold territory, then trade the bullish crossover back toward the SMA. Trend direction from the MA, entry timing from the stochastic.
See also: Moving Average Crossover Strategy: Complete Trading Guide and Triple Moving Average Strategy for Trend Confirmation for advanced trend-filtering frameworks that pair naturally with stochastic timing.
Stochastic + MACD
The MACD measures trend momentum over a longer cycle. The stochastic measures short-term price position. When both agree — MACD histogram turning positive while stochastic crosses up from oversold — the signal strength increases significantly. For currency pair applications specifically, see MACD in Forex Trading: Master Currency Pair Strategies.
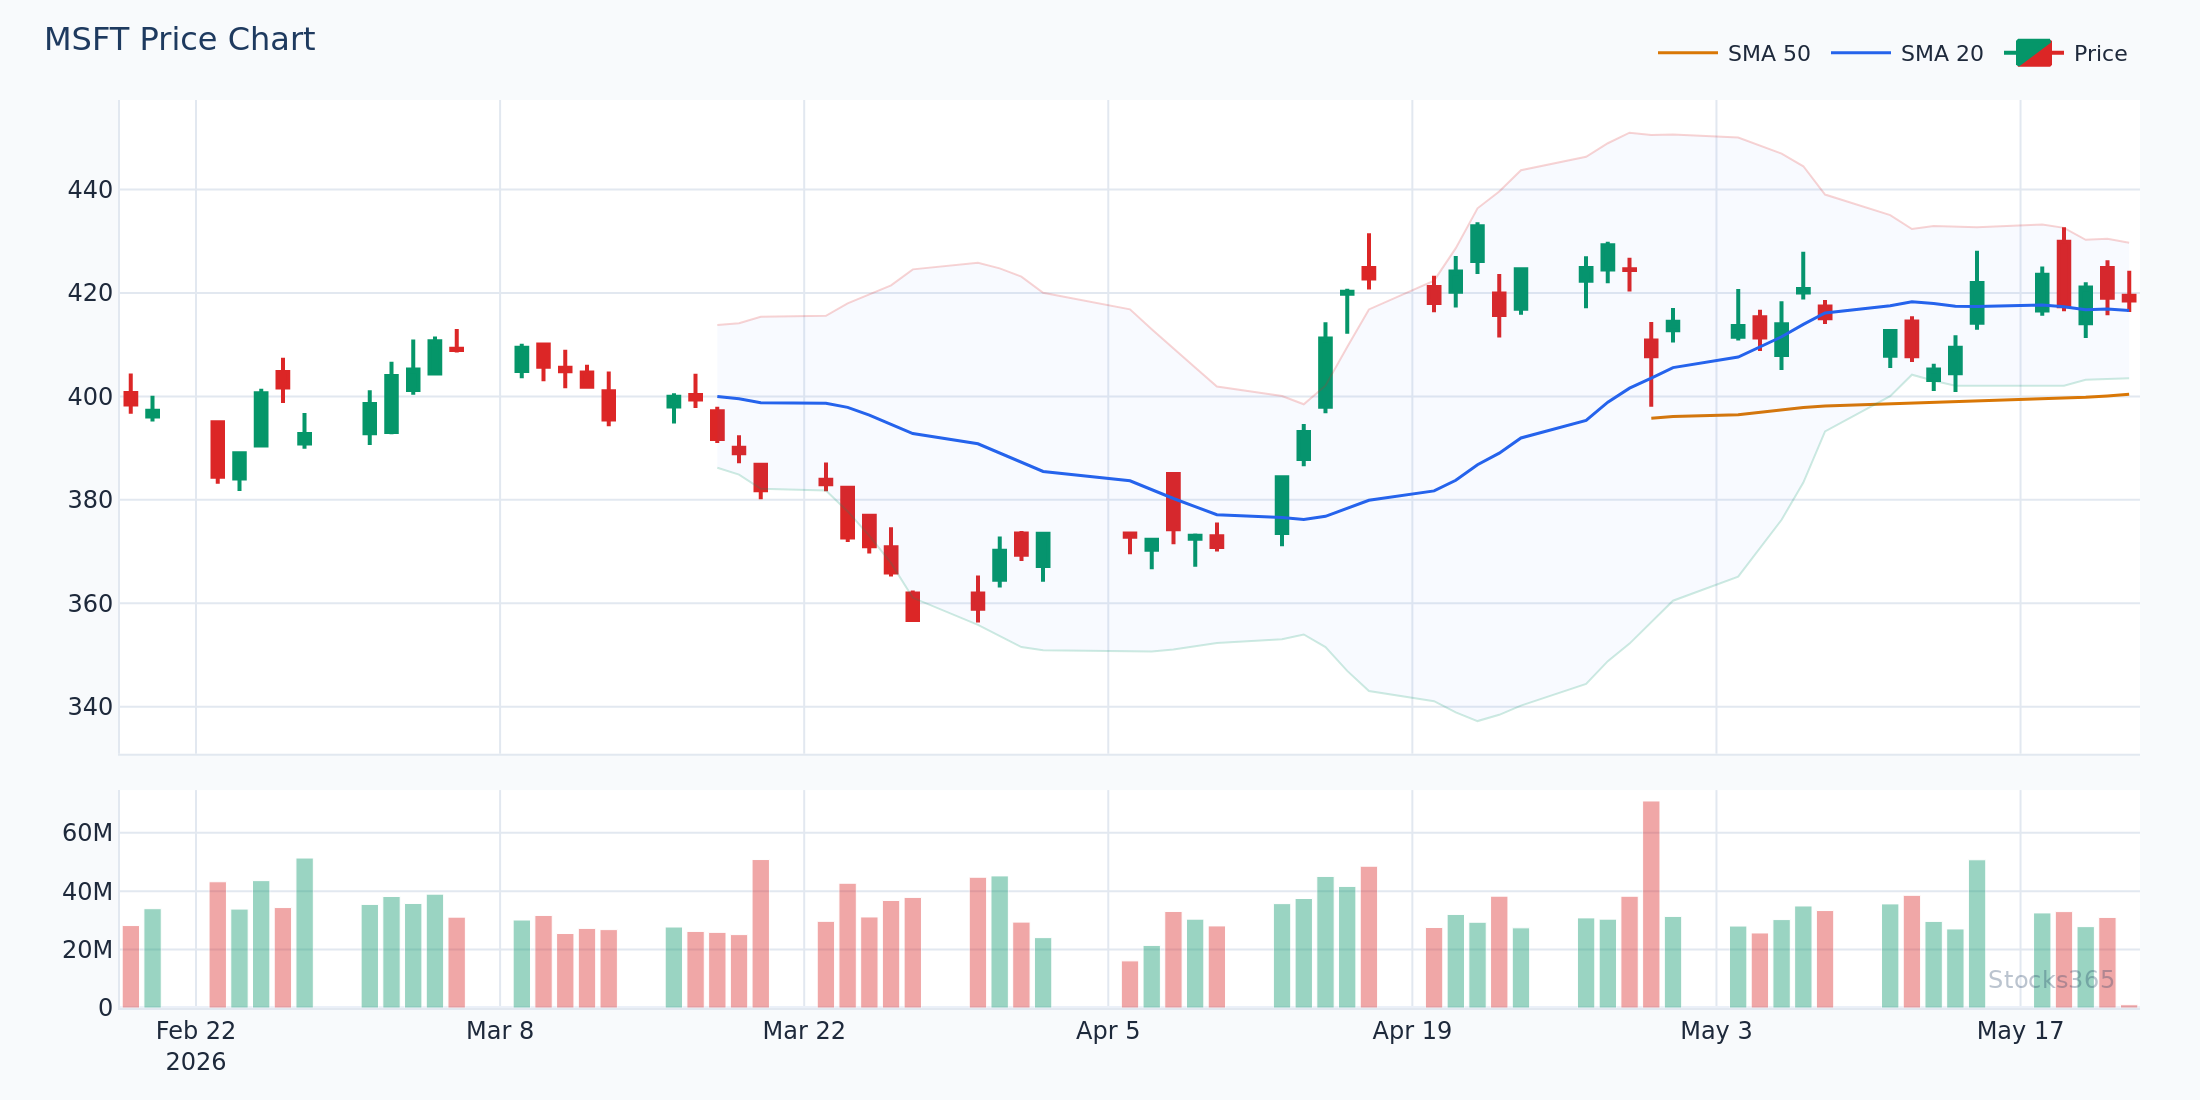
This chart shows price pulling back toward the 50-SMA while the stochastic simultaneously drops into oversold. The %K/%D bullish crossover fires just as price finds the moving average. The combined signal — stochastic oversold exit plus dynamic support — often leads to a 1–2 ATR recovery move over the following week. The trade idea is invalidated if price closes below the 50-SMA with conviction.
When the Stochastic Fails (And Why)
Know the failure modes. They save accounts.
The stochastic fails most often in strong trending markets. When a stock is in a powerful uptrend driven by a fundamental catalyst — an earnings beat, a sector rotation, a macro event — the stochastic can sit in overbought territory for an extended period. Every oversold "signal" that appears is a trap for traders who don't check the broader context first.
It also underperforms in illiquid or low-volume conditions. Thin markets produce erratic price swings that whipsaw the stochastic back and forth without generating tradeable follow-through.
Asset Class Warning: Stocks365 backtested 9,257 stochastic overbought signals and found only a 48.8% win rate (profit factor: 0.86) — meaning the strategy loses money on average. Overbought signals in commodities performed worst at 44.6%. Overbought does not mean reversal. Context is everything.
The fix: always check the higher timeframe trend before acting on a stochastic signal from a lower timeframe. A daily stochastic overbought reading means very little if the weekly chart shows a roaring uptrend with no signs of distribution.
What to Watch For
- Bullish %K/%D crossover exiting the sub-20 zone in forex pairs during the London-New York overlap session — volume and liquidity are highest during this window, and stochastic signals from oversold territory carry stronger follow-through in currency markets.
- Stochastic bullish divergence forming at a prior swing low after a 10–15% pullback in large-cap equities — when price retests a previous low and %K makes a higher low, the probability of a sustained recovery increases materially.
- Double oversold confluence: price at lower Bollinger Band AND stochastic below 20 simultaneously — this dual compression setup has historically resolved with a sharp mean-reversion move, particularly in commodity markets.
- Stochastic %K crossing below 50 in a market that recently broke a key moving average — this combination (price structure break + momentum confirmation) is a reliable early signal of a trend shift rather than a temporary dip.
- Fast stochastic (5,3,3) producing a bearish crossover above 80 on the 1-hour chart while the daily stochastic is also overbought — multi-timeframe agreement on overbought conditions dramatically increases the probability of at least a short-term pullback.
How Stocks365 Uses This
How Stocks365 Integrates the Stochastic Oscillator
The stochastic oscillator is one of 12+ technical indicators that feed into the Stocks365 Trust Score system. Specifically, stochastic readings contribute to the momentum agreement layer — which measures how many independent momentum indicators align at a given signal point. When the stochastic oversold exit crossover fires in agreement with the RSI, MACD, and volume indicators, the Trust Score for that signal rises significantly.
Stochastic divergence (when identified algorithmically) also contributes to the regime detection component of the Trust Score, flagging potential trend exhaustion before it becomes visible in raw price data. You can see these composite Trust Scores applied to live signals on the Stocks365 signals dashboard — for example, current momentum readings for AAPL signals include stochastic state as part of the full indicator stack. The goal is never to rely on one reading in isolation — the Trust Score makes that principle systematic.
Key Takeaways
- Overbought ≠ sell. Oversold ≠ buy. The signal is the exit from those zones, not the entry into them.
- %K/%D crossovers inside the extreme zones (above 80 or below 20) are the highest-probability signals. Mid-range crossovers produce excessive false positives.
- Divergence warns. Confirmation triggers. Don't trade divergence without a confirming price action signal.
- The 50 level is a trend filter. Only take bullish stochastic signals above 50 in an uptrend, bearish signals below 50 in a downtrend.
- Combine with context. Stochastic + moving average + volume confirmation produces far higher-quality signals than the stochastic alone.
- Overbought signals underperform. Stocks365 backtested 9,257 signals with a profit factor of only 0.86 — net negative. Focus your edge on oversold setups in trending markets.
- Multi-timeframe alignment multiplies signal strength. Daily and hourly stochastic in agreement is stronger than either alone.
Frequently Asked Questions
What is the best stochastic oscillator setting for day trading?
For day trading on 5-minute to 15-minute charts, many active traders use a faster setting like 5,3,3 to generate more responsive signals. The default 14,3,3 works better on hourly and daily charts where you want to filter out noise. Start with the standard setting and only adjust once you understand how each parameter change affects signal frequency and accuracy.
How do I know if a stochastic signal is reliable?
Reliability increases with confluence. A stochastic crossover in oversold territory is a starting point — not a trade. Add at least two confirming factors: a price support level, a moving average test, a volume surge, or agreement from a second momentum indicator like RSI or MACD. The more factors align, the higher the signal quality. The Stocks365 Trust Score system formalizes exactly this kind of multi-factor confirmation.
What's the difference between fast and slow stochastic?
The fast stochastic uses the raw %K calculation and a simple 3-period average for %D. It reacts quickly to price changes but produces more false signals. The slow stochastic smooths the original %K before calculating %D, resulting in less noise and fewer but higher-quality signals. Most swing traders and position traders prefer the slow stochastic for that reason. For a complete breakdown of the math behind both versions, see How the Stochastic Oscillator Works: Formula Explained.
Can the stochastic oscillator be used for forex trading?
Yes — and Stocks365 backtesting shows forex is actually where stochastic oversold signals perform best, with a 57.0% win rate across our dataset. Currency pairs tend to mean-revert more consistently than equities or crypto, which makes the stochastic's oversold bounce signals particularly effective. Pair the stochastic with key support levels or Fibonacci retracement zones on major pairs for the strongest setups.
How does the stochastic oscillator differ from RSI?
Both are momentum oscillators, but they measure different things. RSI measures the speed and magnitude of price changes over a set period. The stochastic measures where the current close sits relative to the high-low range over a lookback period. In practice, RSI tends to be smoother and better for identifying divergence, while the stochastic is more sensitive and better for timing short-term entries via crossovers. Used together, they provide complementary perspectives on the same momentum dynamic. See RSI Trendline Strategy: Master Drawing Lines for Better Signals for how to use RSI alongside stochastic in a unified framework.