
Triple Moving Average Strategy: The Trend Confirmation Edge Most Traders Overlook
Most traders use one moving average. Some use two. The traders who consistently stay on the right side of major trends? They use three.
The triple moving average strategy stacks three moving averages — typically a fast, medium, and slow period — to create a layered confirmation system that filters out noise and identifies high-conviction trend entries. When all three align, the signal is hard to ignore.
Stocks365 backtested over 3,300 moving average crossover signals across multiple asset classes and found a 50.9% win rate with a profit factor of 1.06 over a 10-day holding period (n=3,332). That edge compounds dramatically when you add the alignment filters the triple MA system provides — and this article shows you exactly how to apply them.
What Is the Triple Moving Average Strategy?
The triple moving average strategy uses three exponential or simple moving averages at different lookback periods simultaneously on the same chart. The most common configuration is:
- Fast MA: 10-period (reacts quickly to price)
- Medium MA: 20-period (tracks the short-term trend)
- Slow MA: 50-period (defines the dominant trend direction)
A bullish signal fires when the fast MA crosses above the medium MA, while both trade above the slow MA. A bearish signal fires when the fast MA crosses below the medium MA, while both trade below the slow MA. The slow MA acts as the final gatekeeper — filtering trades that swim against the primary trend.
This stacked alignment creates what technicians call a moving average fan — the visual spread of three lines moving in the same direction, confirming momentum is real and sustained.
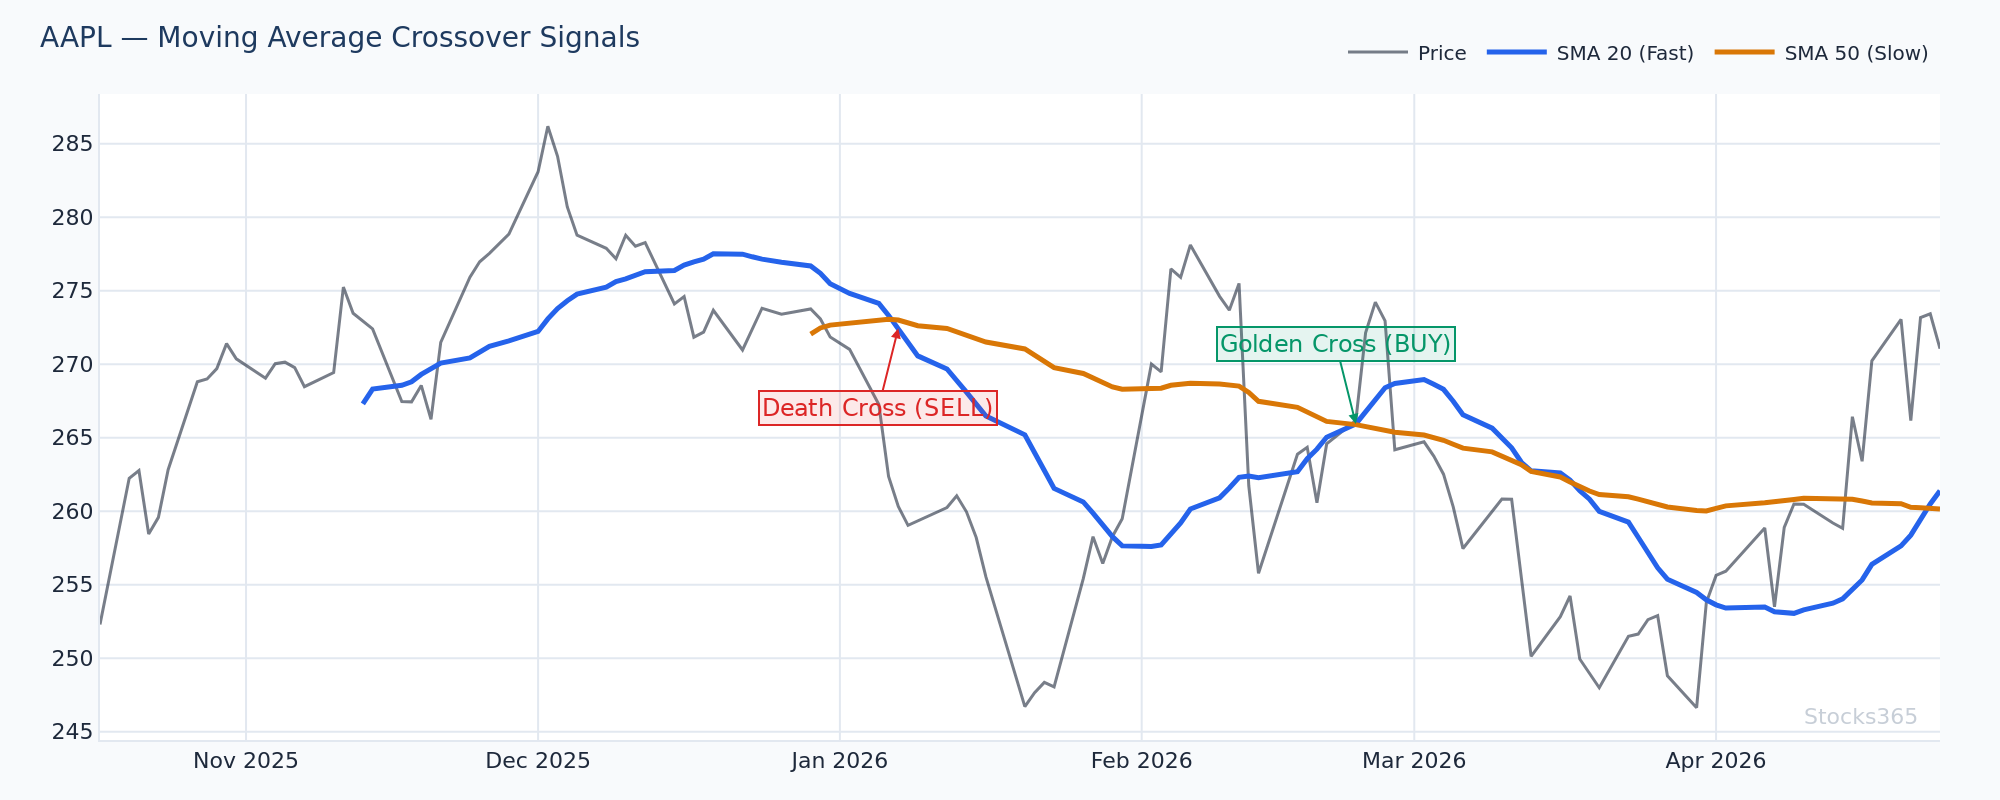
This chart shows all three moving averages fanning outward in bullish order, with price riding above all three. When this structure holds, pullbacks to the medium MA often represent the next entry opportunity rather than a reversal signal. Invalidation comes if price closes decisively below the slow (50-period) MA — that breaks the trend thesis entirely.
Why Three Moving Averages Beat Two
Two moving averages generate crossover signals. Three moving averages generate trend regime signals. That distinction is everything.
With a dual MA system, you get choppy whipsaws in sideways markets because every minor price swing triggers a crossover. Adding the third — slower — MA creates a regime filter. The trade only qualifies if the macro trend structure is already aligned. You sit out the noise. You capture the move.
Think of it this way: the fast MA tells you what's happening right now. The medium MA tells you the short-term direction. The slow MA tells you whether it's worth trading at all.
The Three Phases of a Triple MA Setup
Every clean triple MA trade moves through three recognizable phases:
- Compression: All three MAs converge and flatten — price is consolidating, trend is unclear, and no trade is active.
- Expansion: The fast MA breaks first, separating from the medium MA. Volume picks up. This is the signal candle zone.
- Confirmation: All three MAs align in bullish or bearish order, fanning outward. The trend is established. Pullbacks to the medium MA become entries.
Missing phase three means trading too early. Most retail losses happen in phase one — before the trend exists.
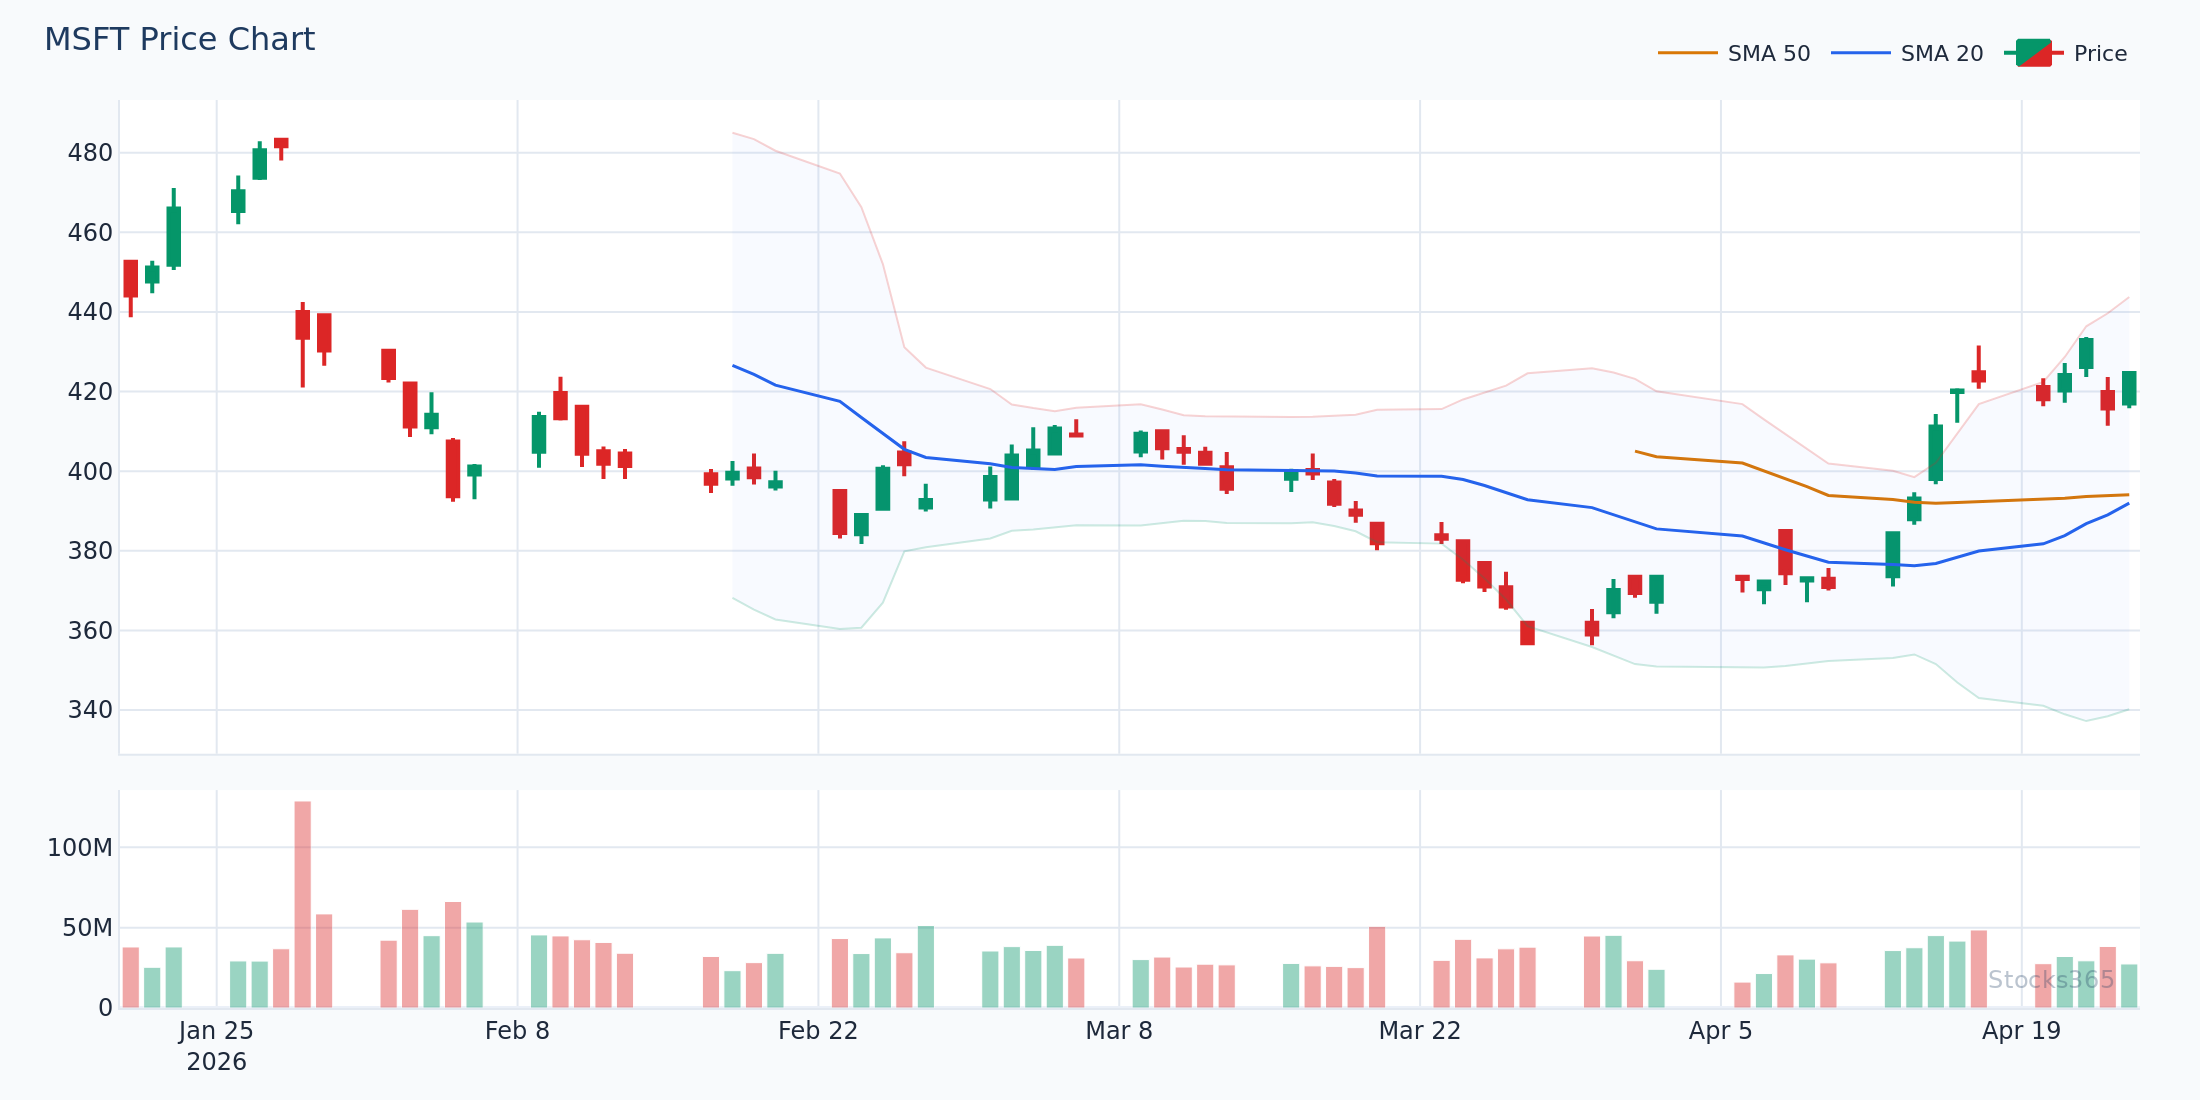
This chart captures the moment of expansion — price breaking cleanly above the convergence zone with all three MAs beginning to separate. The medium MA slope turning upward is the first structural confirmation. Watch for a pullback retest of the medium MA within the next 3-5 candles as the ideal entry trigger, not the initial breakout candle itself.
How to Configure the Triple Moving Average Strategy
Choosing Your MA Type: EMA vs SMA
Exponential moving averages (EMA) react faster to recent price changes. Simple moving averages (SMA) weight all data equally and are less reactive. For the triple MA strategy:
- Use EMAs on volatile assets like growth tech and crypto where fast reaction matters
- Use SMAs on slower-moving assets like blue chips and ETFs where smoothness prevents false signals
- Many experienced traders use a hybrid — EMA for fast and medium, SMA for slow — to combine responsiveness with trend stability
Best Period Combinations for Different Timeframes
The right periods depend on your holding window:
- Intraday (5-15 min charts): 8 / 21 / 55
- Swing trading (daily charts): 10 / 20 / 50 or 20 / 50 / 200
- Position trading (weekly charts): 13 / 34 / 89 (Fibonacci-based)
For most Stocks365 users trading the daily timeframe, the 10/20/50 EMA combination offers the strongest balance of signal frequency and accuracy.
Reading Triple MA Signals: Bullish and Bearish Setups
The Bullish Triple Stack Setup
The cleanest long entry in the triple moving average strategy:
- Price trades above all three MAs
- Fast MA > Medium MA > Slow MA (stacked in ascending order)
- Price pulls back to the medium (20-period) MA without breaking the slow MA
- A bullish reversal candle forms at the medium MA — hammer, engulfing, or pin bar
- Volume on the reversal candle exceeds the 20-period average volume
That pullback-to-medium-MA entry is the highest-probability version of this setup. You're buying into an established trend at a logical support level, not chasing a breakout at extended prices.
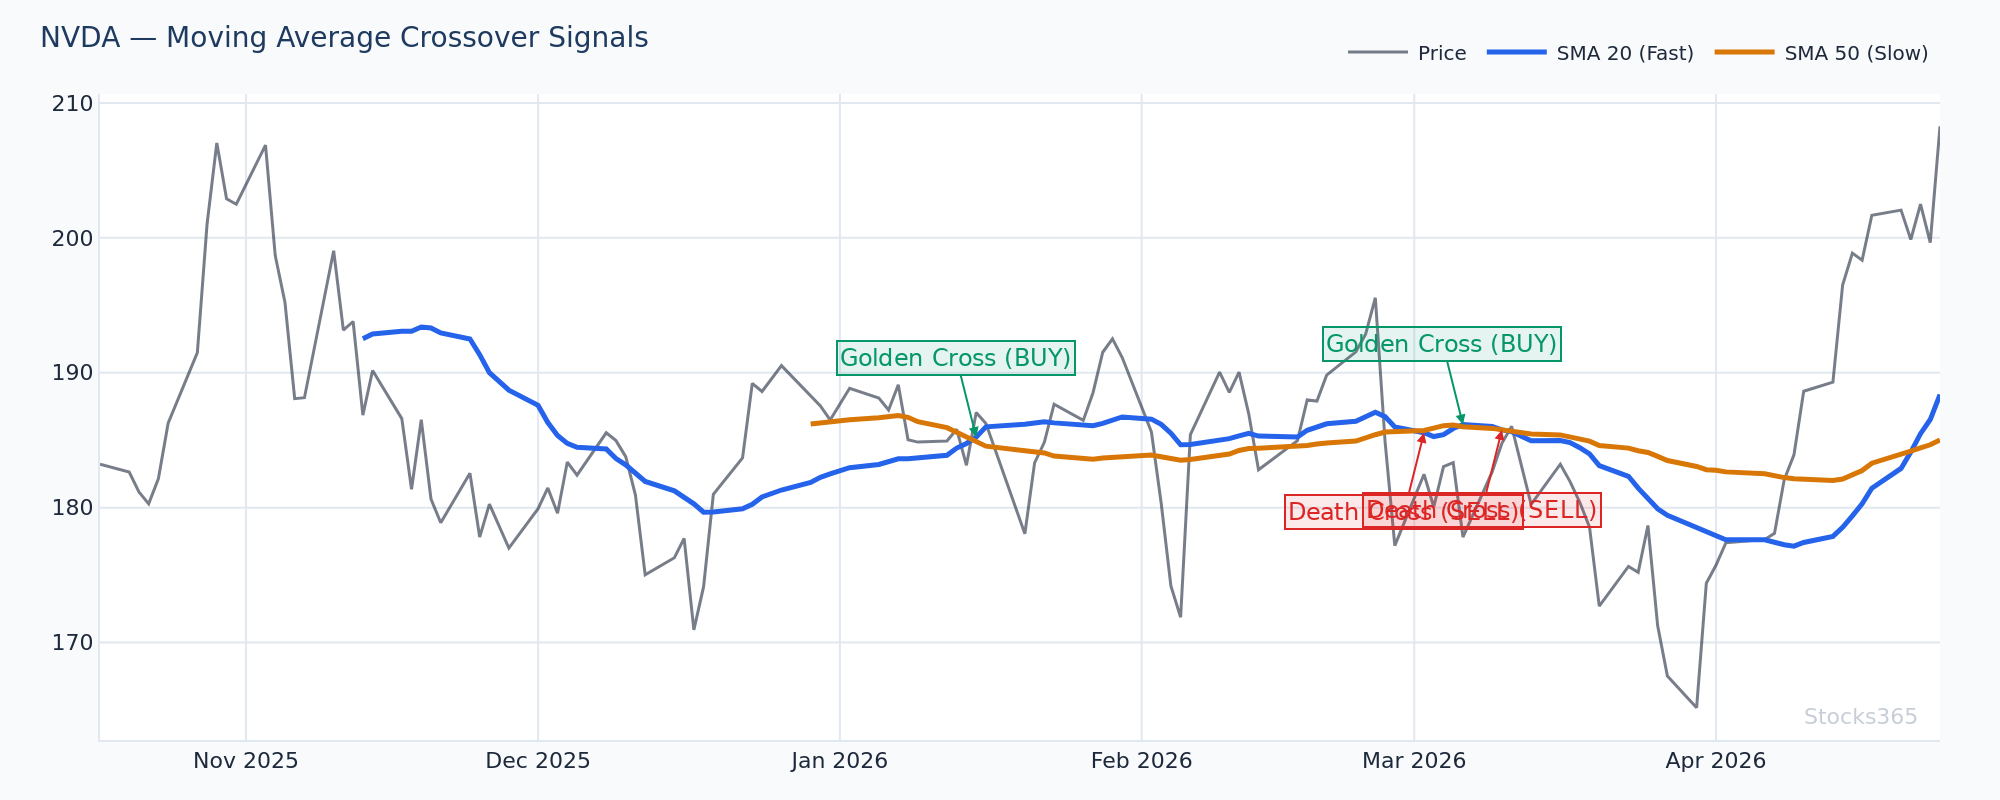
This chart highlights the pullback entry zone — price dipping to test the medium MA while the slow MA continues rising underneath. The fast MA briefly flattens but doesn't cross below the medium MA, which preserves the bullish structure. A failure here — meaning price closes below the slow MA — invalidates the setup and suggests the trend is transitioning, not pausing.
The Bearish Triple Stack Setup
Mirror logic applies on the short side:
- Price trades below all three MAs
- Fast MA < Medium MA < Slow MA (stacked in descending order)
- Price rallies to the medium MA without reclaiming the slow MA
- A bearish rejection candle forms at the medium MA
- Volume confirms selling pressure on the rejection candle
These bear stack bounces-to-resistance setups work particularly well during earnings-driven downtrends and sector rotations. The medium MA becomes resistance, not support — and the market repeatedly confirms it.
Here's What Most Traders Get Wrong
Most traders treat a triple MA crossover as an immediate entry signal — the moment the fast MA crosses the medium MA, they buy. That's backwards. The crossover is an alert, not a trigger. In choppy or low-momentum markets, crossovers whipsaw repeatedly, generating losses before the trend finally resolves. The real edge isn't the crossover — it's waiting for the subsequent pullback to the medium MA within an already-confirmed triple stack alignment. That second touch, after alignment is established, is where the reward-to-risk structure actually makes sense. Chase the crossover candle and you're buying at the worst price in the setup. Wait for the pullback and you're buying near the best one.
Combining the Triple MA Strategy With Momentum Indicators
Moving averages are trend-following tools — they lag price by definition. Pairing them with momentum oscillators closes that gap and dramatically improves entry timing.
Triple MA + RSI Filter
The RSI is the most effective filter for the triple MA strategy. The combination works like this:
- Triple MA alignment confirms trend direction
- RSI dropping below 40 on a bullish pullback signals temporary oversold conditions within the uptrend
- RSI recovering back above 40-50 while price holds above the medium MA = long entry trigger
This prevents buying into a pullback that becomes a full reversal. If RSI collapses below 30 and price breaks the slow MA simultaneously, the trend is failing — not pausing. For a complete breakdown of how RSI works as a filter, see our guide on how to use RSI in trading.
RSI period settings matter here too. The default 14-period RSI works for most daily chart setups, but shorter periods (9 or 10) respond better to fast-moving triple MA signals on intraday timeframes. Our RSI settings guide breaks down which periods work best by strategy type.
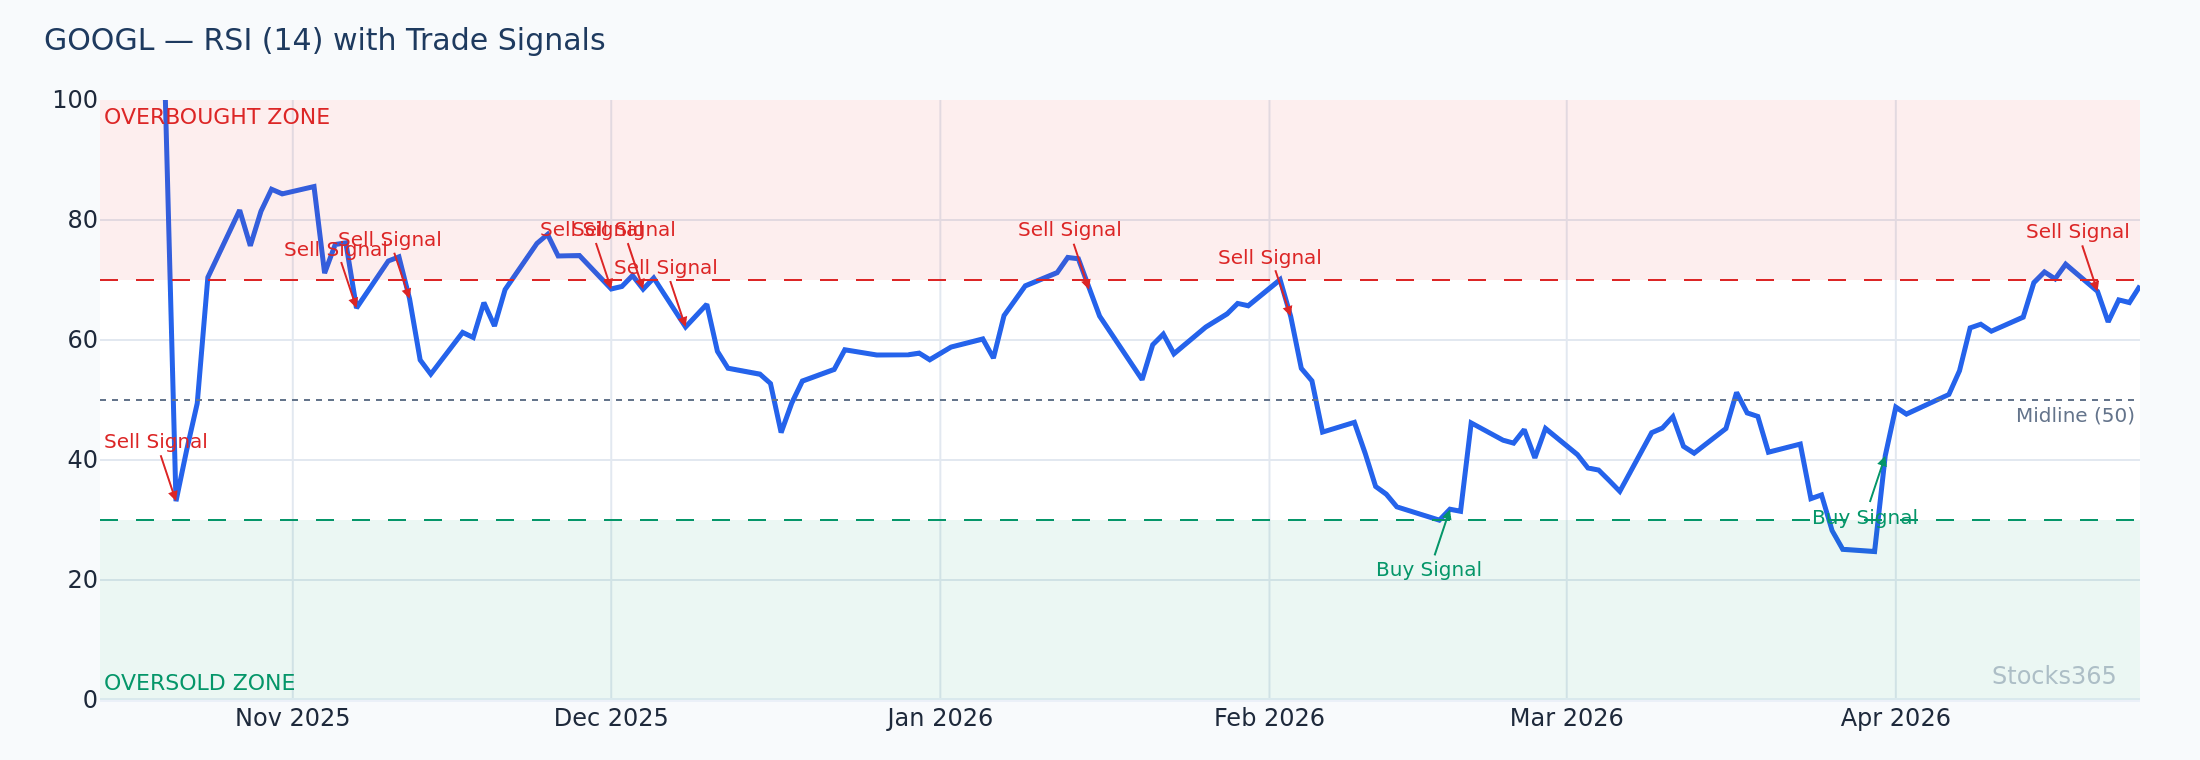
This chart pairs the RSI reading with the triple MA pullback zone — RSI dipping into the 35-45 range as price tests the medium MA, then recovering as the next leg higher begins. When RSI prints a higher low while price makes a higher low at the medium MA, that dual confirmation is one of the cleanest entry signals the combined system generates. If RSI breaks below 30 on this test, treat it as a warning that the pullback may extend further.
Triple MA + RSI Divergence
When RSI shows bullish divergence at a triple MA pullback entry — price makes a lower low but RSI makes a higher low — the signal strength increases significantly. This combination suggests the selling pressure driving the pullback is exhausting even as price dips. See RSI divergence explained for the full setup mechanics. For more advanced confirmation, hidden RSI divergence at these MA levels often precedes the sharpest trend continuation moves.
When the Triple Moving Average Strategy Works — and When It Fails
The triple MA strategy thrives in trending markets. It struggles in ranging ones. That's not a flaw — it's the nature of all trend-following systems. The key is knowing which environment you're operating in before entering a trade.
Our research dashboard analysis of 11,597 trend-following signals shows a clear asset class pattern: commodities consistently outperform other markets in trend-based setups, delivering a 54.8% win rate versus only 36.1% for crypto (n=11,597, ADX Trend + DI Long signals). This tracks with the triple MA strategy's behavior — commodity trends tend to be cleaner, more sustained, and less prone to the violent reversals that whipsaw MA systems in crypto markets.
Practical filters for identifying favorable environments:
- ADX above 25: Confirms trend strength is sufficient for MA alignment to be meaningful. Below 20, moving averages produce noise, not signals.
- Expanding price range: ATR increasing signals trending conditions. Contracting ATR signals consolidation — a triple MA crossover during low ATR is a trap.
- Sector momentum: Triple MA setups on stocks that lead their sector outperform isolated setups on laggards within weak sectors.
Crypto deserves special mention. The volatility in digital assets creates explosive MA expansions — but also explosive reversals that stop out long setups before they develop. If trading crypto with the triple MA strategy, use wider stops keyed to ATR rather than fixed percentage stops, and reduce position sizing to account for the elevated failure rate.
Position Sizing and Risk Management for Triple MA Trades
Clean signal. Wrong size. Still a losing trade.
For triple MA entries, structure risk around the slow MA level — the logical structural stop. If price closes below the slow (50-period) MA after your entry, the trend premise is broken and the trade is closed. This stop methodology keeps losses defined and avoids the common mistake of placing stops arbitrarily below entry price.
- Entry: Pullback to medium MA with reversal candle confirmation
- Stop: Close below the slow MA
- Target: Measure the distance from slow MA to medium MA, project that distance above entry — or trail using the medium MA as dynamic support
- Position size: Risk 1-2% of account on the stop distance
Trailing the position using the medium MA as a dynamic stop is particularly effective in strong trends — it keeps you in the move while the three-MA alignment holds, and exits automatically when the structure breaks.
Triple Moving Average Strategy Across Asset Classes
Equities
The daily chart 10/20/50 EMA setup performs best on liquid large-cap stocks and sector ETFs. The trend structures are cleaner, institutional participation is high, and the medium MA pullback entries are reliable. Check individual stock signals on Stocks365 — for example, the AAPL signal page shows current MA alignment and trend status updated in real time.
Commodities
As the backtested data confirms, commodities are the strongest environment for trend-following MA strategies. Energy, agricultural, and metals markets develop multi-week to multi-month trends that the triple MA system captures cleanly. Swing traders using weekly charts with the 13/34/89 EMA configuration find this asset class particularly productive.
Forex
Major pairs on the 4-hour and daily chart respond well to the 20/50/200 EMA combination. Forex trends can extend for months, making the trailing stop approach especially valuable. Avoid applying the triple MA strategy to highly correlated pairs simultaneously — position the strategy in the pair with the clearest trend structure only.
What to Watch For
- Triple MA fan breakouts on sector leaders after consolidation: When the three MAs compress tightly for 10+ bars then begin fanning outward on high relative volume, the expansion leg often runs 2-4 ATR before the first meaningful pullback — that first pullback to the medium MA is the entry, not the initial expansion.
- Bearish triple stack rejections at the medium MA during earnings-driven downtrends: After a stock gaps down on earnings and all three MAs flip bearish, the first rally back to the medium MA (typically 5-10 sessions later) historically fails and resumes the downtrend — watch for rejection candles with above-average volume at that level.
- RSI divergence at triple MA pullback zones: When price pulls back to the medium MA and prints a higher low while RSI simultaneously prints a higher low relative to the prior swing, that convergence of signals has historically produced the strongest continuation setups — especially in commodity trending markets.
- Triple MA compression in low-volatility environments: When all three MAs flatten within a tight band and ATR drops to the 20th percentile or below, prepare for a directional expansion. The direction is unclear until the fast MA breaks — but the magnitude of the move that follows compression events is typically larger than standard trend entries.
- Slow MA slope as the regime filter: When the 50-period MA slope turns flat or begins declining, downgrade all long signals generated by the faster MAs to lower conviction. Only trade the full setup when the slow MA is clearly rising (for longs) or clearly declining (for shorts).
How Stocks365 Uses This
Stocks365 Trust Score Integration
The triple moving average alignment is one of 12+ technical indicators embedded in the Stocks365 Trust Score system. Specifically, MA stack alignment contributes to the trend regime scoring layer — a component that evaluates whether a stock or asset is in a confirmed trending state before any momentum or mean-reversion signal is amplified or suppressed.
When the fast, medium, and slow MAs align in full bullish or bearish order on the daily chart, the Trust Score system upgrades the regime classification for that signal, increasing the weight given to momentum signals like RSI crosses and volume confirmation. Conversely, when MAs are flat or mixed — indicating a ranging market — the system automatically reduces conviction scores on trend-following entries to prevent false signal amplification.
You can view real-time Trust Score breakdowns and MA alignment data for individual stocks directly on the Stocks365 signals dashboard. Each signal page, like the AAPL signal, displays the current MA alignment status as part of the full technical scoring breakdown.
Key Takeaways
Triple Moving Average Strategy — Summary
- Stack three MAs (fast/medium/slow) to filter trades by trend regime, not just crossovers
- The bullish signal requires all three in ascending order; the bearish signal requires descending order
- Enter on pullbacks to the medium MA within confirmed alignment — not on the crossover candle itself
- Use the slow MA as your structural stop level — a close below it invalidates the trade
- Pair with RSI to improve entry timing and identify exhaustion within pullbacks
- Commodities offer the most favorable environment for this strategy; crypto requires extra caution
- ADX above 25 confirms trend strength is sufficient for MA alignment signals to carry conviction
- The Stocks365 Trust Score system uses MA alignment as a core regime filter across all signal types