
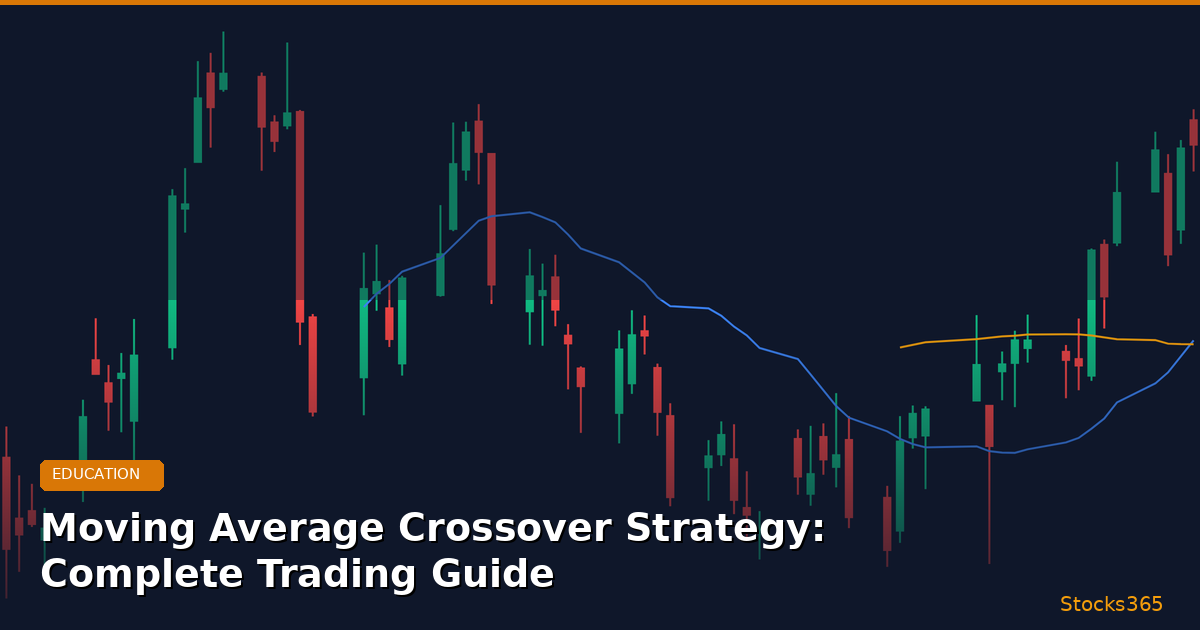
What Is the Moving Average Crossover Strategy?
The moving average crossover strategy is one of the most widely used technical trading methods in the world. It identifies momentum shifts by tracking when two moving averages of different periods cross each other — signaling potential trend changes before price confirms them.
Simple in concept. Powerful in practice — when used correctly.
When a shorter-period moving average crosses above a longer-period moving average, it's called a golden cross — a bullish signal. When the shorter crosses below the longer, it's a death cross — bearish. These crossovers act as triggers that many algorithmic systems, institutional desks, and retail traders monitor simultaneously, which is precisely why they often generate self-reinforcing momentum.
But there's more to this strategy than just waiting for two lines to intersect. The context, the asset class, the timeframe, and the surrounding indicators determine whether a crossover produces a genuine trend or a costly false signal.
Types of Moving Averages Used in Crossover Strategies
Not all moving averages behave the same. The type you choose directly affects signal timing and sensitivity.
Simple Moving Average (SMA)
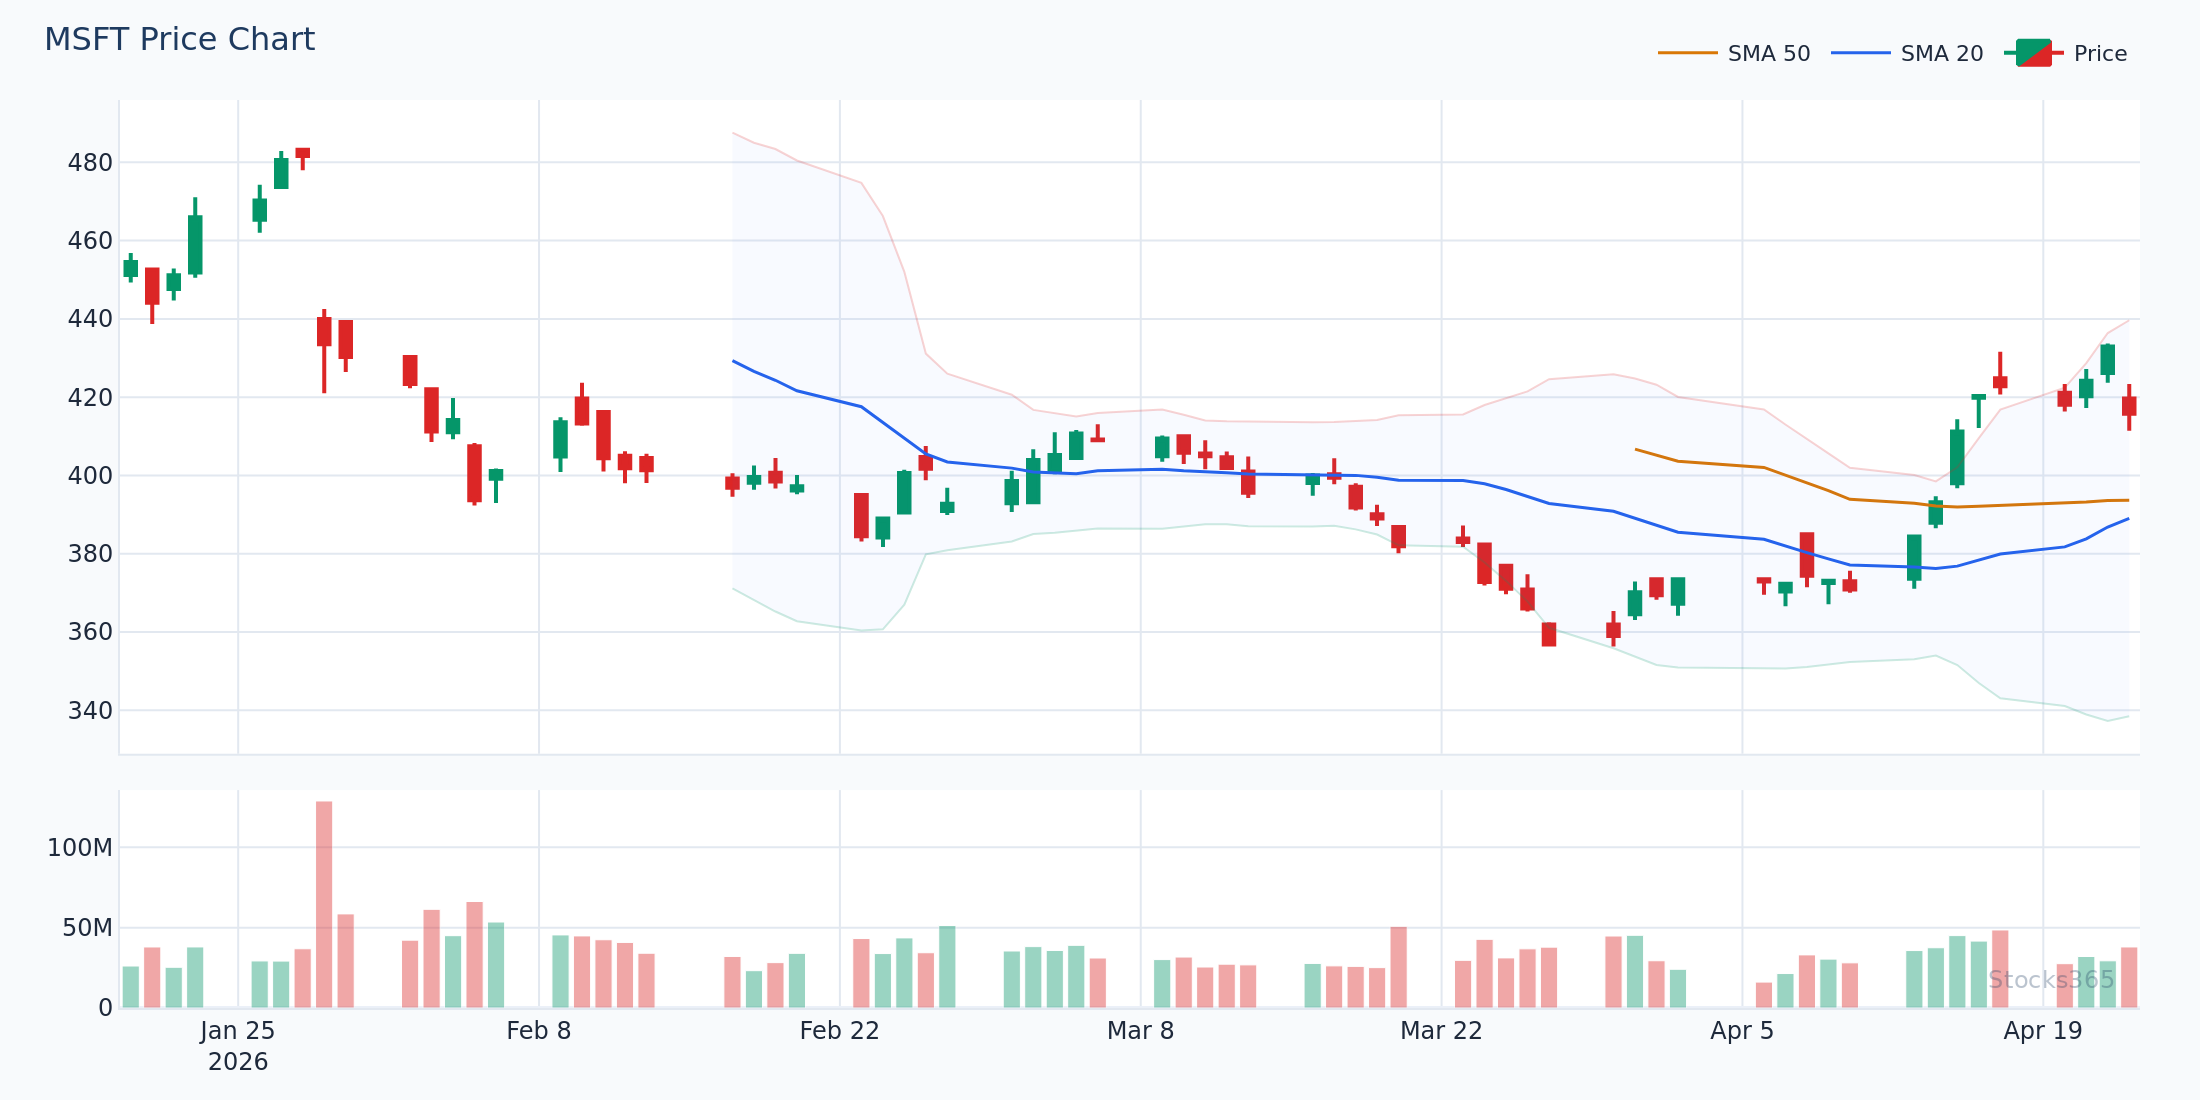
The SMA calculates the average closing price over a defined period. Equal weight is given to every candle in the window. The 50 SMA and 200 SMA are the most watched institutional levels. The 20 SMA is the baseline for shorter-term momentum traders.
Exponential Moving Average (EMA)
The EMA weights recent prices more heavily, making it more reactive to new price action. The 9 EMA and 21 EMA crossover is particularly popular among intraday and swing traders who need faster signals. The tradeoff: more responsiveness means more noise.
Weighted Moving Average (WMA)
The WMA assigns a linear weighting to each period, with the most recent data point weighted highest. It sits between the SMA and EMA in terms of responsiveness. Less commonly used but effective in specific volatility environments.
For most traders, the EMA crossover is the sharper tool. The SMA crossover is the steadier one.
The Most Popular Moving Average Crossover Setups
The 9/21 EMA Crossover (Short-Term Momentum)
This is the go-to setup for intraday and short-term swing traders. The 9 EMA responds rapidly to price changes while the 21 EMA provides the reference trend. When the 9 EMA crosses above the 21 EMA on rising volume, momentum is accelerating. The setup works best on the 15-minute, 1-hour, and 4-hour timeframes in trending market conditions.
This chart shows the 9 EMA crossing above the 21 EMA following a period of price consolidation, with volume confirming the move. Typically, when this crossover occurs with an expanding price range and volume above the 20-period average, the resulting trend run lasts 3–5 candles on the trigger timeframe. The setup is invalidated if price reverses back below the 21 EMA within two candles of the crossover.
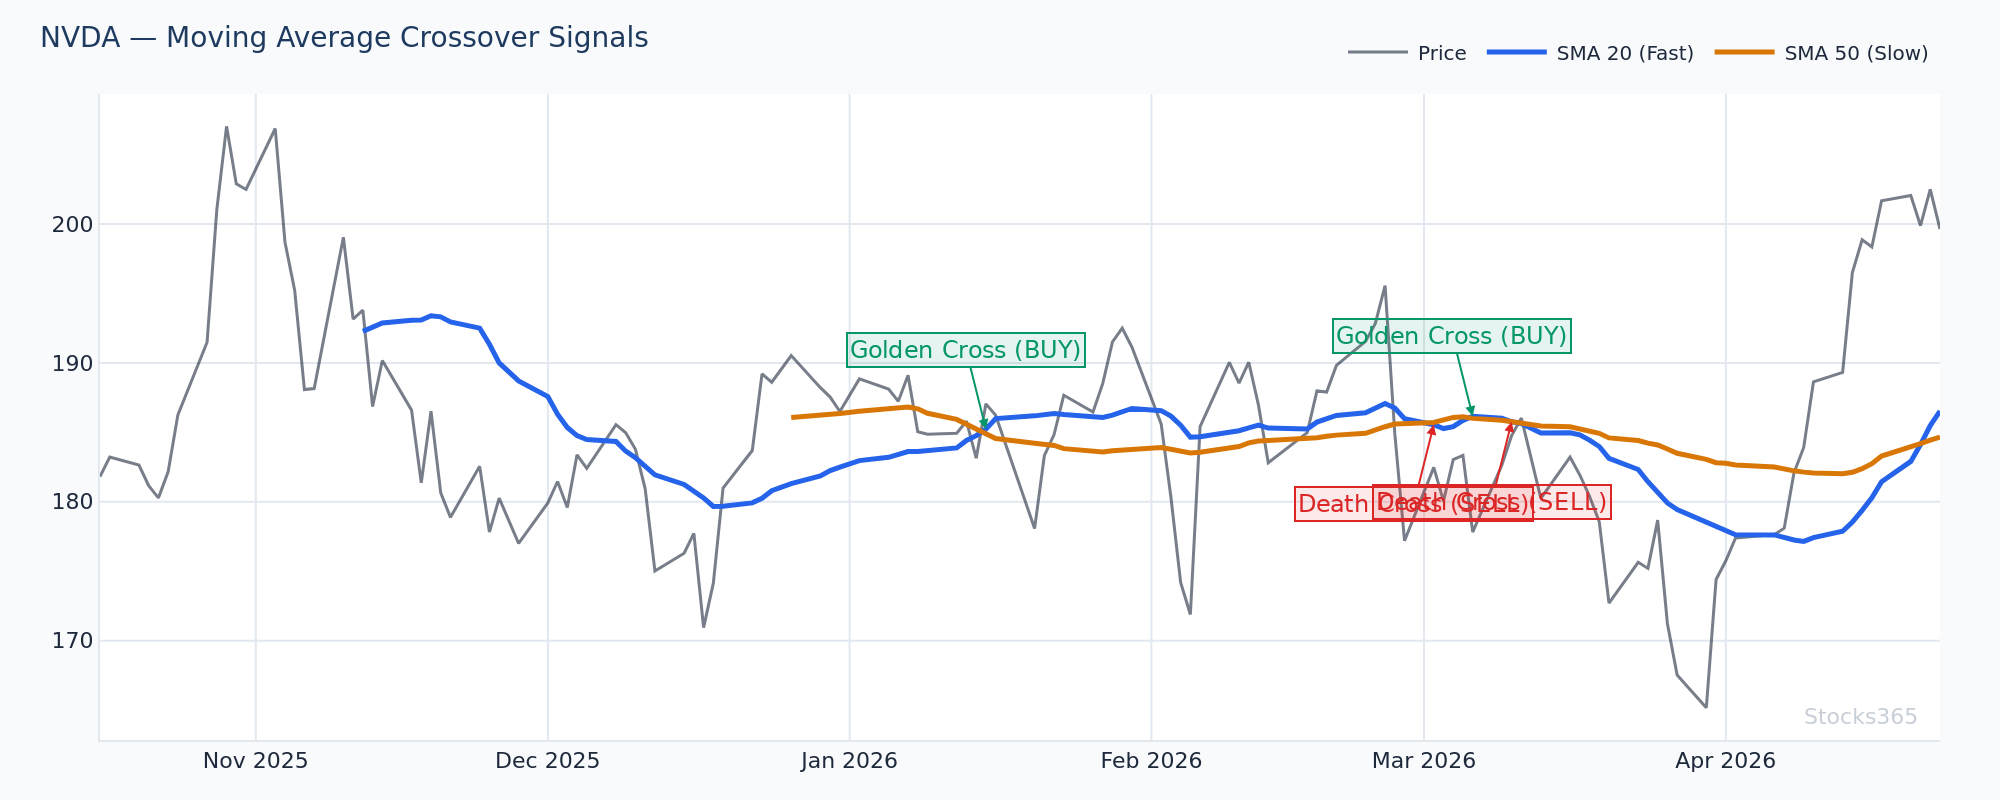
The 50/200 SMA Crossover (The Golden Cross)
This is the institutional-grade crossover. When the 50 SMA crosses above the 200 SMA on the daily chart, it signals a major structural shift in trend. Markets, funds, and algorithmic systems are conditioned to react to this crossover. It doesn't fire often — but when it does, the moves that follow are often substantial.
The death cross — 50 SMA crossing below the 200 SMA — carries equal weight on the bearish side. In bear markets, this crossover has preceded extended downtrends across equities, crypto, and commodities.
Here the 50 SMA crosses above the 200 SMA after a multi-week base-building phase. When price is already trading above both moving averages at the moment of crossover, the confirmation is stronger — the signal is leading, not lagging. If price is below the 200 SMA when the crossover occurs, the signal often produces a failed rally before true trend continuation.
The 20/50 SMA Crossover (Swing Trading Sweet Spot)
For swing traders operating on daily and weekly timeframes, the 20/50 SMA crossover offers a balanced signal — reactive enough to catch trends early, stable enough to filter out daily noise. This is the setup most consistent with swing trading holding periods of 5–15 days.
How to Trade Moving Average Crossovers: Step-by-Step
The crossover itself is the trigger — not the entire strategy. Here's how to structure a complete trade around it.
Step 1: Identify the Trend Regime
Before entering any crossover trade, determine whether the broader market is trending or ranging. Crossover strategies thrive in trending markets. In choppy, sideways conditions, they generate excessive whipsaws. Use the 200 SMA as your regime filter: if price is above the 200 SMA, only take bullish crossover signals. Below it, only take bearish.
Step 2: Wait for the Crossover Candle to Close
This is non-negotiable. Never enter on a crossover that hasn't confirmed with a closed candle. Price can dip below or recover above the crossover level within the same candle. Acting on an open candle signal is how traders get faked out repeatedly.
Step 3: Check Volume
Volume is the conviction meter. A crossover on declining volume is suspicious. A crossover accompanied by a volume surge — ideally 1.5x to 2x the 20-period average — confirms institutional participation. That participation is what sustains the move.
Step 4: Use a Confirming Indicator
The moving average crossover doesn't operate in isolation inside a professional trading framework. Pair it with the RSI indicator to measure momentum alignment. A bullish crossover with RSI rising above 50 is a much higher-probability setup than a crossover with RSI still below 50 and weakening. For a deeper understanding of how RSI levels interact with price setups, the guide on RSI overbought and oversold levels is essential reading.
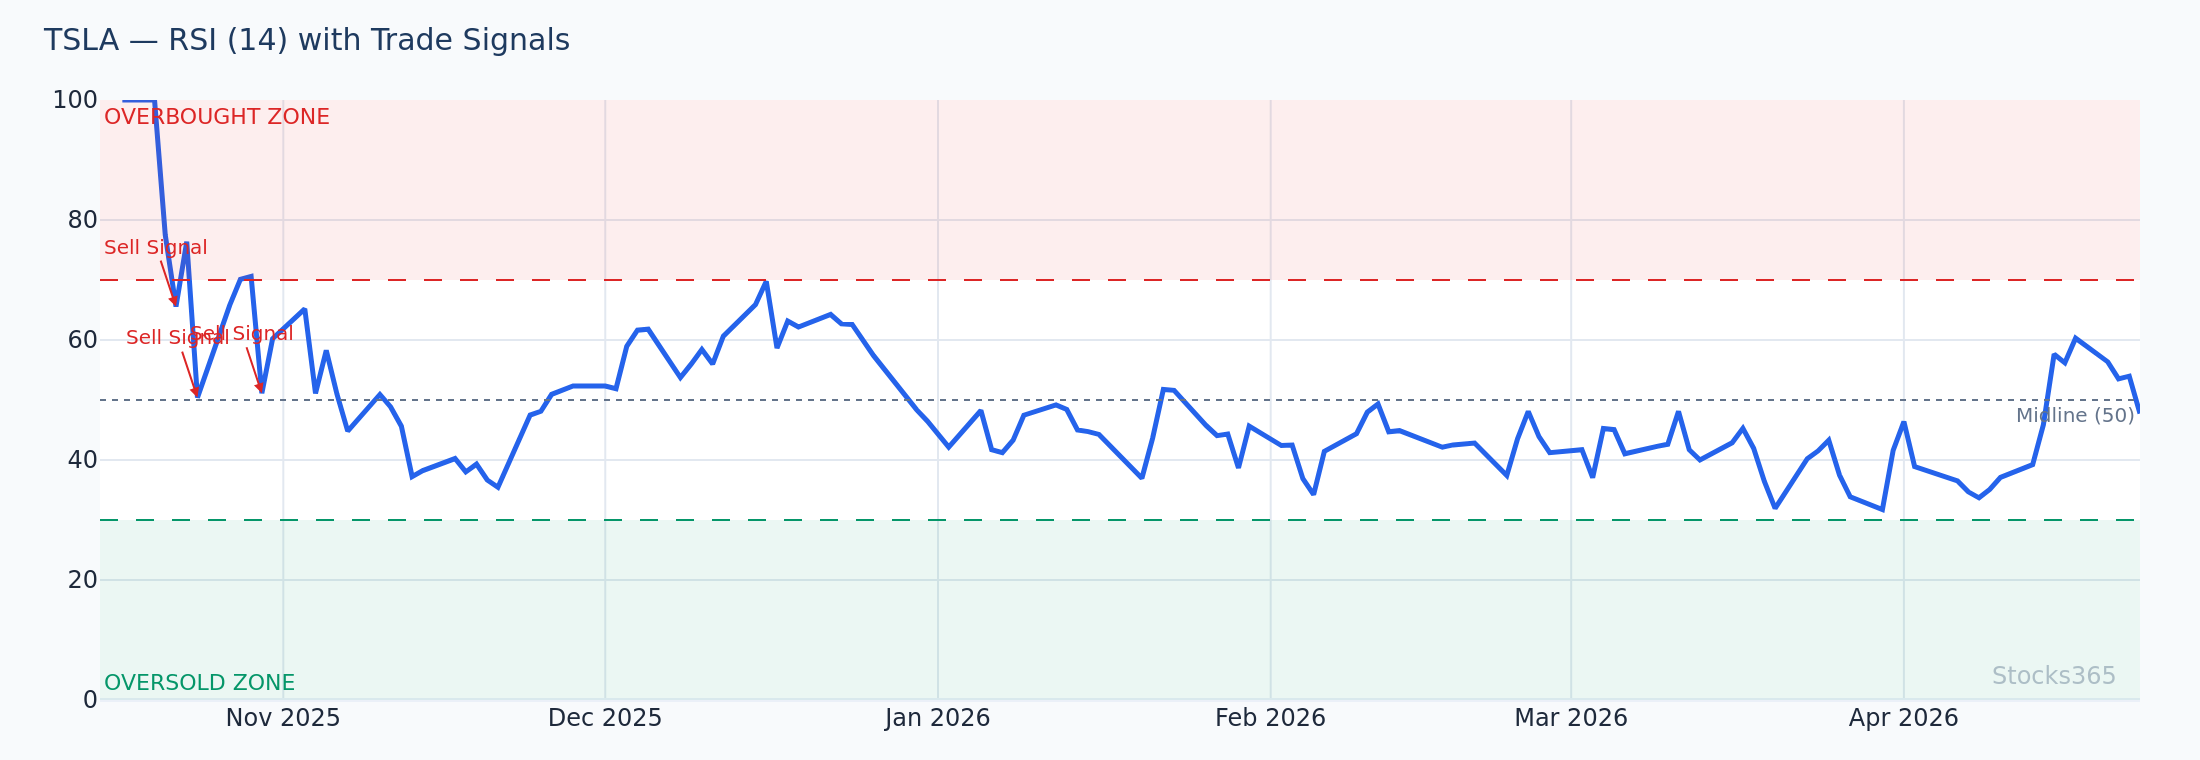
This chart shows RSI crossing above 50 at the same time the shorter EMA crosses above the longer EMA — a dual confirmation that momentum is genuinely shifting. When RSI is rising and both crossover conditions align, the probability of follow-through increases meaningfully. If RSI diverges from the crossover signal — for example, showing bearish divergence while the MA crossover turns bullish — that's a red flag worth acting on. Understanding RSI divergence can save you from entering a trap setup.
Step 5: Define Your Risk
Place your stop below the longer moving average (for bullish setups). This is the structural anchor. If price breaks back below it convincingly, the crossover has failed — exit and reassess.
Here's What Most Traders Get Wrong
Most traders treat every moving average crossover as an automatic entry signal. They see the lines cross, they enter — and they get chopped to pieces in a sideways market. The crossover is a condition, not a standalone strategy. The real edge is in crossovers that occur after a consolidation phase, as price breaks out of a defined range with expanding volatility. A crossover within a range is noise. A crossover that breaks the range is a signal. The difference between these two scenarios is everything.
Moving Average Crossover Performance by Asset Class
Not all assets respond equally to moving average crossover signals. This is a critical nuance that separates profitable practitioners from frustrated ones.
Our analysis of 3,332 signals where price crosses below the 20 SMA shows a 50.9% win rate (profit factor: 1.06) across a 10-day holding period — with crypto leading at 66.8% win rate and forex trailing at just 42.5%. This means the same crossover pattern that works reliably in crypto can be consistently unprofitable in forex markets. Asset class selection isn't optional — it's core to the strategy. See the full dataset at Stocks365 Insights.
Crypto trends with intensity. Forex chops relentlessly. Calibrate accordingly.
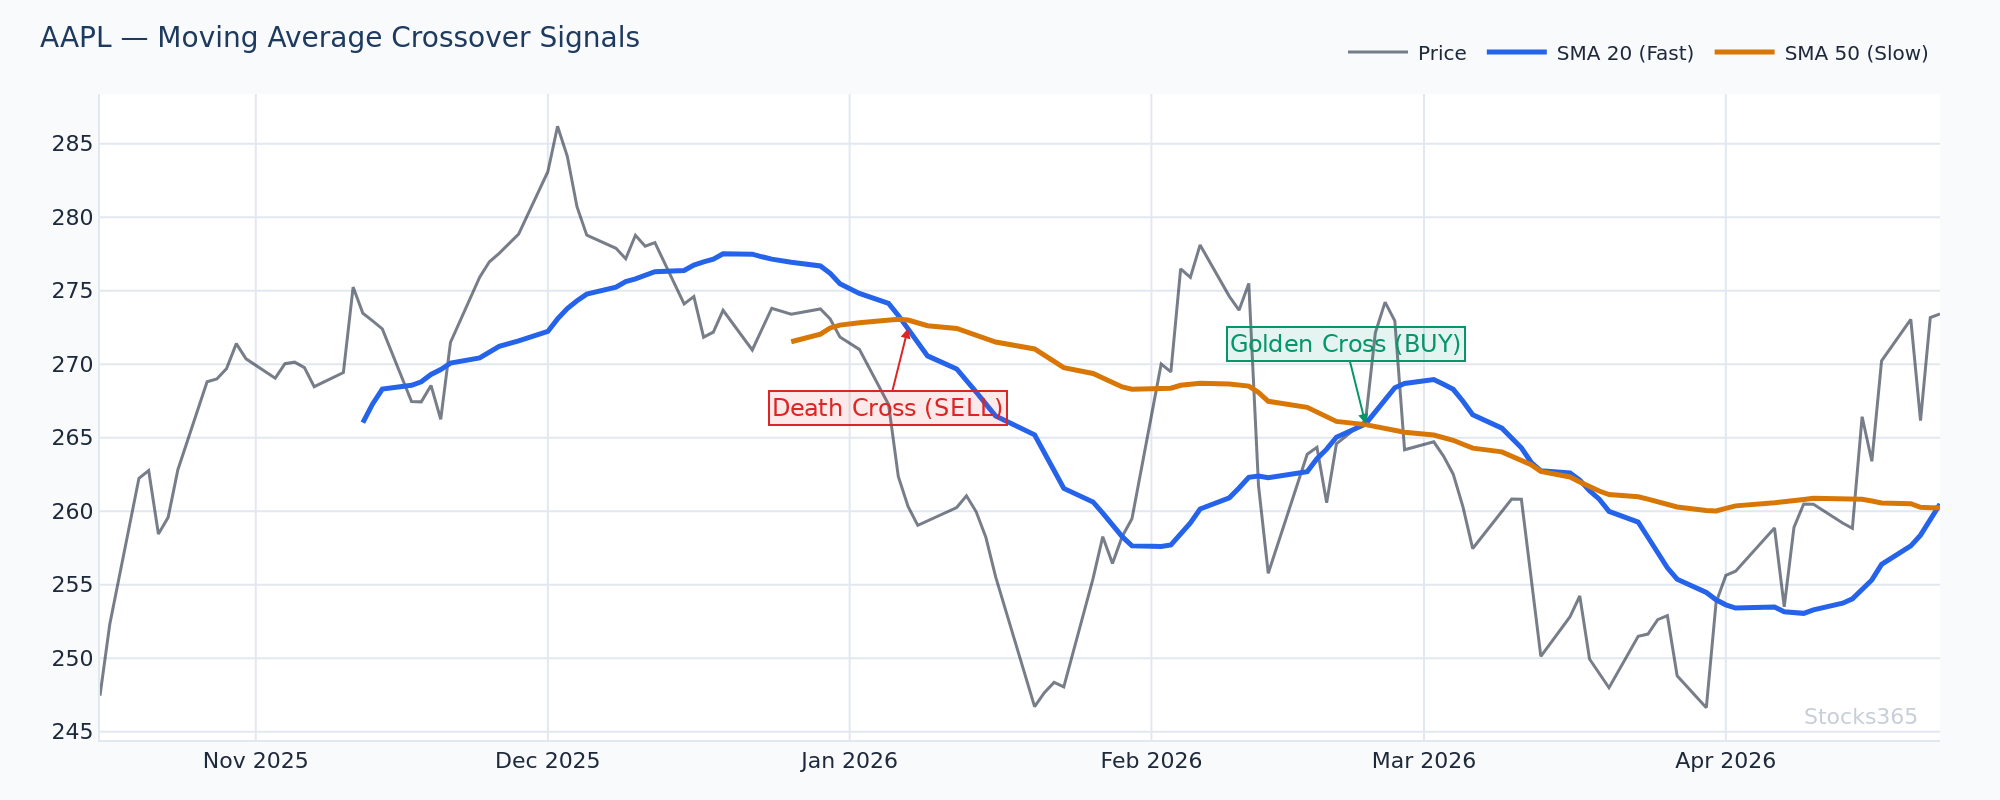
For equities specifically, trending large-cap stocks offer some of the cleanest crossover setups. When a stock has been basing for several weeks, volume is contracting, and the moving averages are converging — the resulting crossover often produces a high-quality directional move. Check live setups on stocks like AAPL to see these patterns as they develop in real time.
This chart displays price action with both the 20 and 50 SMA overlaid. The consolidation phase — where the two SMAs converge and price compresses — is clearly visible before the crossover event. When the candlestick pattern shows higher lows approaching the crossover point, the probability of a clean breakout increases. The setup breaks down if price gaps below the 50 SMA on high volume before the crossover completes.
Timeframe Selection for Moving Average Crossovers
Daily Chart — The Backbone
For swing traders and position traders, the daily chart is the primary timeframe for crossover signals. The signals are cleaner, the noise is filtered, and the moves that follow tend to have more room to develop. The 20/50 and 50/200 crossovers on the daily chart are the most widely monitored setups in professional trading environments.
4-Hour Chart — Swing Precision
The 4-hour chart offers a middle ground: faster than daily, slower than intraday. The 9/21 EMA crossover on this timeframe is particularly effective during trending market phases. It allows traders to catch intraweek momentum shifts without the excessive noise of 1-hour or 15-minute charts.
Intraday (15-Minute / 1-Hour) — Active Trading
Intraday crossover trading requires strict discipline. False signals are common. The 9/21 EMA crossover works on these timeframes during high-volume sessions — particularly around market open and during macro catalyst events. Outside of trending conditions, intraday crossovers are a trap.
Combining Moving Average Crossovers with Other Indicators
The strongest trades come from confluence — multiple indicators pointing in the same direction simultaneously.
- RSI + MA Crossover: A bullish crossover paired with RSI rising above 50 is a high-conviction setup. If you're unfamiliar with how RSI is constructed and why its levels matter, start with the complete RSI beginner's guide.
- Volume + MA Crossover: Volume confirmation transforms a theoretical signal into a tradeable one. No volume, no conviction.
- MACD + MA Crossover: When the MACD histogram turns positive at the same time a bullish MA crossover fires, momentum is confirmed on two independent indicators.
- Stochastic Oscillator + MA Crossover: The stochastic can identify whether the crossover is occurring in overbought or oversold territory. For a detailed comparison of how RSI and Stochastic differ in practice, the RSI vs Stochastic Oscillator guide is worth reading before building a combined system.
- Bollinger Bands + MA Crossover: A crossover that coincides with a Bollinger Band squeeze breakout — where band width expands after an extended contraction — is one of the highest-probability setups available.
Confluence isn't about adding indicators until something confirms. It's about finding independent signals that agree.
Common Moving Average Crossover Mistakes
Chasing Crossovers in Ranging Markets
A ranging market will generate crossover after crossover — each one a small loss. Before entering, step back to the higher timeframe. If the daily chart shows a range, the 4-hour crossovers are garbage signals.
Using the Wrong Period for the Asset
Default settings are starting points, not gospel. The optimal moving average periods vary by asset volatility and typical trend duration. Crypto assets often respond better to shorter periods (9/21 EMA) while blue-chip equities produce cleaner signals on longer periods (20/50 SMA). Fine-tuning period settings matters — the same principle applies when selecting RSI settings for different market conditions.
Ignoring the Macro Environment
Crossover signals in a risk-off environment with deteriorating breadth have a much lower probability of follow-through. Macro context isn't noise — it's signal.
Over-relying on the Signal Without Understanding the Math
Stocks365 research across 3,289 signals for price crossing above the 20 SMA shows only a 48.3% win rate (profit factor: 0.88) — with stocks performing best at 52.3% but crypto underperforming at just 36.9%. Knowing this, position sizing and risk management become even more critical than signal selection. Explore the complete breakdown at Stocks365 Insights.
Advanced Technique: The Crossover Pullback Entry
Entering directly on the crossover candle is the least precise method. The pullback entry is better. After a bullish crossover fires, price often pulls back to test the crossover zone — the area where the two MAs intersected. This retest provides a lower-risk entry with a tighter stop and better risk-reward ratio. Wait for the retest candle to show rejection (a bullish hammer, engulfing candle, or pin bar), then enter on the close or the break of that candle's high. This approach filters out weak crossovers — genuinely strong signals hold above the crossover zone on the retest.
Patience at this stage separates traders who consistently profit from those who consistently chase.
For traders who want to build even more precise entry timing, understanding hidden RSI divergence at the pullback point can identify high-probability continuation entries that most participants completely miss.
What to Watch For
- EMA convergence before breakout: When the 9 and 21 EMA compress tightly together over 5–10 candles while price consolidates, the resulting crossover after that squeeze typically produces a clean, sustained directional move of 2–3 ATR. This is the setup worth waiting for.
- Golden cross on above-average volume: A 50/200 SMA golden cross on the daily chart accompanied by volume that exceeds the 20-day average by at least 50% signals institutional rotation into the position — a much higher-conviction setup than a low-volume crossover.
- Crossover + RSI above 50 alignment in trending markets: When a bullish MA crossover fires at the same time RSI crosses above 50 from below, and price is above the 200 SMA, the three-condition confluence has historically produced follow-through far more consistently than any single condition alone.
- Failed crossovers as reversal signals: When a bullish crossover fires but price immediately reverses back through both MAs on high volume within two candles, that failed crossover becomes a bearish signal in its own right — a bull trap to trade against.
- Crypto crossovers after extended consolidation: In crypto markets, MA crossovers that emerge after 3–4 weeks of sideways price action — where the ATR has contracted significantly — tend to produce outsized momentum moves. The volatility compression followed by crossover is a setup worth monitoring on the Stocks365 signals dashboard.
How Stocks365 Uses This
Stocks365 Trust Score Integration
Moving average crossovers are one of 12+ technical indicators embedded in the Stocks365 Trust Score system. When a crossover signal fires on a monitored instrument, it contributes to the trend agreement component of the Trust Score — which measures how many independent indicators are aligned in the same directional bias. A bullish crossover paired with momentum and volume confirmation pushes the Trust Score higher, reflecting stronger multi-indicator consensus. The system weights crossover signals differently by asset class and timeframe, consistent with the performance data showing crypto and equities respond more reliably than forex to SMA-based signals. You can see Trust Scores and live crossover signals for individual instruments on the Stocks365 dashboard, including live setups like AAPL where crossover conditions are tracked in real time.
Key Takeaways
- The moving average crossover strategy identifies trend changes using two MAs of different periods — the shorter crossing the longer signals momentum shifts.
- EMA crossovers (9/21) are faster and suited to swing and intraday trading; SMA crossovers (50/200) are more robust for positional and institutional-level trend identification.
- Always confirm crossovers with volume, RSI alignment, and the broader trend regime — the crossover alone is not a complete strategy.
- Asset class matters: crossover signals perform differently across crypto, equities, and forex — calibrate your expectations accordingly.
- The pullback entry after an initial crossover typically offers better risk-reward than chasing the breakout candle directly.
- Failed crossovers (bull traps and bear traps) are high-probability reversal setups in their own right — learn to recognize and trade them.
- Stocks365 integrates MA crossover signals into its Trust Score system as part of the trend agreement layer, available live on the signals dashboard.