
MACD Forex Strategy: The Complete Guide to Currency Pair Trading
The Moving Average Convergence Divergence indicator — better known as MACD — remains one of the most powerful and widely-used tools in a forex trader's arsenal. Whether you're scalping the EUR/USD on a five-minute chart or swing trading GBP/JPY over several weeks, a well-executed MACD forex strategy can dramatically sharpen your entries, exits, and overall market timing.
In this comprehensive guide, we'll break down exactly how MACD works in currency markets, which pairs respond best to MACD signals, and how to build high-probability trade setups that professional traders rely on in 2026's dynamic forex environment.
- MACD measures momentum by comparing two exponential moving averages — making it ideal for trending forex pairs
- The EUR/USD, GBP/USD, and USD/JPY respond exceptionally well to MACD-based strategies
- Combining MACD crossovers with histogram divergence dramatically improves signal accuracy
- Pairing MACD with RSI creates a multi-confirmation approach that filters out false signals
- Session timing is critical — MACD signals fired during peak liquidity hours carry significantly more weight
- The Stocks365 trust score can help validate which MACD signals align with broader institutional momentum
What Is MACD and Why Does It Excel in Forex Markets?
Developed by Gerald Appel in the late 1970s, MACD consists of three core components:
- MACD Line: The difference between the 12-period and 26-period exponential moving averages (EMAs)
- Signal Line: A 9-period EMA of the MACD line itself
- Histogram: The visual difference between the MACD line and the signal line
Forex markets are uniquely well-suited to MACD for several reasons. Currency pairs trend more consistently than individual stocks — central bank policy cycles, interest rate differentials, and macroeconomic themes create sustained directional moves that MACD is designed to capture. When the European Central Bank and the Federal Reserve are moving in opposite directions on monetary policy, for example, the EUR/USD will often trend for weeks or months — exactly the environment where MACD shines.
Unlike oscillators that simply measure overbought or oversold conditions, MACD captures both trend direction and momentum strength simultaneously — a dual advantage that makes it particularly valuable in the 24-hour forex market where conditions can shift quickly across sessions.
The Best Currency Pairs for MACD Forex Strategies
Not all currency pairs respond equally to MACD signals. The following pairs have historically produced the cleanest MACD setups due to their liquidity, trending tendencies, and tight spreads.
EUR/USD — The King of MACD Forex Setups
The EUR/USD is the most liquid currency pair in the world, trading over $1.2 trillion in daily volume. This liquidity means price action is cleaner, false breakouts are rarer, and MACD crossovers tend to be more reliable. The pair's sensitivity to US and European economic data creates defined trending environments that MACD captures beautifully.
Practical example: In early 2026, EUR/USD was trading around 1.0850 when the MACD line crossed above the signal line on the daily chart while the histogram shifted from red to green bars. A long entry at 1.0870 with a stop below 1.0790 (the most recent swing low) would have captured a move to 1.1020 — a reward-to-risk ratio exceeding 2:1.
GBP/JPY — High Volatility MACD Opportunities
GBP/JPY is known as the "dragon" among forex traders for its explosive volatility. While this makes it riskier, MACD on the 4-hour chart can identify momentum shifts early in major moves. The pair's wide daily range means MACD-driven setups often deliver larger pip returns. Position sizing must be reduced proportionally to manage risk effectively.
USD/JPY — Clean Trending Structure
USD/JPY tends to respect technical levels and trend smoothly — ideal conditions for MACD. The pair's close relationship with US Treasury yields creates fundamental catalysts that align with technical momentum, giving MACD signals additional confirmation weight when macroeconomic themes are in play.
GBP/USD — Strong Momentum Swings
Cable (GBP/USD) produces well-defined MACD divergences and crisp histogram patterns, particularly on the 1-hour and 4-hour timeframes. UK economic data surprises and Bank of England policy decisions regularly create the momentum shifts that MACD is designed to detect early.
Core MACD Forex Strategy: The Crossover Method
The MACD crossover is the foundational signal every forex trader should master before advancing to more complex setups.
Bullish MACD Crossover Setup
A bullish crossover occurs when the MACD line crosses above the signal line. For a high-probability setup, look for the following confluence:
- The crossover occurs below the zero line (confirming the pair was in oversold momentum territory)
- The histogram bars are growing in size — confirming accelerating upward momentum
- Price is above a key moving average (such as the 50-period EMA on your trading timeframe)
- The crossover aligns with a support level or a bullish candlestick pattern (engulfing, morning star)
Entry: Enter long on the candle close after the confirmed crossover. Stop loss: Below the most recent significant swing low. Take profit: At the next major resistance level, or exit when MACD crosses back below the signal line.
Bearish MACD Crossover Setup
Mirror the bullish logic for short trades: the MACD line crossing below the signal line above the zero line, with shrinking histogram bars and price breaking below a key EMA. Always wait for candle confirmation before entering — many false crossovers reverse within a candle or two.
Advanced MACD Forex Strategy: Histogram Divergence
While crossovers are powerful, MACD histogram divergence is arguably the most sophisticated — and most profitable — signal the indicator produces. This technique looks for disagreements between price action and MACD momentum, which often precede significant reversals or trend continuations.
Bearish Regular Divergence on EUR/USD
Regular bearish divergence occurs when price makes a higher high while the MACD histogram makes a lower high. This indicates that bullish momentum is weakening even as price continues to push higher — a classic reversal warning.
Real-world setup: EUR/USD climbs from 1.0900 to 1.1050, forming a new high. However, the MACD histogram on the 4-hour chart peaks at a lower level than it did during the move from 1.0900. This divergence suggests the bulls are running out of steam. A short entry at 1.1035 (after a bearish engulfing candle confirms), with a stop above 1.1060 and target at 1.0930, delivers a clean 4:1 reward-to-risk setup.
Bullish Hidden Divergence for Trend Continuation
Hidden divergence is a more nuanced concept — and arguably more valuable because it signals trend continuation rather than reversal. In an uptrend, hidden bullish divergence occurs when price makes a higher low while MACD makes a lower low. This pattern confirms the trend is intact and pullback traders should look for long re-entries.
This concept is closely related to what RSI traders use for confirmation — if you want to deepen your understanding of divergence signals, our detailed guide on Hidden RSI Divergence: The Advanced Signal Most Traders Miss explains the underlying mechanics in exceptional detail.
Combining MACD with RSI for Higher-Accuracy Forex Signals
One of the most battle-tested approaches in professional forex trading is combining MACD with the Relative Strength Index (RSI). While MACD identifies trend direction and momentum, RSI measures overbought and oversold conditions — together, they create a multi-confirmation framework that dramatically reduces false signals.
The MACD + RSI Dual Confirmation Method
Here's how to implement this strategy on a currency pair like USD/JPY:
- Step 1: Identify a bullish MACD crossover on the 4-hour chart
- Step 2: Confirm that RSI is between 40-60 (not overbought) and rising — ideally coming off a bounce from the 30-40 zone
- Step 3: Look for a bullish RSI divergence to further validate momentum shift (price lower low, RSI higher low)
- Step 4: Enter long on the next candle open with a stop below the swing low
- Step 5: Exit when MACD crosses bearish OR RSI reaches overbought territory above 70
For traders who want to build mastery of RSI-based signals, our comprehensive resource RSI Divergence Explained: Master Bullish & Bearish Signals provides the foundational knowledge that pairs perfectly with MACD divergence analysis.
Understanding how RSI is mathematically constructed also helps you interpret its signals more confidently. Our technical breakdown at How RSI Is Calculated: Formula Explained Step by Step demystifies the math behind the indicator without requiring a degree in statistics.
MACD Forex Strategy by Timeframe
One of the most common mistakes forex traders make is applying MACD signals without considering the appropriate timeframe for their trading style. Here's a practical breakdown:
Scalping (1-Minute to 15-Minute Charts)
For scalpers, MACD works best on the 5-minute or 15-minute chart during peak liquidity sessions — the London open (08:00-10:00 GMT) and the New York-London overlap (13:00-17:00 GMT). Use a faster MACD setting such as (5, 13, 6) instead of the standard (12, 26, 9) to reduce signal lag. Scalping MACD crossovers on EUR/USD during these windows, with a 5-pip stop and 10-pip target, can produce consistent results when the pair has a clear intraday trend.
Day Trading (1-Hour to 4-Hour Charts)
The 4-hour chart is the sweet spot for day traders using MACD. It filters out the noise of lower timeframes while still providing multiple signals per week. The standard (12, 26, 9) MACD settings work well here. Focus on pairs that have a clear daily trend — use the daily chart MACD for direction, and the 4-hour chart for entry timing (a top-down analysis approach).
Swing Trading (Daily and Weekly Charts)
Swing traders benefit most from MACD on the daily chart. Signals here carry the most weight — a daily MACD crossover on GBP/USD often precedes multi-day to multi-week moves. The key is patience: wait for the full candle close before acting on any signal, and use wider stops to accommodate daily volatility. Combining daily MACD signals with weekly trend direction provides the highest-quality swing setups.
MACD Forex Strategy: Session-Based Considerations
The forex market operates 24 hours a day, but not all hours are created equal. MACD signals generated during low-liquidity periods — such as the Asian session on European or Dollar pairs — are significantly less reliable than those fired during peak London or New York trading hours.
"A MACD crossover on EUR/USD at 3am GMT during the Asian session may simply reflect thin liquidity noise, not a genuine momentum shift. The same signal at 9am London open carries substantially more weight."
The best practice is to mark your trading session windows on your chart and only act on MACD signals that initiate or confirm during active trading hours for the relevant currency pair's home markets.
Using Stocks365 to Validate Your MACD Forex Signals
While MACD is a powerful standalone tool, professional traders in 2026 are increasingly integrating algorithmic signal validation into their workflow. The Stocks365 signals dashboard aggregates momentum data, trend strength scores, and institutional-grade analytics that can serve as a powerful cross-reference for your MACD-generated forex signals.
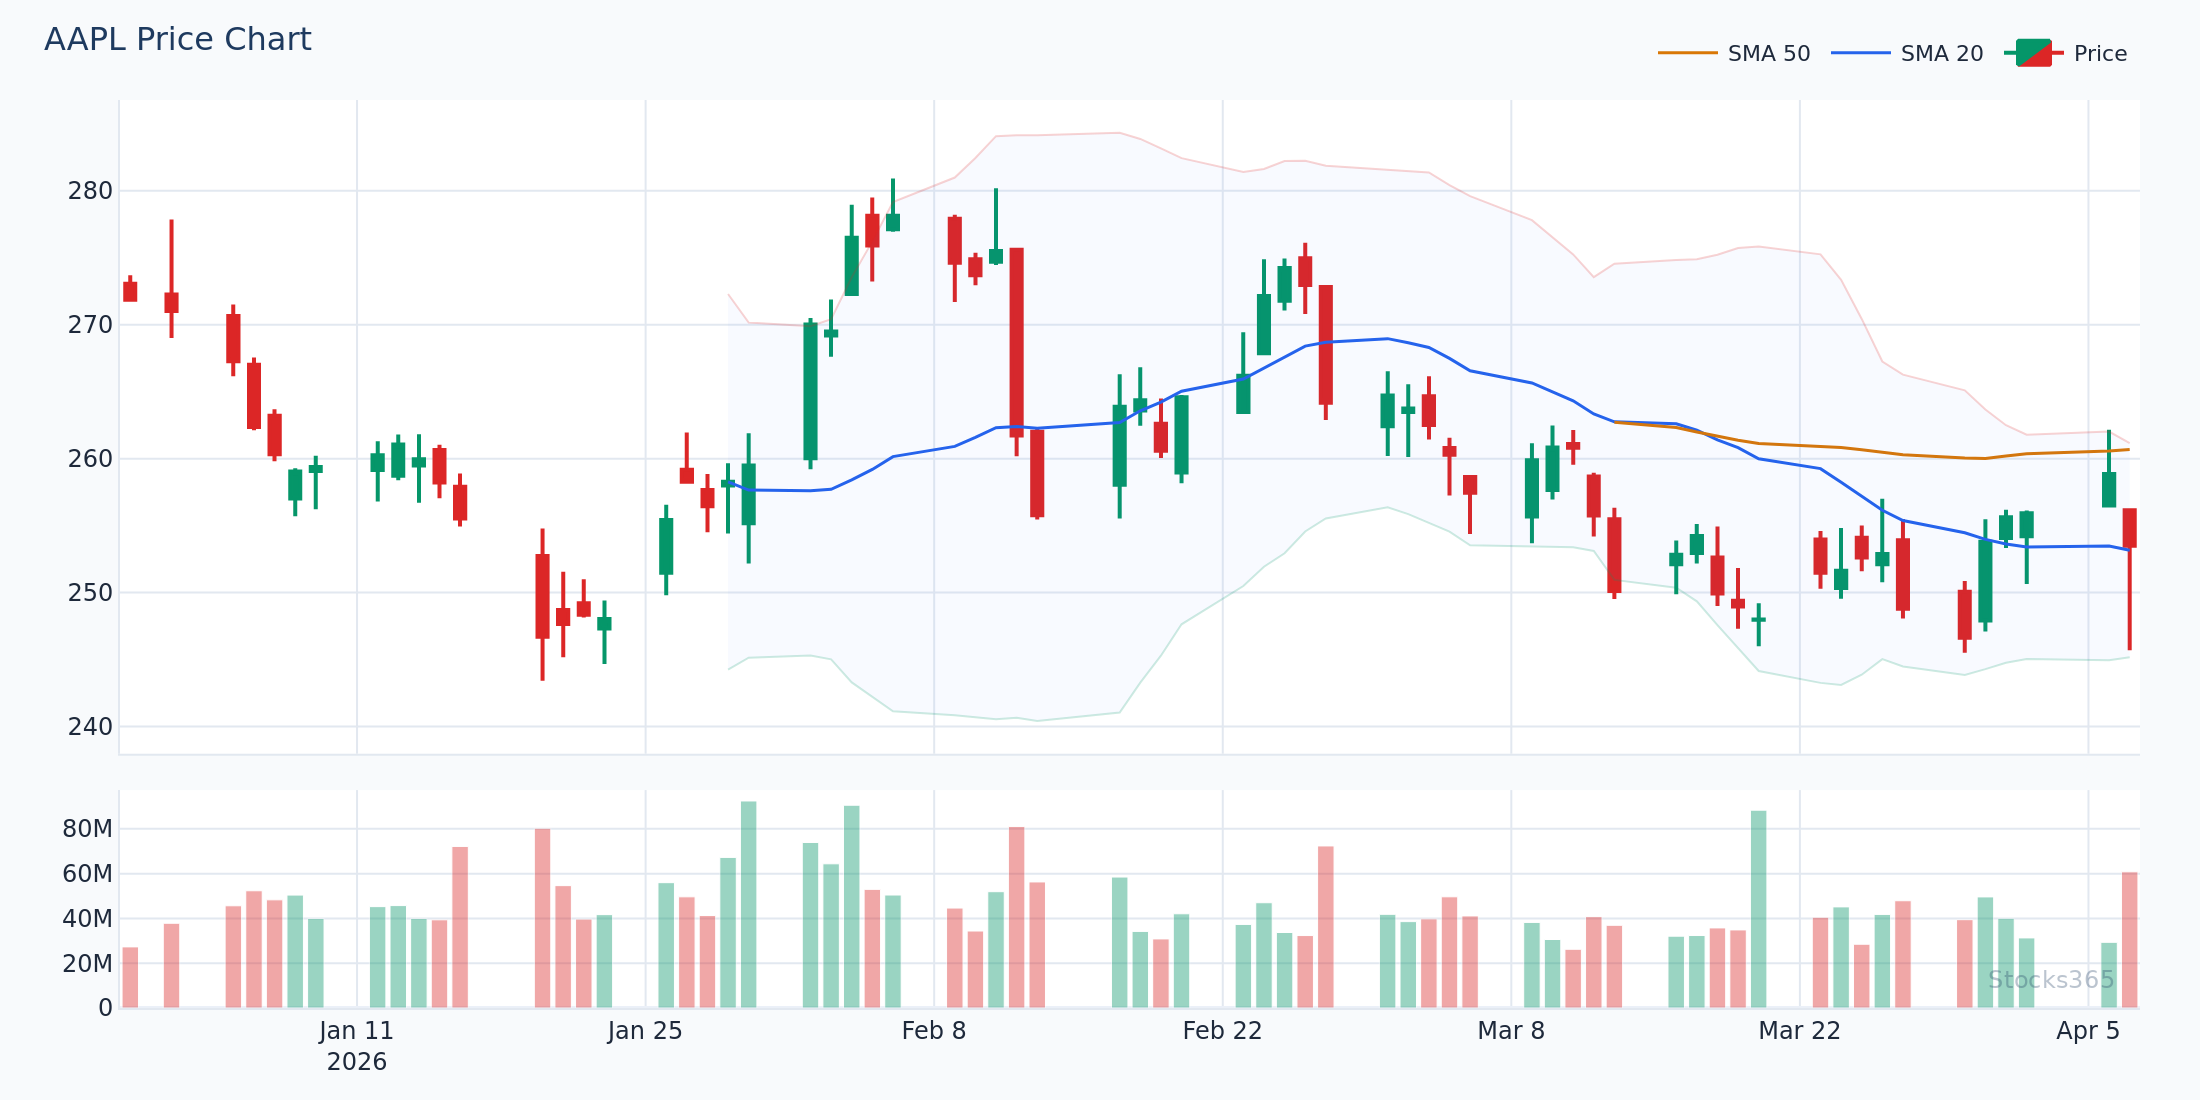
The Stocks365 trust score system evaluates multiple technical and fundamental factors simultaneously — when a MACD bullish crossover on your preferred currency pair coincides with a high Stocks365 trust score for correlated assets, the probability of follow-through increases meaningfully. For example, when MACD generates a bullish USD signal and correlated instruments like AAPL are showing risk-on momentum in the Stocks365 system, it often reflects a broader market sentiment shift that can accelerate currency moves.
If you're newer to technical indicators and want to understand the broader landscape of momentum tools, our beginner-friendly resource What Is RSI? The Complete Beginner's Guide provides an excellent foundation, and understanding the complementary nature of RSI and MACD will make you a more complete technical analyst.
Common MACD Forex Strategy Mistakes to Avoid
Even experienced traders fall into predictable MACD pitfalls. Here are the most damaging errors and how to sidestep them:
Trading Every Crossover Without Context
In a ranging market, MACD will generate frequent crossovers that result in whipsaws. Always identify the broader trend context first — if the daily chart shows a clear range between two levels, be far more selective about acting on lower-timeframe MACD signals. Use a trend filter like the 200-period EMA: only take long MACD signals when price is above it, and only short signals when price is below it.
Ignoring the Zero Line
The zero line is critically important. Bullish crossovers that occur far above the zero line are often exhaustion signals, not new trend initiations. Conversely, the most powerful new uptrends are often signaled by MACD crossing the zero line from below — this indicates that the short-term average has definitively overtaken the long-term average.
Using Identical Settings Across All Pairs and Timeframes
The default (12, 26, 9) MACD works well for many setups, but exotic pairs or highly volatile environments may benefit from adjusted parameters. A faster MACD (8, 17, 9) can reduce lag on volatile pairs like GBP/JPY, while a slower setting (15, 30, 9) might suit the more methodical daily chart analysis on USD/CHF.
Neglecting Risk Management
No MACD strategy — regardless of how accurate the signal — replaces disciplined risk management. Never risk more than 1-2% of your account on a single forex trade, and always define your stop loss before your entry. The best MACD setups still fail a meaningful percentage of the time — position sizing determines whether you survive the losses to capture the winners.
Optimizing RSI Parameters Alongside Your MACD Strategy
When combining MACD with RSI confirmation, the default RSI(14) setting is a good starting point, but optimizing it for your specific currency pair and timeframe can significantly improve results. Our in-depth analysis of RSI Settings: Master the Best Period for Your Strategy provides a data-driven framework for selecting the right RSI period.
For traders curious about how RSI compares to other momentum oscillators — and whether MACD-RSI combinations outperform MACD alone or paired with other tools — our head-to-head comparison in RSI vs Stochastic Oscillator: The Essential Guide offers valuable perspective. And for a practical step-by-step implementation guide that brings all these concepts together, How to Use RSI in Trading: The Ultimate Step-by-Step Guide is an essential read.
Understanding when RSI indicates overbought and oversold conditions is particularly important when using it to filter MACD entries — our breakdown of RSI Overbought and Oversold Levels: Master the Signals covers exactly when these extreme readings strengthen or weaken your MACD-generated trade thesis.
Building a Complete MACD Forex Trading Plan
A MACD forex strategy only becomes consistently profitable when embedded within a complete trading plan. Here's a framework you can adapt:
- Market selection: Choose 2-3 currency pairs that suit your schedule and have historically produced clean MACD signals (EUR/USD and USD/JPY are the recommended starting point)
- Timeframe hierarchy: Define your primary analysis timeframe and one higher timeframe for trend context
- Entry trigger: Document exactly what constitutes a valid MACD signal for your strategy (crossover, histogram shift, divergence, or combination)
- Confirmation requirements: Specify at least one additional confirmation factor — RSI level, moving average alignment, or session timing
- Risk parameters: Define maximum risk per trade, daily loss limit, and position sizing formula
- Review process: Track every trade with entry rationale, outcome, and lessons — review weekly to identify systematic improvements
Consistency in execution is what separates profitable MACD forex traders from the majority who generate occasional wins but struggle with long-term profitability. The edge isn't in finding a perfect indicator — it's in applying an imperfect but statistically sound indicator with disciplined consistency over hundreds of trades.
Frequently Asked Questions
What MACD settings work best for forex trading?
The standard (12, 26, 9) MACD settings are the most widely used and provide a solid baseline for most currency pairs and timeframes. For scalping on 5-minute charts, consider faster settings like (5, 13, 6) to reduce lag. For daily chart swing trading, the default settings perform well. The key is consistency — choose settings, test them on historical data for your specific pair and timeframe, and stick with them rather than constantly optimizing.
Is MACD reliable for forex trading?
MACD is a reliable trend-following and momentum indicator, but like all technical tools, it performs best in trending markets and generates more false signals in ranging conditions. Its reliability increases significantly when combined with additional confirmation factors — such as RSI levels, key support/resistance zones, and session timing. Professional traders rarely rely on MACD in isolation; they use it as one layer in a multi-confirmation approach.
Which currency pair is best for a MACD forex strategy?
EUR/USD is generally considered the best currency pair for MACD-based strategies due to its high liquidity, tight spreads, and tendency to trend clearly during major macro themes. USD/JPY is also excellent, particularly for capturing interest rate differential trends. GBP/USD produces strong MACD signals but with higher volatility. Exotic pairs with wider spreads and thinner liquidity tend to generate more MACD false signals and should be approached with additional caution.
How do I avoid false MACD signals in forex?
The most effective ways to filter false MACD signals include: only trading signals that align with the higher timeframe trend, requiring RSI confirmation before entry, avoiding crossovers during low-liquidity Asian session hours on major European and Dollar pairs, using the zero-line as a filter (prefer longs when MACD crosses above zero, shorts when below), and waiting for full candle closes before acting on any signal rather than anticipating crossovers mid-candle.
Can I use MACD divergence for forex trading?
Absolutely — MACD histogram divergence is one of the most powerful applications of the indicator in forex trading. Regular divergence (price and MACD moving in opposite directions) signals potential reversals, while hidden divergence signals trend continuation on pullbacks. The histogram is particularly useful for divergence analysis because it visually represents the strength of momentum, making divergences easier to spot than on the MACD line itself. Combining MACD divergence with RSI divergence on the same setup creates an especially high-conviction signal.