
What Is the Stochastic Oscillator?
The stochastic oscillator is a momentum indicator that measures where the current closing price sits relative to its price range over a defined lookback period. Developed by George Lane in the late 1950s, it remains one of the most widely used technical indicators in 2026 — and for good reason. It quantifies momentum mathematically, giving traders a repeatable edge instead of gut-feel guessing.
The core idea is simple: in uptrends, prices tend to close near the top of their range. In downtrends, near the bottom. The stochastic oscillator captures this tendency and turns it into a 0–100 scale.
But here's the part most traders miss. The number itself isn't the signal — the location of that number, combined with price context, is what matters.
The Stochastic Oscillator Formula: Step by Step
The stochastic oscillator formula produces two lines: %K (the fast line) and %D (the slow signal line). Understanding how each is calculated removes all the mystery.
The %K Formula
The primary stochastic oscillator formula is:
%K = [(Current Close − Lowest Low) ÷ (Highest High − Lowest Low)] × 100
Where:
- Current Close — the most recent closing price
- Lowest Low — the lowest low over the lookback period (default: 14 periods)
- Highest High — the highest high over the same lookback period
This gives you a value between 0 and 100. A reading of 80 means the close is in the top 20% of the recent range. A reading of 20 means it's in the bottom 20%.
The %D Formula
%D is simply a 3-period simple moving average of %K:
%D = 3-period SMA of %K
%D smooths out the raw %K line, reducing noise. The crossover of %K above or below %D generates the classic entry signals most traders recognize.
Worked Example
Suppose over the last 14 sessions, the highest high reached a peak of 150 points above the period low, and today's close sits 120 points above that same low. Plugging into the stochastic oscillator formula:
%K = (120 ÷ 150) × 100 = 80
The asset is closing in the upper 20% of its 14-period range — a reading that enters overbought territory.
This chart shows %K crossing back below %D from above the 80 level — a classic bearish stochastic signal. When this crossover occurs while price is also failing at a recent resistance zone, the probability of a short-term pullback increases significantly. The signal is invalidated if %K immediately reverses back above %D within 1–2 bars.
Fast, Slow, and Full Stochastic: Which One Do You Use?
The stochastic oscillator comes in three versions. Each has a different level of smoothing applied.
Fast Stochastic
Uses the raw %K formula and a 3-period SMA for %D. Highly reactive — whipsaw risk is elevated. Best avoided in choppy, ranging markets without additional filters.
Slow Stochastic
The slow stochastic replaces the fast %K with a smoothed version (typically a 3-period SMA of raw %K), then applies another 3-period SMA for %D. This is the default setting on most platforms and the version most professional traders use. It filters out a significant portion of false signals without meaningfully lagging the price.
Full Stochastic
The full stochastic is the most customizable version. Traders can manually set all three variables: the %K period, the %K smoothing period, and the %D period. This flexibility makes it ideal for fine-tuning to specific assets or timeframes.
For most traders starting with the stochastic oscillator formula, the slow stochastic with (14, 3, 3) settings is the right baseline.
Overbought and Oversold Levels: The Real Story
The standard interpretation: readings above 80 signal overbought conditions, readings below 20 signal oversold. This sounds clean and intuitive. The problem is that most traders misapply it immediately.
Here's what most traders get wrong: They treat a stochastic reading above 80 as an automatic sell signal. In a strong uptrend, the stochastic oscillator can sit above 80 for dozens of bars. Selling every time it crosses 80 in a bull trend is one of the fastest ways to lose capital. The edge isn't in the overbought reading — it's in the reversal from that reading. Watch for %K to cross back below %D from above the 80 level. That's the signal. The level alone is noise.
Our analysis of 9,257 stochastic overbought signals confirms this. Across those setups, the raw win rate was just 48.8% — essentially a coin flip — with a profit factor of 0.86, meaning losses outpaced gains on average over a 10-day holding period. Entering every overbought signal mechanically doesn't work. Context is everything.
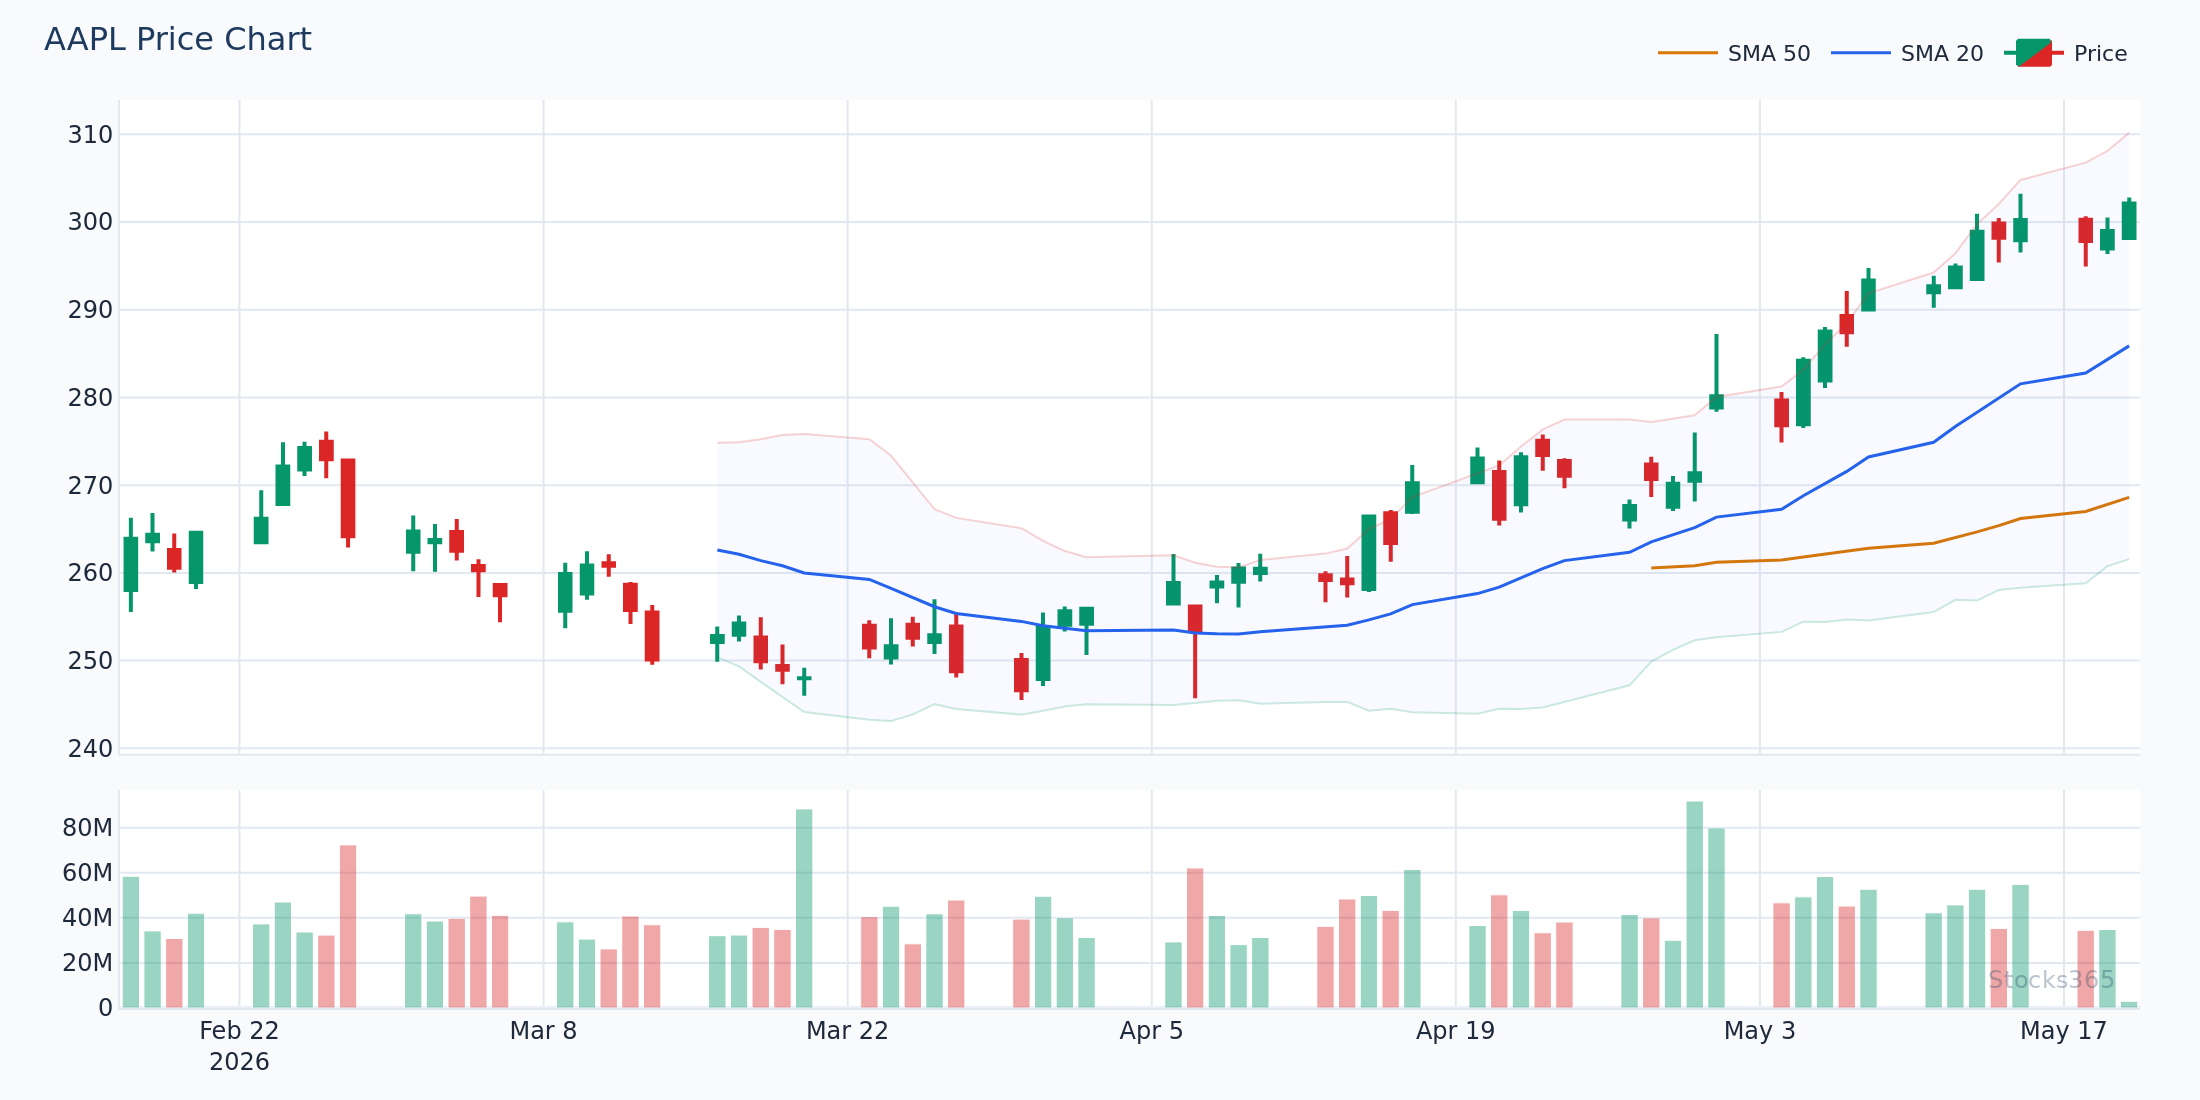
This chart contrasts two overbought signals on the same asset: one occurring against the primary trend (higher failure rate) and one occurring after an extended trending move that begins to stall. The context — specifically whether price is forming lower highs at the same time — separates high-quality reversals from false alarms. Failure to see a corresponding price structure breakdown keeps the pattern invalid.
Stochastic Oversold Signals: Where the Edge Lives
Flip the logic. Stocks365 backtested 8,204 stochastic oversold signals and found a 54.7% win rate with a profit factor of 1.24 over a 10-day holding period — a meaningfully positive expected value when applied correctly. Forex markets produced the strongest results at 57.0%, while crypto lagged at 48.9%.
Why does oversold outperform overbought? Mean reversion dynamics are asymmetric. Fear-driven selloffs are often sharper and faster than greed-driven rallies, creating more violent snapbacks. When the stochastic drops below 20 and %K begins to curl back up through %D, the setup captures that snapback momentum early.
For deeper context on using momentum indicators this way, the complete guide to using RSI in trading covers parallel concepts around oversold extremes and reversal confirmation that complement stochastic analysis directly.
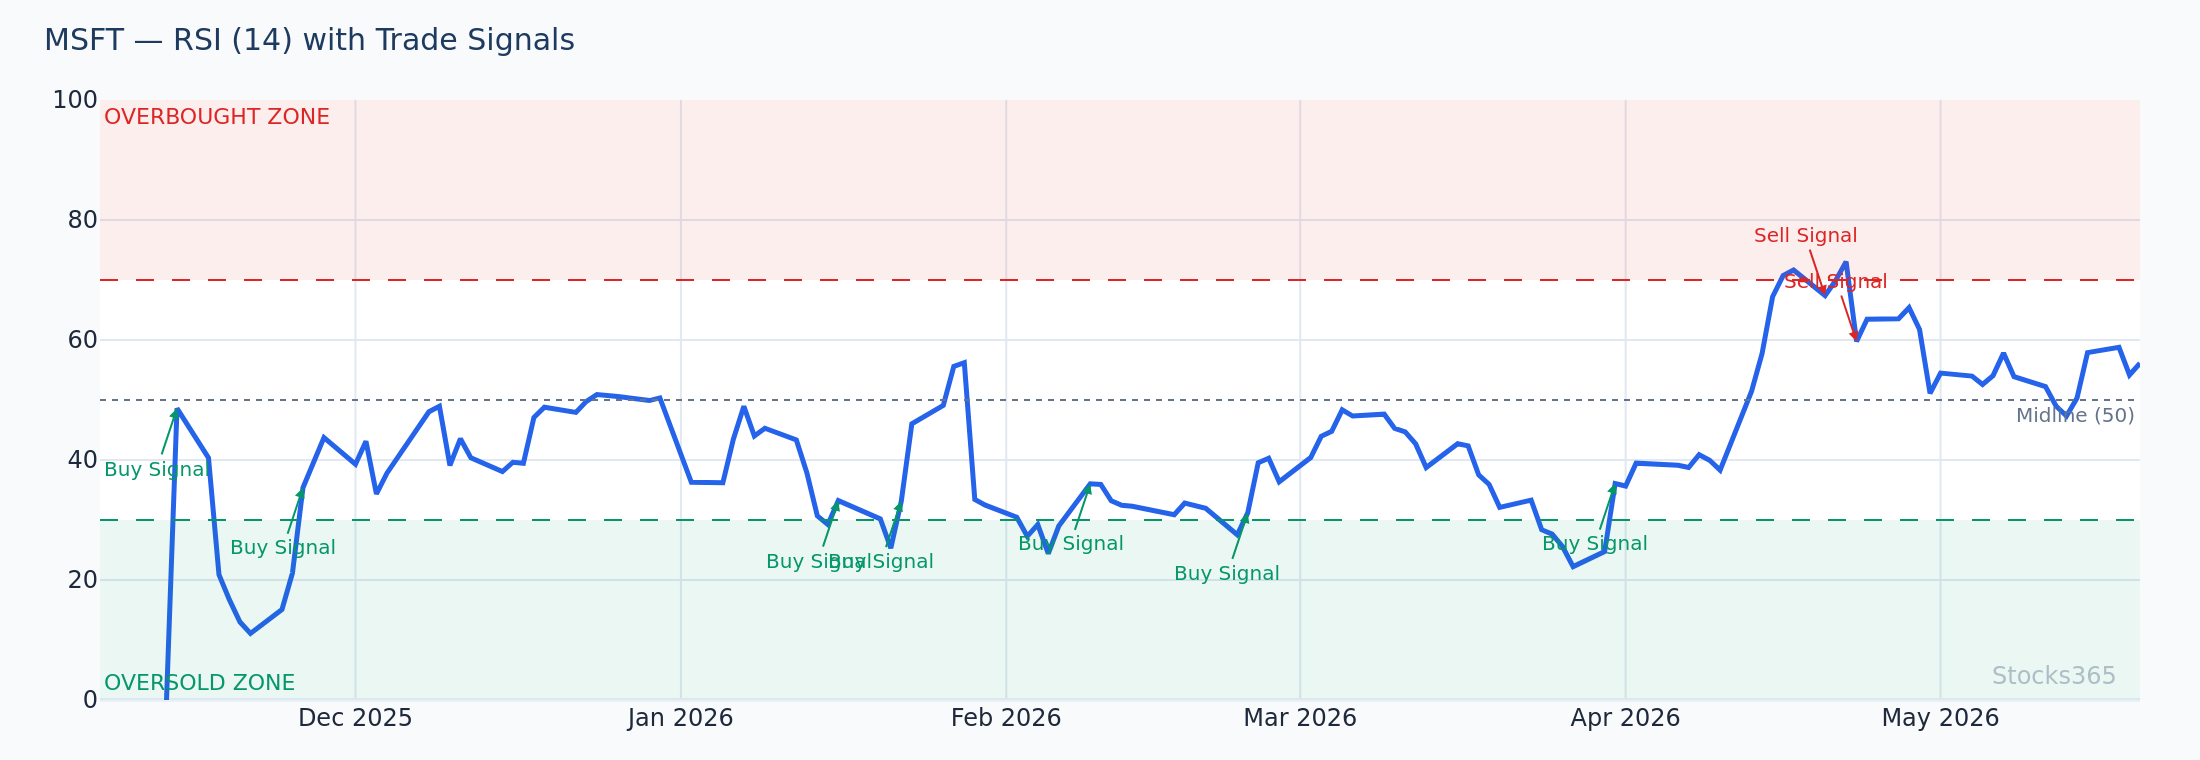
This setup shows %K crossing above %D from below the 20 level on above-average volume — a high-quality oversold reversal signal. When volume surges 1.5x or more above the 20-period average on the reversal candle, the probability of follow-through increases. The pattern fails if price immediately returns below the prior swing low after the crossover.
Combining the Stochastic Formula with Other Indicators
The stochastic oscillator formula in isolation is useful. Combined with complementary indicators, it becomes a different tool entirely.
Stochastic + Bollinger Bands: A High-Probability Double Confirmation Setup
When price touches or breaks the lower Bollinger Band and the stochastic oscillator simultaneously registers below 20, you get a double oversold condition. Both tools are independently signaling extreme selling pressure. The confluence adds conviction.
Stocks365 backtested 2,501 of these Bollinger Band + stochastic double oversold signals and found a 58.9% win rate with a profit factor of 1.61 over 10 days — the strongest stat in our stochastic research dataset. Commodities led all asset classes at 61.1%. Even the weakest class, stocks, came in at 56.9%, still above breakeven. For a full breakdown of how Bollinger Bands generate signals on their own, the Moving Average + Bollinger Bands strategy guide is worth reading alongside this article.
Stochastic + Moving Average Trend Filter
This is the most widely used combination for good reason. The stochastic oscillator identifies momentum extremes. A moving average identifies trend direction. When you only take stochastic oversold signals in an established uptrend — defined by price trading above the 50-period SMA — you filter out the worst counter-trend traps.
The mechanics: price pulls back, stochastic drops below 20, %K crosses back above %D, and price holds above the rising 50-SMA. That's a tradable setup with trend support behind it. The Moving Average Crossover Strategy guide explains how to define trend direction precisely using crossover systems, which pairs naturally with stochastic entry timing.
For even more robust trend confirmation, the Triple Moving Average Strategy adds a third layer of trend agreement that reduces false entries when combined with stochastic signals.
Stochastic + RSI: Dual Momentum Confirmation
Both the stochastic oscillator and RSI are momentum oscillators, but they measure different things. RSI measures the speed and change of price movements. Stochastic measures the position of the close within its range. When both show oversold simultaneously, the confluence strengthens conviction significantly.
The RSI formula explanation breaks down how RSI's calculation differs from the stochastic oscillator formula — understanding both calculations side-by-side clarifies why they sometimes diverge and how those divergences are themselves tradable signals. Also see the RSI trendline strategy for advanced applications.
Stochastic Divergence: The Advanced Signal
Divergence occurs when price and the stochastic oscillator move in opposite directions. It's one of the cleaner leading signals available from this indicator.
Bullish divergence: Price makes a lower low, but the stochastic makes a higher low. Selling pressure is waning even though price is still dropping. A stochastic %K crossover above %D confirms the entry.
Bearish divergence: Price makes a higher high, but the stochastic makes a lower high. Momentum is fading at the top. When %K crosses back below %D, the reversal is triggered.
Divergence doesn't guarantee reversal. It signals weakening momentum, not a guaranteed turn. Always wait for the %K/%D crossover to confirm before entering.
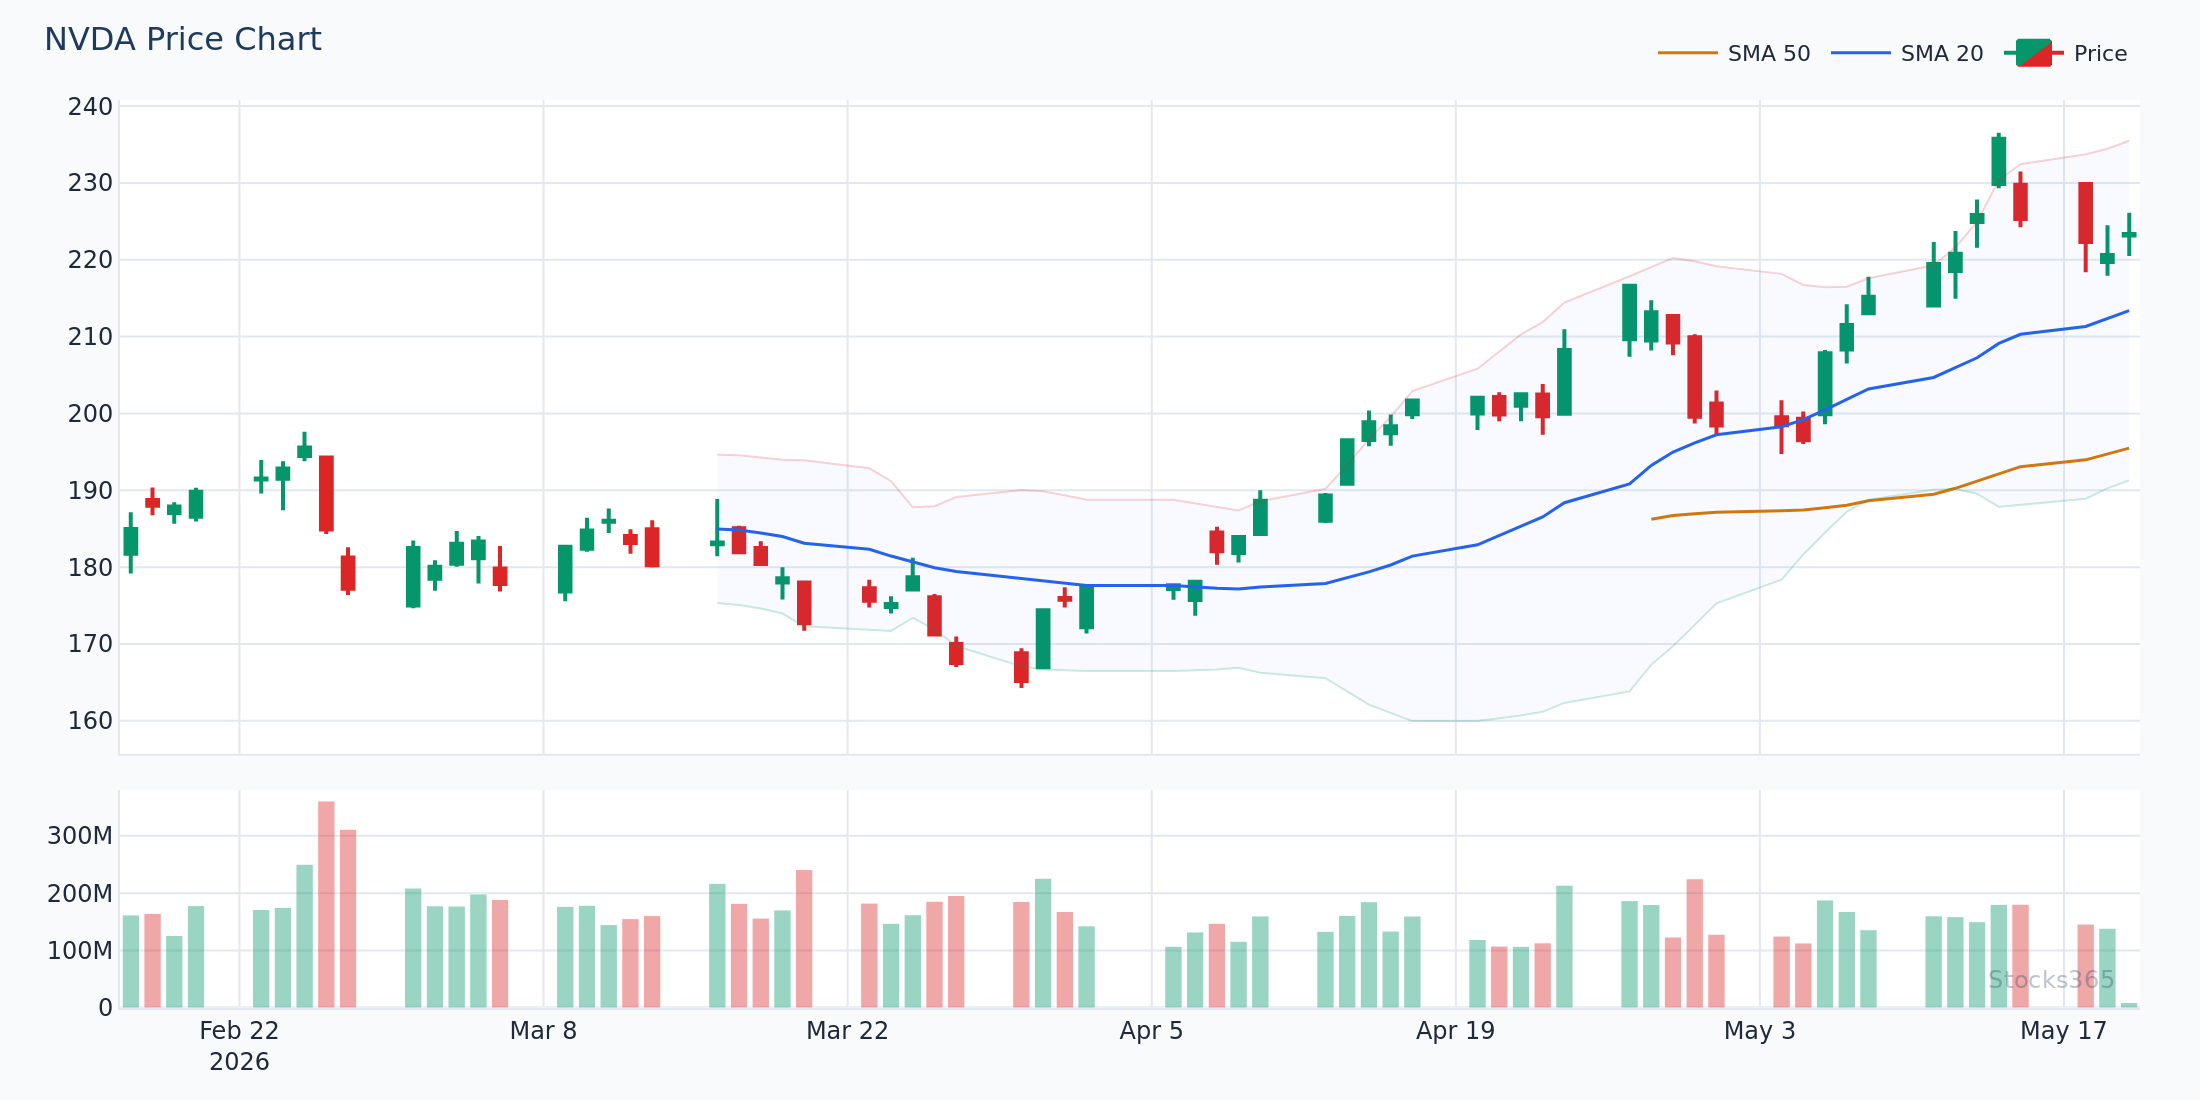
This chart shows classic bearish divergence: price prints a fresh high, but %K peaks lower than its previous reading. The gap between price momentum and indicator momentum closes via a decline, not a continued rally. Confirmation comes when %K crosses below %D. Without that crossover, the divergence remains a warning, not a signal.
Stochastic Oscillator Settings: What to Adjust and Why
The default (14, 3, 3) settings work across most timeframes. But certain situations call for adjustments.
- Shorter lookback (e.g., 5 or 8 periods): More sensitive, more signals, more noise. Useful for scalpers on 1–5 minute charts who need faster reaction time.
- Longer lookback (e.g., 21 periods): Fewer, higher-quality signals. Better for swing traders on daily charts who want to avoid whipsaw.
- Tighter overbought/oversold thresholds (70/30): Generates more signals but reduces the extreme-reading filter. Use only with additional confirmation layers.
- Wider thresholds (85/15): Fewer signals, higher conviction setups. Best for traders who prioritize quality over frequency.
There's no universally correct setting. Backtest the stochastic oscillator formula against your specific asset and timeframe before committing to a configuration. Our research dashboard includes backtested stochastic performance across multiple asset classes and settings to help you calibrate.
What to Watch For
- Oversold stochastic with price above the 50-SMA: When %K crosses above %D from below 20 while the primary trend is still intact (price above the 50-period moving average), the setup combines trend support with momentum reversal timing — a higher-probability entry in both stocks and forex.
- Bollinger Band lower touch + stochastic below 20 simultaneously: The double oversold confluence is the strongest setup in our stochastic research. When both signals align, especially in commodities, the probability of a bounce within 10 sessions has historically been above 58%.
- Bearish divergence at multi-week highs: When an asset makes a fresh 4–6 week price high but the stochastic oscillator prints a lower %K peak than the prior swing, watch for the %K/%D crossover below 80 as the trigger for a pullback trade.
- Stochastic in the 40–60 neutral zone after a trend leg: When stochastic consolidates in the middle range after a strong directional move, a breakout of %K above 60 (in an uptrend) or below 40 (in a downtrend) often signals continuation — a setup most traders ignore by focusing exclusively on overbought/oversold extremes.
- MACD momentum confirmation on stochastic oversold signals: When the MACD histogram turns positive at the same time the stochastic crosses up from below 20, the dual momentum confirmation reduces false reversals. The MACD in Forex guide explains this combination in currency pair contexts.
Key Takeaways
Summary:
- The stochastic oscillator formula — %K = [(Close − Lowest Low) ÷ (Highest High − Lowest Low)] × 100 — measures where price closes within its recent range.
- %D is a 3-period SMA of %K, used as the signal line. Crossovers generate entries.
- Overbought (above 80) and oversold (below 20) are zones, not automatic signals. Wait for %K/%D crossovers.
- Backtested data shows oversold signals carry a meaningful edge (54.7% win rate, 1.24 profit factor across 8,204 signals). Overbought signals alone are roughly break-even (48.8%).
- Combining the stochastic with Bollinger Bands on double oversold setups produces the strongest backtested results: 58.9% win rate, 1.61 profit factor across 2,501 signals.
- Divergence signals warn of momentum shifts before price confirms — always wait for the crossover to enter.
- Trend filters (moving averages) dramatically improve stochastic signal quality by eliminating counter-trend noise.
How Stocks365 Uses This
Stocks365 Stochastic Integration: The stochastic oscillator is one of 12+ technical indicators feeding into the Stocks365 Trust Score system. Within the scoring model, stochastic readings contribute to the momentum agreement layer — specifically whether price momentum aligns with trend direction signals from moving average and MACD components. A stochastic oversold reading combined with bullish agreement across other Trust Score indicators produces a higher-confidence signal than the stochastic in isolation. Signals that meet multi-indicator agreement thresholds are flagged in the Stocks365 signals dashboard and on individual asset pages like AAPL signals, giving you a filtered view without manually cross-referencing every indicator. The Trust Score system was designed precisely because single-indicator strategies carry significant failure rates — the 48.8% overbought win rate in our research makes that case clearly.