
Moving Average + Bollinger Bands Strategy: The Complete 2026 Guide
Most traders use Bollinger Bands wrong. They watch price touch the upper band and immediately think "sell." They see a lower band tag and rush to buy. That's not a strategy — that's guessing with extra steps.
The real edge comes from combining Bollinger Bands with moving averages to filter noise, confirm trend direction, and time entries with precision. This is a complete guide to building that system from scratch.
Stocks365 backtested 14,266 Bollinger Squeeze Breakout signals across equities, crypto, forex, and commodities and found an overall win rate of 49.5% — but with a profit factor of 1.03. That means this setup, when traded correctly, is profitable at scale. The reason? It filters out the garbage signals. Here's exactly how to do the same.
What Are Bollinger Bands and Why Moving Averages Matter
Bollinger Bands consist of three lines: a middle band (typically a 20-period simple moving average), an upper band (middle band + 2 standard deviations), and a lower band (middle band − 2 standard deviations). The bands expand when volatility rises. They contract when the market goes quiet.
The middle band is a moving average. That's the part most traders forget.
So when traders talk about a "moving average Bollinger Bands strategy," they typically mean adding a second moving average — often a 50-period or 200-period EMA — to create a trend filter that tells you which side of the trade to take when price interacts with the bands.
The 20 SMA: Built Into the Bands
The 20-period SMA forms the backbone of standard Bollinger Bands. When price holds above the 20 SMA in an uptrend, bounces from the lower band are high-probability long setups. When price stays below the 20 SMA in a downtrend, rallies to the upper band are high-probability short setups. The middle band isn't just decoration — it's the trend anchor.
Adding a Second Moving Average for Context
A 50-period EMA or 200-period EMA layered on top gives you market regime context. If price trades above the 50 EMA, you're in a bullish regime. Focus on long setups near the lower band. If price trades below the 50 EMA, flip your bias. This single filter eliminates a large portion of false signals that kill undisciplined traders.
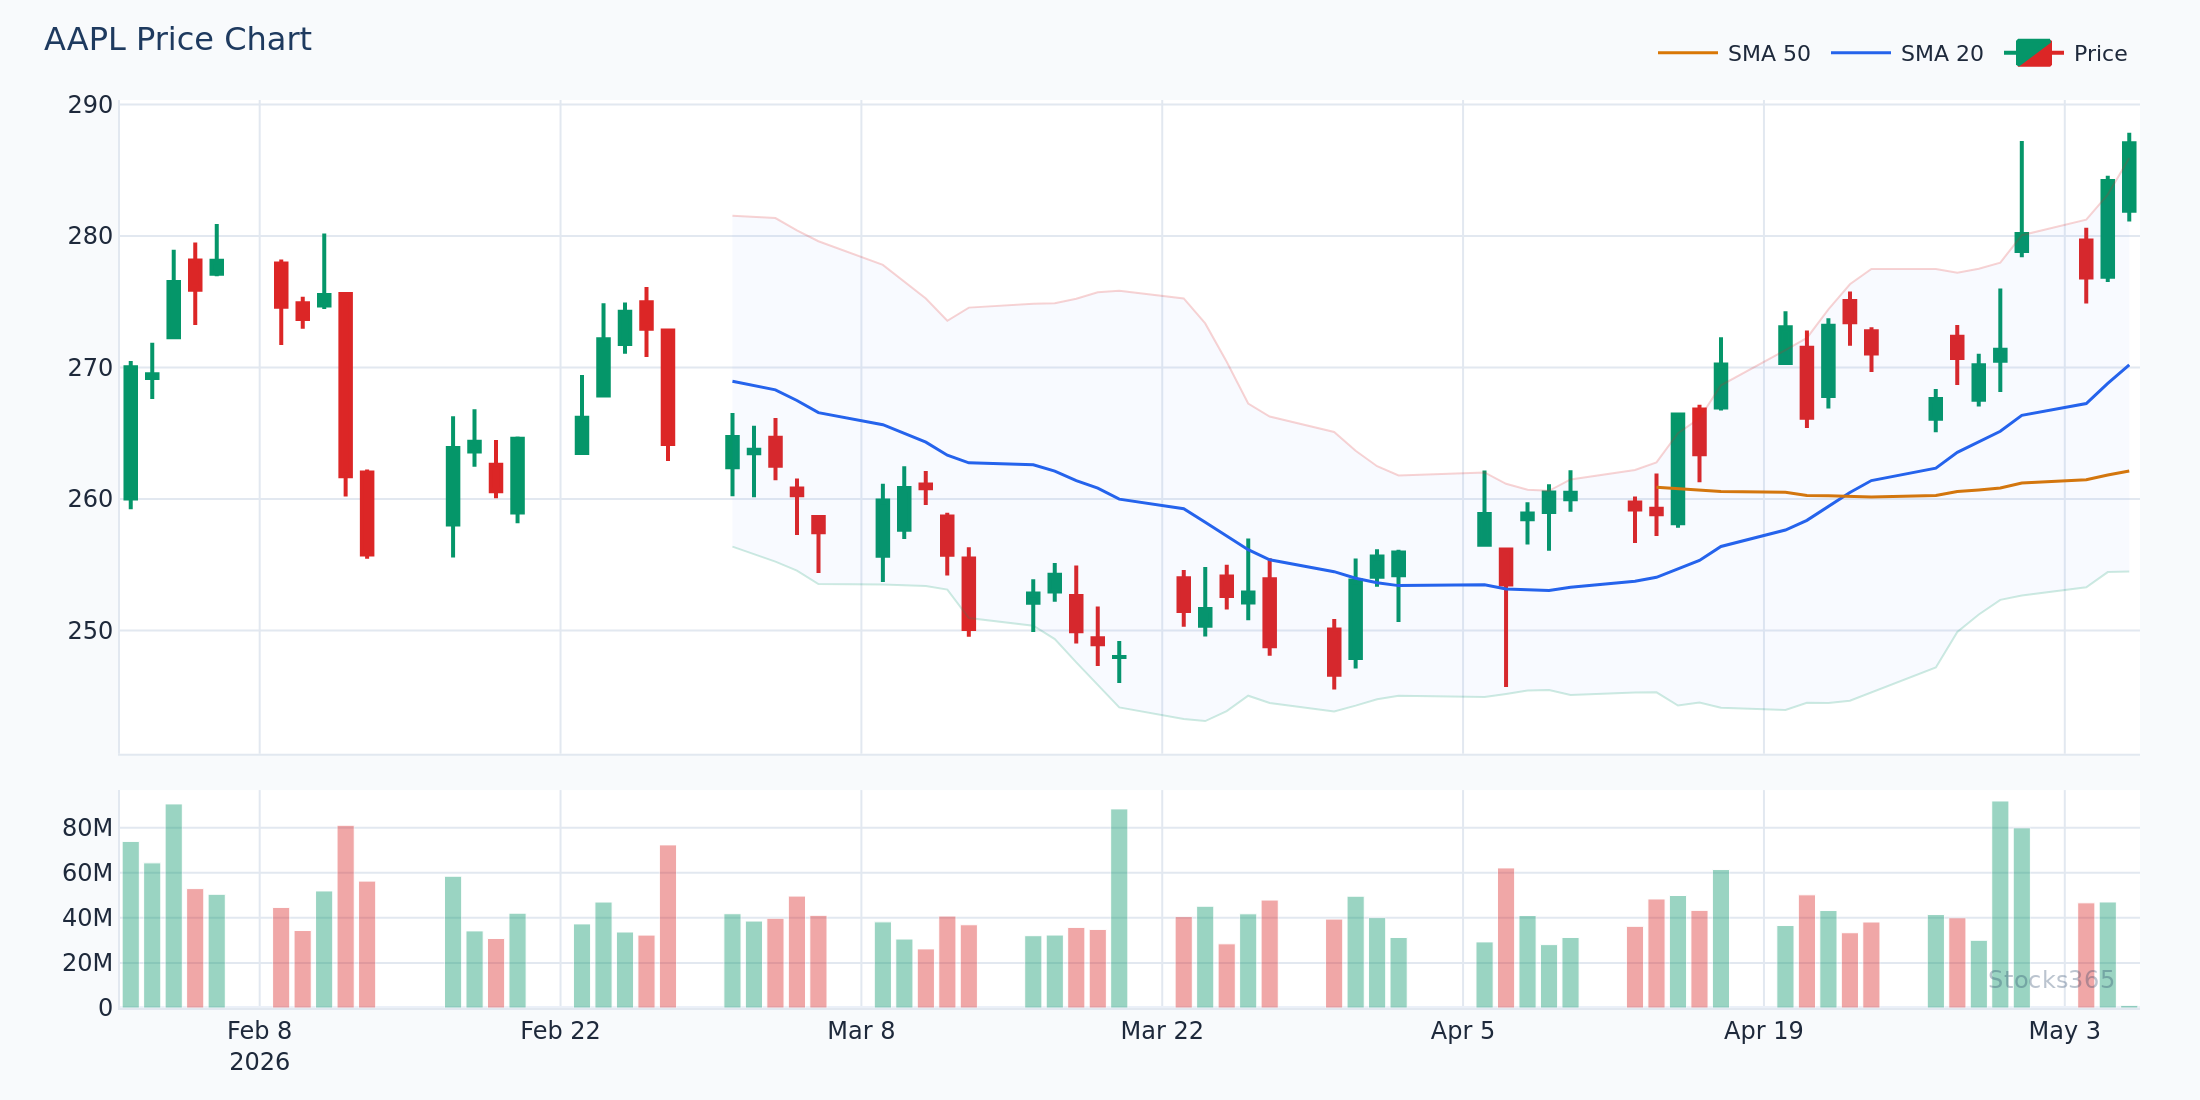
This chart shows price respecting the 50 EMA as dynamic support while the lower Bollinger Band provides a precise entry zone. When price touches the lower band while remaining above the 50 EMA, it signals a high-quality long entry. A close back above the 20 SMA (middle band) confirms the setup is working. A daily close below the 50 EMA invalidates the bullish bias entirely.
The Core Moving Average Bollinger Bands Strategy: 3 Setups That Work
Stop looking for one magic setup. The real edge is in a system of setups, each suited to a different market condition.
Setup 1: The Bollinger Squeeze Breakout with Trend Confirmation
The Bollinger Squeeze happens when band width contracts to multi-week lows. Volatility compresses. A breakout is coming. The question is: which direction?
Here's where the moving average does the heavy lifting:
- Wait for band width to drop below its 20th percentile over the last 120 bars
- Identify the direction of the 50 EMA slope — is it trending up or down?
- Wait for price to break out of the squeeze in the direction of the 50 EMA
- Enter on the breakout candle close, or on a retest of the breakout level
- Place your stop below the opposite Bollinger Band
The squeeze is the setup. The moving average is the filter. Together, they create a defined, repeatable entry.
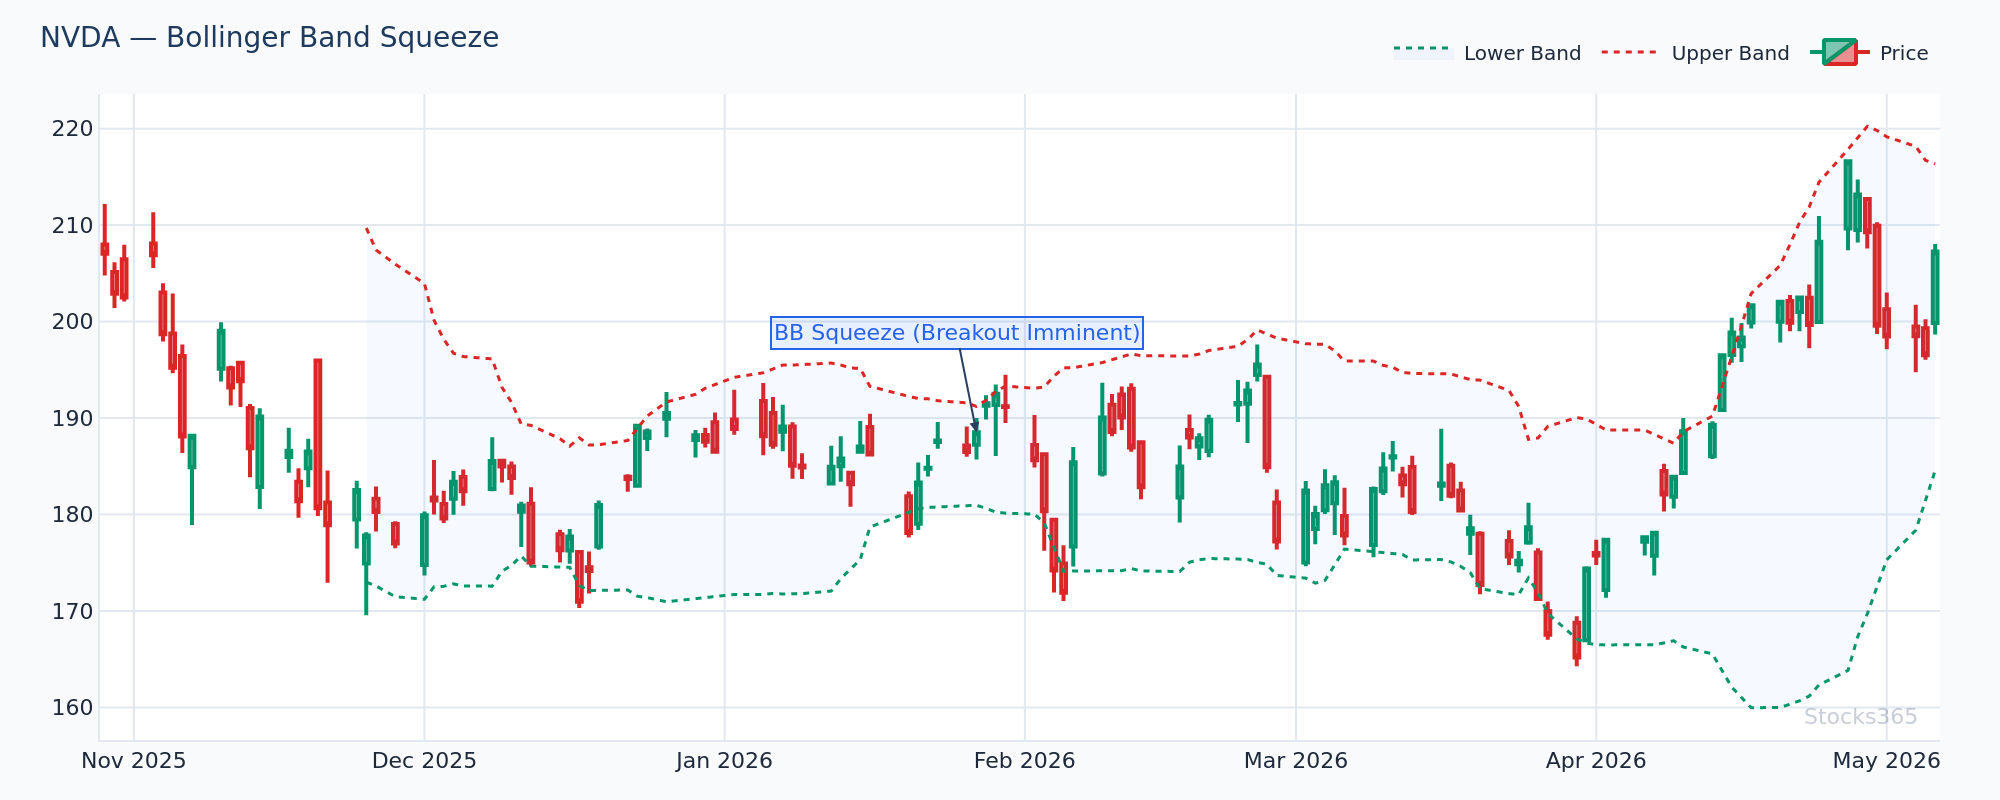
This setup shows a classic volatility compression phase, where the Bollinger Bands narrow significantly before a directional expansion. When the 50 EMA is sloping upward and price breaks above the upper band after a squeeze, the move typically extends 2–3 ATR before mean-reverting. If price breaks out but immediately snaps back inside the bands within two candles, treat it as a failed breakout and exit.
Setup 2: The Trend Continuation Pullback
In strong trends, price "rides" the upper or lower Bollinger Band. Pullbacks to the middle band (20 SMA) represent low-risk continuation entries — not reversals.
Here's what a valid trend continuation pullback looks like in a bull trend:
- Price has previously touched or broken above the upper Bollinger Band
- Price pulls back to the 20 SMA (middle band) without closing below it
- The 50 EMA remains below current price, confirming the uptrend
- RSI holds above 50, showing momentum hasn't reversed
- Entry triggers on the next bullish candle closing above the middle band
This is not a reversal trade. This is trend continuation with a lower-risk entry. The difference matters.
For more on combining momentum indicators with this setup, see our guide on RSI overbought and oversold levels — specifically how RSI holding above 40 in uptrends signals continuation, not exhaustion.
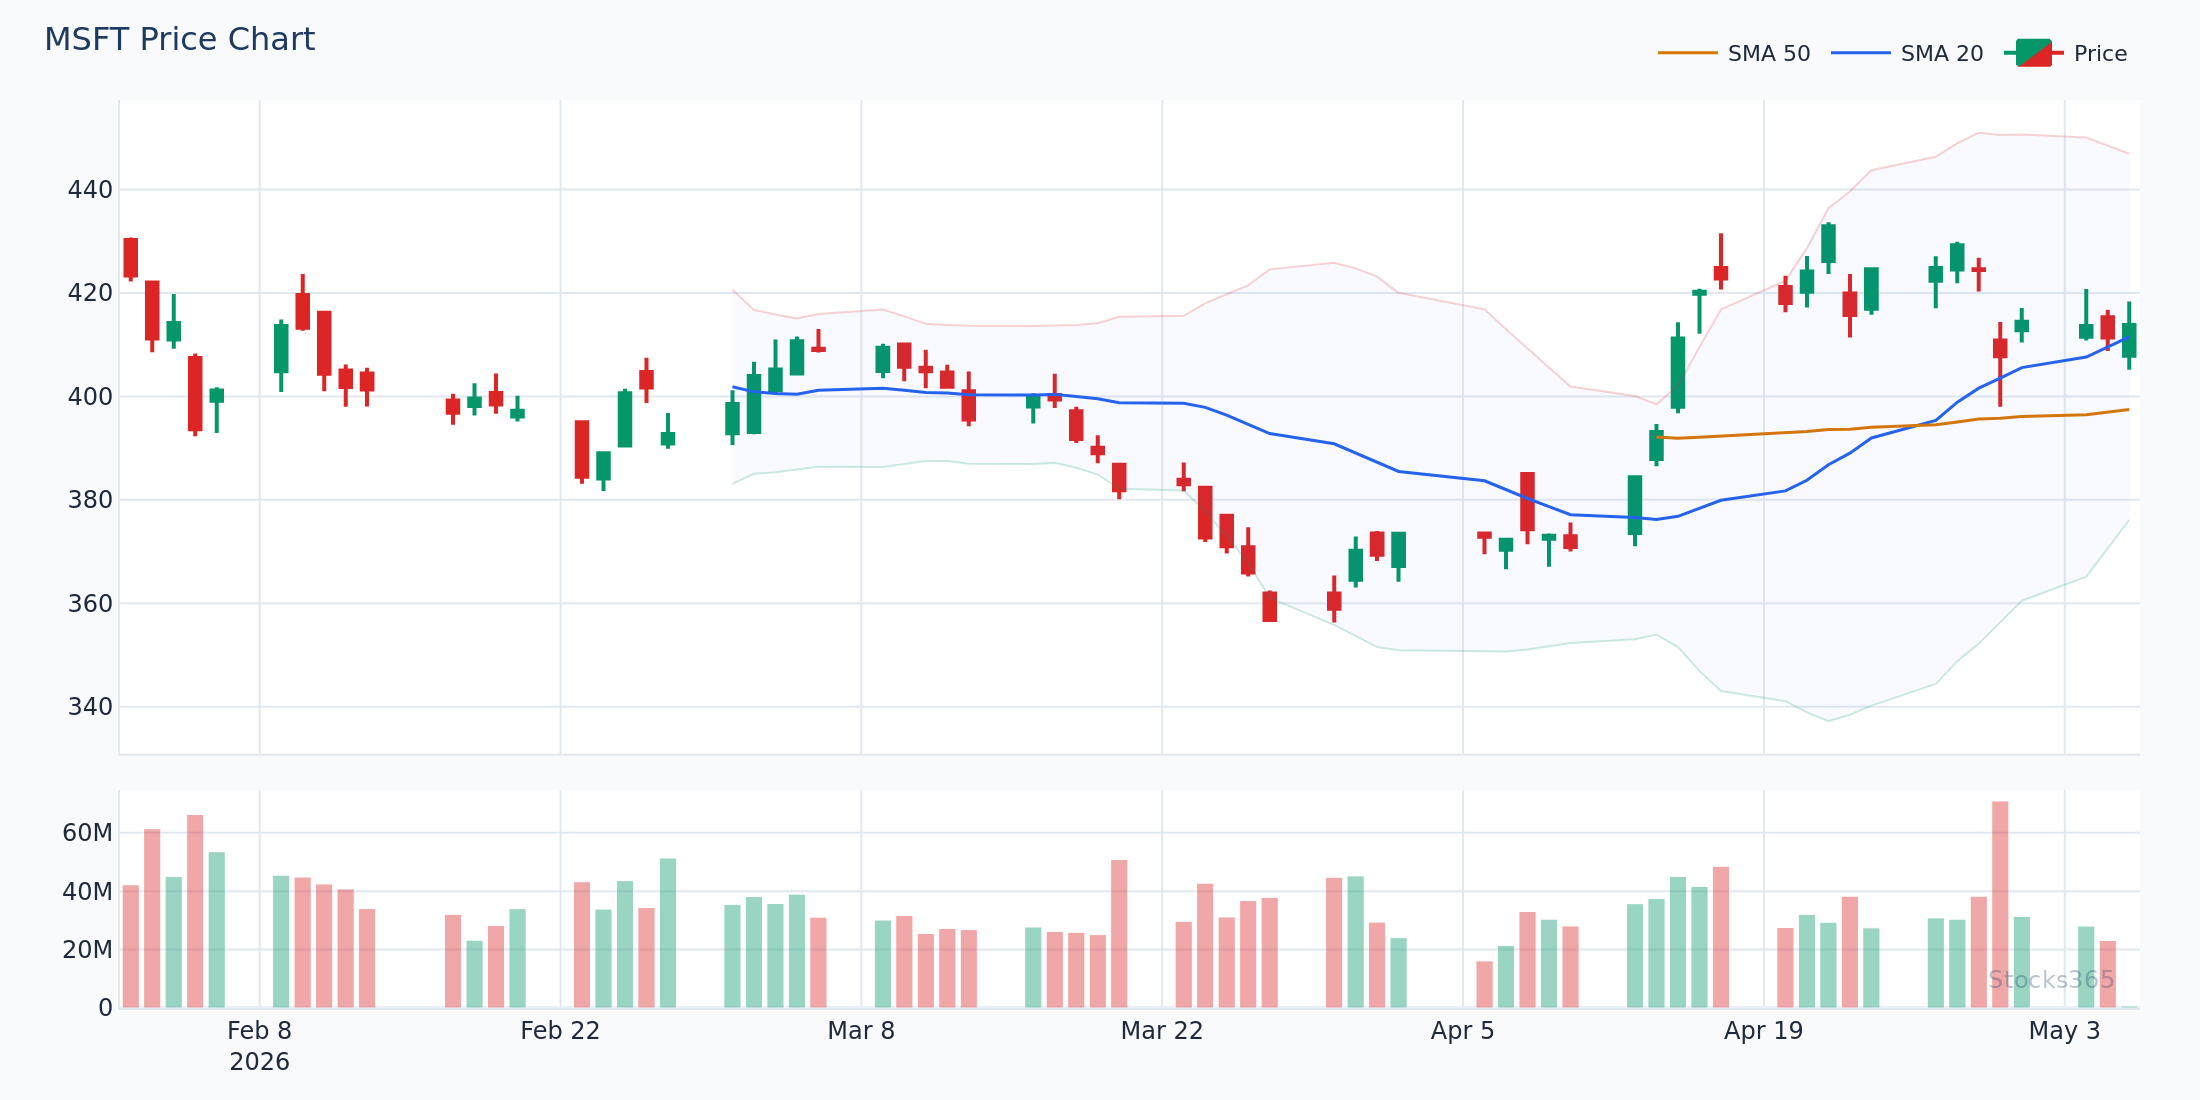
This chart demonstrates price pulling back to test the 20 SMA after an extended move that touched the upper band multiple times. The 50 EMA sits well below current price, confirming the bullish regime. A bullish engulfing or hammer candle forming at the middle band is the entry trigger. The setup fails if price closes below the 20 SMA on elevated volume — that's a warning that the trend is weakening.
Setup 3: The Band Expansion Reversal (With Caution)
When price closes outside the Bollinger Bands, it's in statistically extreme territory. But here's what most traders get wrong: an upper band touch is NOT a sell signal by itself.
Here's what most traders get wrong: They see price close above the upper Bollinger Band and immediately short it, expecting a snap-back. In trending markets, price can close above the upper band five, ten, even fifteen consecutive candles. Our analysis of 3,255 upper band touch signals found a win rate of just 49.6% with a profit factor of 0.88 — meaning traders who blindly fade upper band touches at scale lose money over time. The edge disappears without a trend filter.
A valid reversal setup requires confluence, not just a band touch. You need:
- Price closing outside the band (upper or lower)
- A bearish/bullish reversal candle on the next bar (engulfing, doji, pin bar)
- RSI showing divergence — price makes a new extreme but RSI does not
- The 50 EMA trending in the opposite direction of the extended move
- Volume declining on the final push outside the band
All five factors together? That's a real reversal setup. One or two? That's noise.
Learn how to spot RSI divergence on these setups with our dedicated guide: RSI Divergence Explained: Master Bullish & Bearish Signals.
Optimizing Moving Average Settings for Bollinger Bands
The default 20-period SMA works for most setups. But context changes everything.
Choosing the Right Period
Different timeframes and asset classes respond better to different settings:
- Intraday (5–15 min charts): 20 SMA for the bands, 50 EMA as the trend filter. Fast enough to catch moves, slow enough to filter spikes.
- Daily charts (swing trading): 20 SMA for the bands, 50 EMA or 200 EMA for trend direction. The 200 EMA separates bull and bear markets cleanly.
- Weekly charts (position trading): Consider widening the Bollinger Bands to 2.5 standard deviations. Weekly moves are larger. Default settings cause too many false signals.
The period isn't magic. Consistency is. Pick settings that match your timeframe and stick with them long enough to generate meaningful data.
EMA vs. SMA: Which Works Better With Bollinger Bands?
Exponential moving averages react faster to recent price changes. Simple moving averages weight all periods equally. For the Bollinger Band middle line, the SMA is standard and most widely watched — stick with it. For your trend filter, the EMA often works better because it reacts faster to trend changes without lagging as much as the SMA at key turning points.
For a deeper look at how moving average periods affect indicator performance, see our analysis on RSI settings and period optimization — the same principles about lookback periods and sensitivity apply here.
Moving Average Bollinger Bands Strategy by Asset Class
Not all markets are created equal. This setup performs differently depending on where you trade it.
Equities: The Home Turf
Stocks trend. That's their nature over time, driven by earnings growth, buybacks, and macro cycles. The trend continuation pullback setup works exceptionally well on large-cap equities that have strong institutional support. Check individual stock signals at pages like AAPL signals to see how the current setup aligns with Bollinger Band positioning in real time.
Crypto: High Volatility, Higher Potential
Crypto is where Bollinger Band strategies show the most asymmetric performance — but also the most whipsaws. Our backtested data shows the Bollinger Squeeze Breakout achieves a 51.8% win rate in crypto versus 47.1% in forex. The larger ATR moves in crypto mean winners are bigger. But you need tighter risk management because the same volatility that creates opportunity also creates rapid stop-outs.
In crypto, wider band settings (2.5 standard deviations) and confirmation from volume are non-negotiable before entering squeeze breakouts.
Forex: Tightest Competition
Forex is mean-reverting during ranging sessions but violently trending during major news events. The squeeze breakout underperforms in forex (47.1% win rate in our data) because currency pairs often fake-break then reverse. Add a confirmation requirement: the breakout candle must close with at least 1.5x the average candle body size. This eliminates many false signals without missing large moves. For currency pair-specific strategy details, our MACD forex guide covers momentum confirmation techniques that pair well with this setup.
Commodities: Proceed With Care
Commodities present the most challenging environment for Bollinger Band strategies. Upper band touch signals show only a 41.5% win rate in commodities — well below breakeven. Supply/demand shocks, seasonal patterns, and geopolitical events create discontinuous price moves that break technical setups entirely. Use the moving average Bollinger Bands strategy in commodities only during trending regimes confirmed by the 200 EMA slope. Avoid during range-bound, choppy conditions.
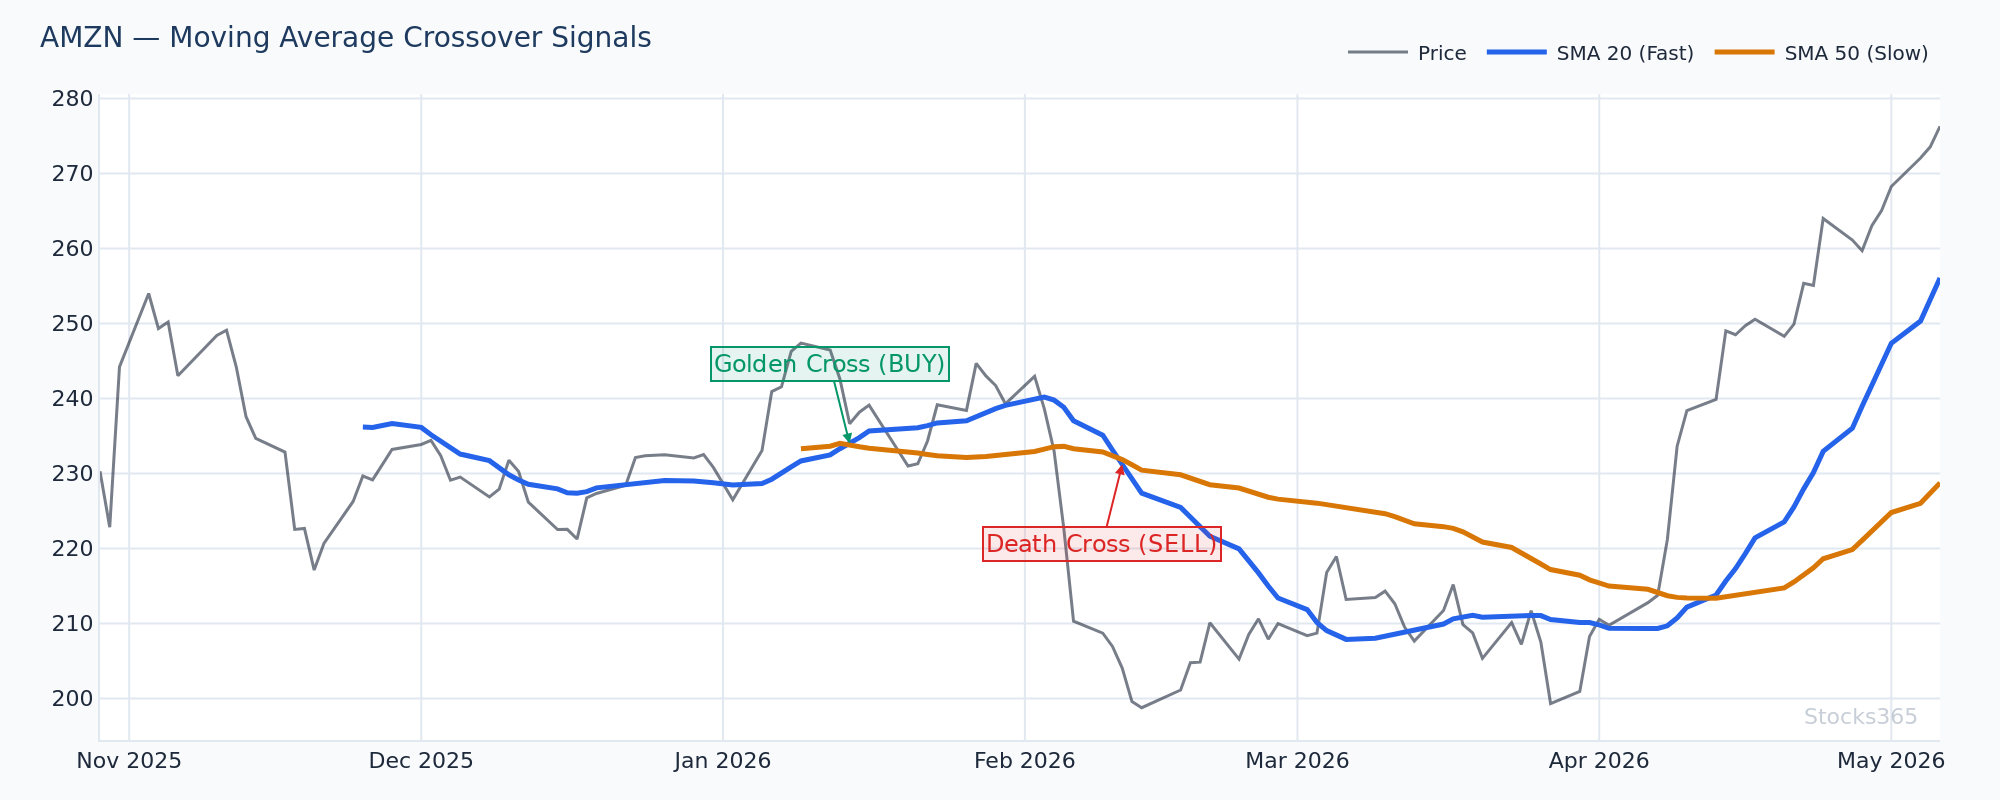
This chart illustrates how the relationship between the 50 EMA and 200 EMA creates a clear bull or bear market regime filter. When the 50 EMA crosses above the 200 EMA (golden cross) and both slope upward, long setups at the lower Bollinger Band carry significantly higher probability. When both MAs slope downward, lower band touches become traps. A flattening 200 EMA signals regime uncertainty — reduce position size accordingly.
Risk Management for Bollinger Bands + Moving Average Trading
A good setup with bad risk management still loses money. Full stop.
Position Sizing Based on Band Width
During squeeze phases, band width is narrow. If the trade moves against you, the stop loss is closer, meaning your percentage loss per unit is smaller. Size up slightly during squeezes. During expansion phases, bands are wide. The distance to your stop is larger. Size down to keep your dollar risk constant per trade. This dynamic sizing keeps your risk consistent regardless of market volatility state.
Where to Place Stop Losses
For squeeze breakout longs: stop below the lower Bollinger Band at the time of entry, or below the 50 EMA — whichever is closer. For trend continuation pullbacks: stop below the most recent swing low, which should align near or below the lower band. Never place a stop at an obvious round number or right at the band level — that's where institutional orders hunt retail stops.
Profit Targets Using Band Expansion
The Bollinger Band width at the time of breakout gives you a natural target. Project the band width from the breakout point to estimate a minimum first target. For trend continuation trades, the upper band (in bull setups) is your initial target. Trail stops using the middle band (20 SMA) on subsequent bars once the trade moves in your favor.
Combining With RSI for Higher-Probability Signals
Adding RSI as a third layer dramatically improves signal quality. Here's the exact combination that works:
- Squeeze Breakout + RSI: Enter the breakout only if RSI breaks above 55 (for longs) simultaneously. RSI below 50 on a supposed upside squeeze breakout is a red flag.
- Lower Band Touch + RSI: Strongest long setups occur when price touches the lower band AND RSI drops below 40 but stays above 30 in an uptrend. RSI below 30 with no divergence often means more downside ahead.
- Upper Band Reversal + RSI Divergence: The only high-quality fade setup is when price makes a new high touching the upper band but RSI makes a lower high. That's bearish divergence. Without it, don't fade the trend.
For RSI fundamentals and how to draw trendlines directly on RSI to spot early signals, see our guide: RSI Trendline Strategy: Master Drawing Lines for Better Signals.
New to RSI entirely? Start with RSI for Beginners: 5 Simple Rules to Start Trading Today before layering it with Bollinger Bands.
What to Watch For
- Bollinger Squeeze on tech stocks: When band width drops below the 20th percentile on daily charts of high-beta tech names, the subsequent expansion often produces a 2–3 ATR directional move. Wait for the first close outside the bands, confirm with 50 EMA direction, then enter.
- Lower band touch in confirmed uptrends: When price touches the lower Bollinger Band while above both the 50 EMA and 200 EMA, with RSI holding above 40, the bounce success rate is meaningfully higher than random. This is a clean trend continuation setup.
- Failed breakouts after squeeze: If price breaks above the upper band following a squeeze but closes back inside the bands within two candles on strong volume, treat it as a bull trap. This pattern often precedes a sharp move toward the lower band.
- Crypto squeeze setups with volume confirmation: Bollinger Squeezes in major crypto assets followed by a volume surge of 2x or more average daily volume on the breakout candle have historically preceded the strongest trending moves. Volume is the confirmation that separates real breakouts from head-fakes.
- Band width divergence across timeframes: If the daily chart shows a squeeze but the weekly chart shows bands already expanding, the daily breakout is more likely to stick. Multi-timeframe alignment amplifies the setup quality significantly.
How Stocks365 Uses This
Stocks365 Trust Score Integration
Bollinger Band positioning is one of 12+ technical factors that feed directly into the Stocks365 Trust Score system. Specifically, the system evaluates band width percentile (squeeze vs. expansion regime), price position relative to the middle band (20 SMA), and whether a squeeze breakout has occurred with directional alignment to the 50 EMA trend filter.
These inputs contribute to both the volatility regime score (is the market in a compression or expansion phase?) and the technical agreement score (how many indicators align in the same direction?). A squeeze breakout in a confirmed uptrend, confirmed by RSI above 55 and price above the 50 EMA, will register high agreement across multiple scoring dimensions simultaneously.
You can track these signals in real time through our signals dashboard, where each asset's Trust Score reflects the current Bollinger Band setup alongside momentum, volume, and trend indicators. Our research dashboard also shows historical win rates by setup type and asset class so you can calibrate confidence before entering any position.
Key Takeaways
Summary: Moving Average + Bollinger Bands Strategy
- The 20 SMA is the Bollinger Band middle line — it's already a moving average. Add a 50 EMA or 200 EMA as a separate trend filter.
- Three core setups: squeeze breakout (trend filter confirms direction), trend continuation pullback (bounce from 20 SMA in trending market), and band expansion reversal (requires RSI divergence — don't trade without it).
- Bollinger Squeeze Breakouts show a 51.8% win rate in crypto versus 47.1% in forex across 14,266 backtested signals — asset class selection matters.
- Never fade upper band touches without RSI divergence and a counter-trend moving average. Our data shows a 49.6% win rate and 0.88 profit factor for raw upper band fades — that's a losing strategy at scale.
- RSI above 55 on squeeze breakout entries, RSI holding 40+ on pullback entries. These filters cut noise significantly.
- Size positions based on band width: smaller size during expansion (wider stops), larger size during squeeze (tighter stops).
- Worst asset class for these setups: commodities. Best: crypto. Trade accordingly.