

What Is RSI and Why Should Beginners Care?
If you've ever wondered how professional traders know when a stock is running out of steam — or building up for a breakout — the Relative Strength Index (RSI) is one of their most reliable tools. And the best part? It's surprisingly approachable for beginners.
RSI is a momentum oscillator that measures the speed and magnitude of recent price changes. It produces a value between 0 and 100, giving you a clear, visual read on whether a stock is potentially overbought (overvalued in the short term) or oversold (undervalued in the short term). For anyone just starting out in technical analysis, RSI offers an immediate edge without requiring years of chart-reading experience.
Before we dive into the five rules, it helps to understand the basics. If you want a thorough foundation, check out What Is RSI? The Complete Beginner's Guide — it covers everything from the indicator's history to how it fits into a modern trading strategy.
In this guide, we're cutting straight to the practical rules that beginners can apply immediately — with real examples, clear visuals, and zero fluff.
How RSI Is Calculated (The Short Version)
You don't need to memorize the formula to trade RSI effectively, but understanding what drives it makes you a much better trader. RSI compares the average gains versus average losses over a set period — typically 14 periods by default.
The core idea: if a stock has been closing up more than down over the past 14 candles, RSI climbs toward 100. If it's been closing down more than up, RSI falls toward 0. This simple logic is what makes RSI so intuitive once you see it in action.
For those who want to understand the math behind it, our detailed breakdown at How RSI Is Calculated: Formula Explained Step by Step walks through every component with examples. Understanding the calculation also helps you choose the right RSI settings for different market conditions — something we'll touch on in Rule 3.
The 5 Simple RSI Rules Every Beginner Needs
Rule 1: Learn the Two Critical Threshold Levels
The most fundamental RSI rule is also the most important to internalize: 70 is overbought, 30 is oversold.
- RSI above 70: The stock has been rising rapidly. It may be overbought, meaning a pullback or consolidation could follow.
- RSI below 30: The stock has been falling sharply. It may be oversold, meaning a bounce or recovery could be approaching.
- RSI between 40–60: Neutral territory. The market is undecided — momentum isn't strongly in either direction.
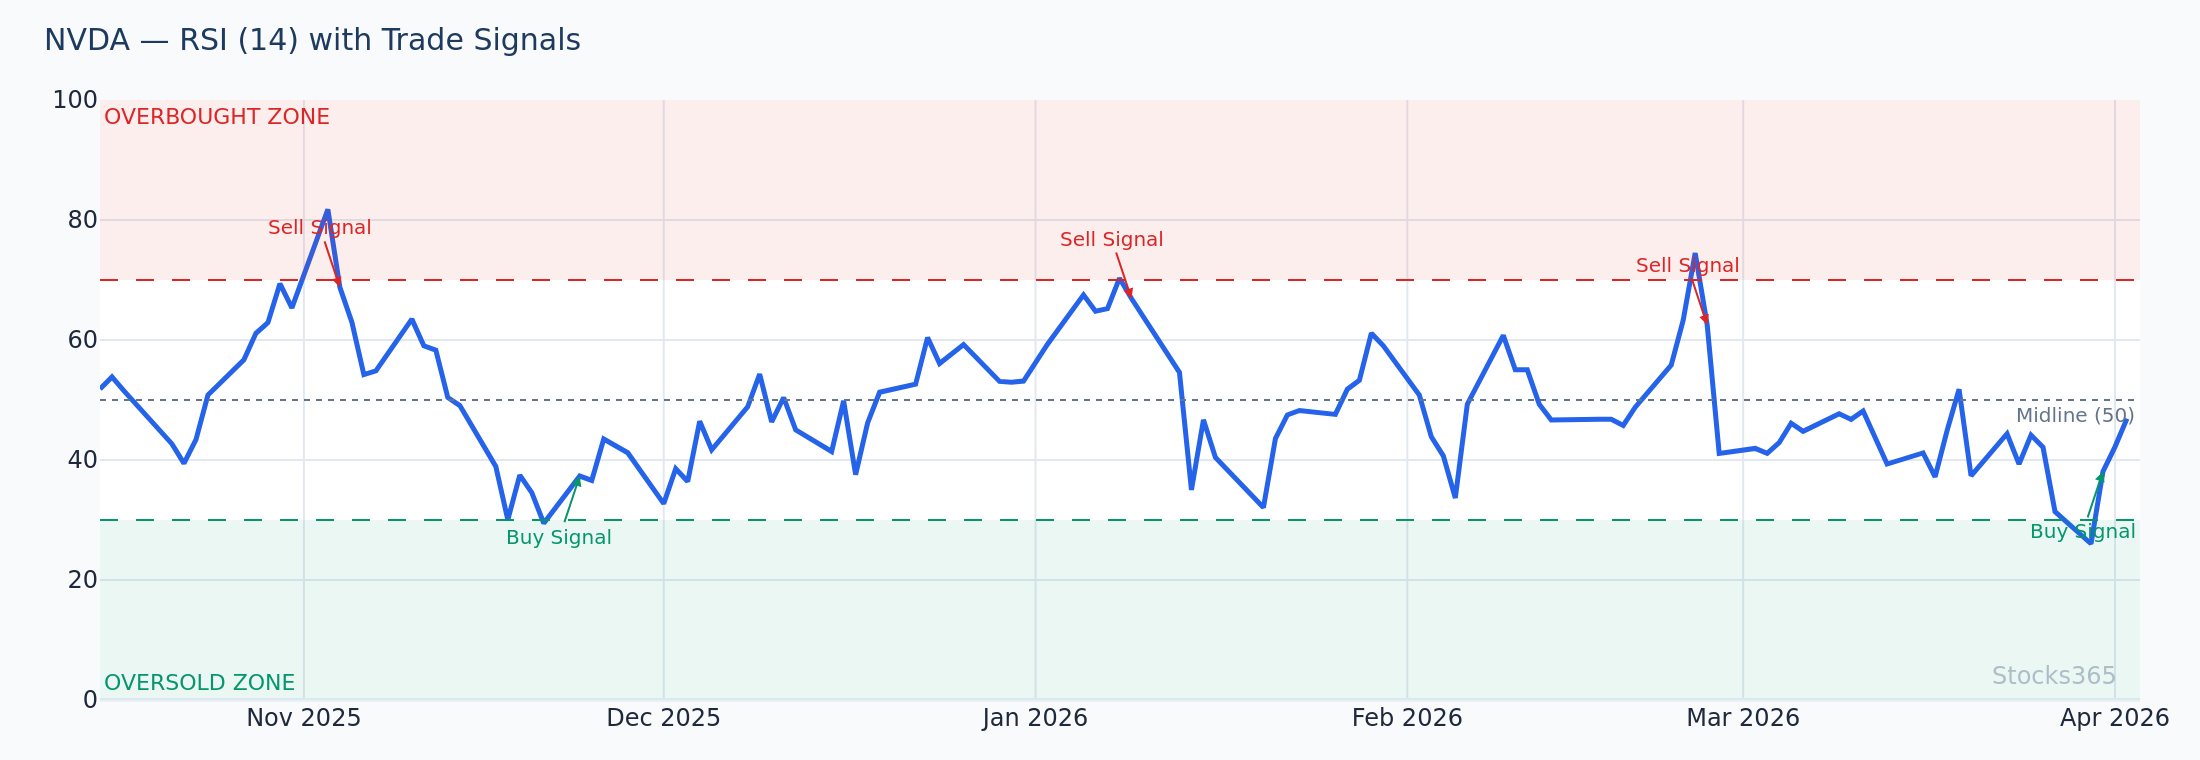
Practical Example: Imagine NVDA is trading at $1,150 and RSI hits 78. This tells you momentum has been overwhelmingly bullish in recent sessions. A disciplined beginner uses this signal to avoid chasing the move — or to watch for a short-term pullback entry rather than buying at the peak.
"RSI doesn't tell you what a stock will do. It tells you what it has been doing — and whether that pace is sustainable."
Want a deep dive into these signals and how to apply them across different markets? Our guide on RSI Overbought and Oversold Levels: Master the Signals covers advanced nuances that even experienced traders miss.
Rule 2: Never Trade RSI Signals in Isolation
This is the rule that separates traders who profit from RSI and those who get burned by it. RSI is a confirmation tool, not a standalone buy/sell signal.
Here's the trap many beginners fall into: They see RSI drop below 30 on a stock like TSLA and immediately buy, assuming a bounce is coming. But in a strong downtrend, RSI can stay below 30 for days — even weeks — while the price continues falling. This is called a momentum trend, and ignoring it is one of the most common beginner mistakes.
What to combine RSI with:
- Price action: Look for candlestick patterns like hammers or bullish engulfing near key support levels when RSI is oversold.
- Moving averages: If the 50-day moving average is pointing upward and RSI dips to 35, that's a much stronger setup than RSI at 35 in a freefall.
- Volume: Oversold RSI on high volume suggests genuine selling pressure. On low volume, it may simply be a light pullback.
- Support and resistance: RSI hitting 30 at a historically strong support level is a powerful combination.
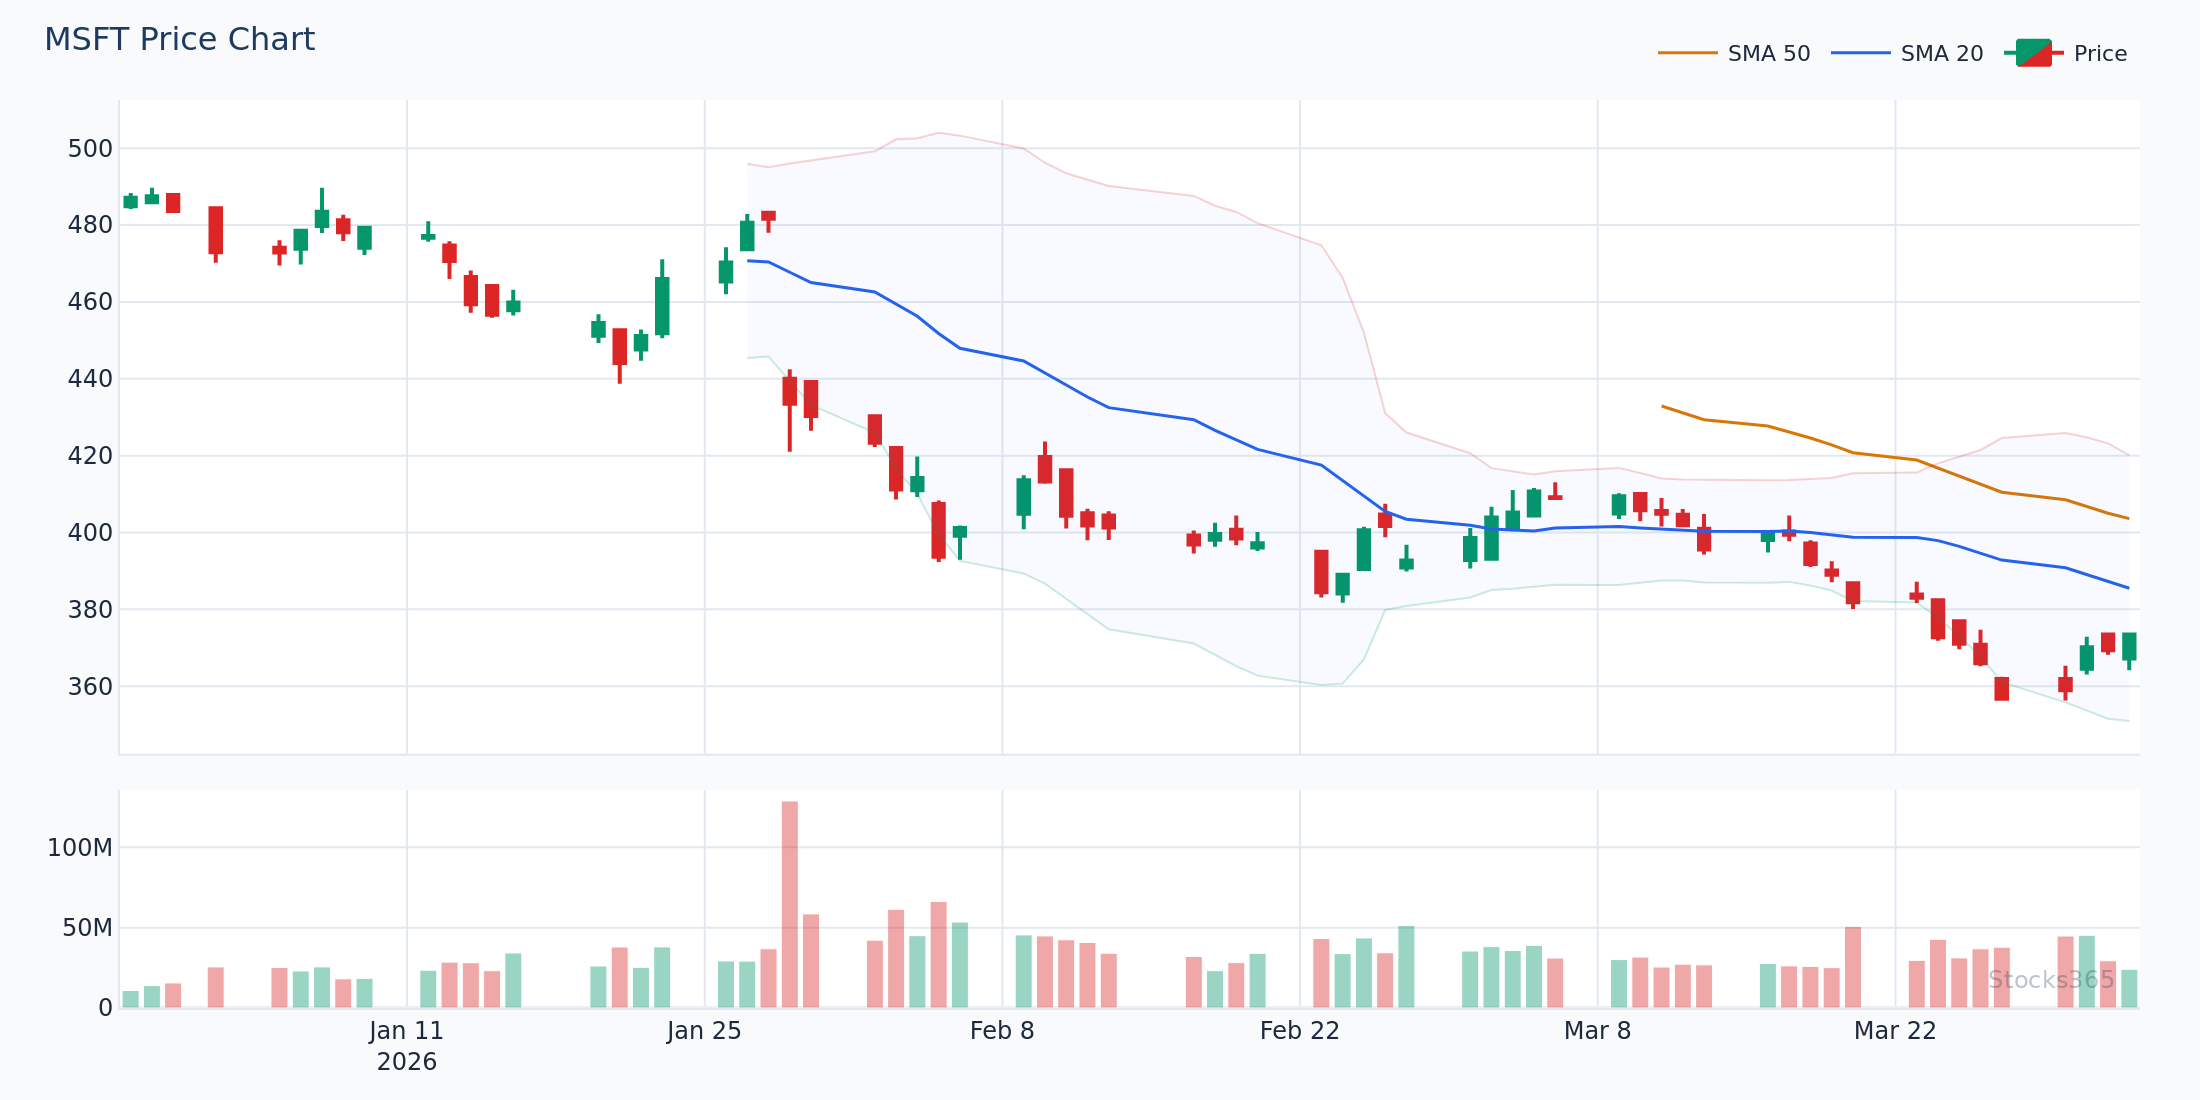
Practical Example: MSFT is trading at $420, RSI is at 32, and the price has just touched its 200-day moving average for the first time in six months. That confluence of signals — oversold RSI at a major long-term support — is a compelling setup. RSI alone at 32 with price in freefall is not.
The Ultimate Step-by-Step Guide to Using RSI in Trading covers exactly how to build these multi-signal strategies in a structured, repeatable way.
Rule 3: Match Your RSI Settings to Your Trading Style
The default 14-period RSI is a great starting point, but it's not one-size-fits-all. Adjusting your RSI period changes how sensitive it is to price movements — and that sensitivity should match how you trade.
- Short-term traders (day traders, scalpers): A lower period like RSI(7) or RSI(9) creates more signals that respond faster to price moves. More signals also means more false signals, so discipline is critical.
- Swing traders: The standard RSI(14) is your best friend. It balances sensitivity and reliability across 2–10 day holds.
- Position traders and investors: RSI(21) or even RSI(25) smooths out short-term noise and highlights only the most significant momentum shifts — ideal for weekly chart analysis.
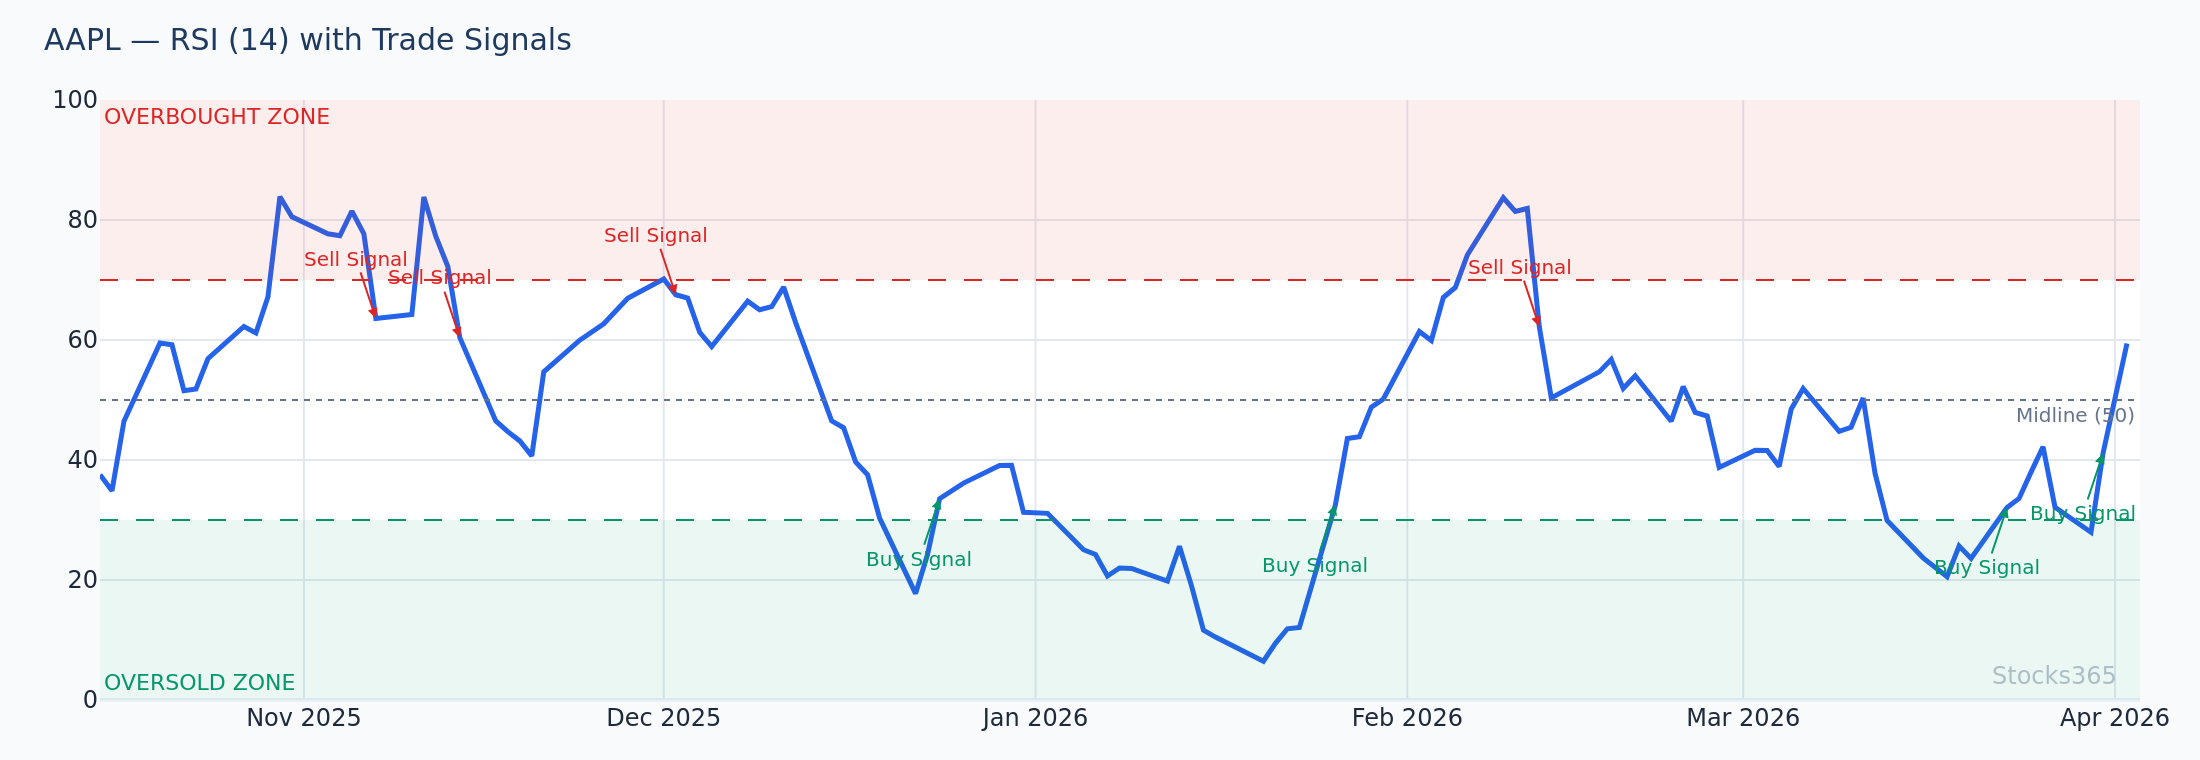
Practical Example: A day trader watching AAPL on a 15-minute chart might use RSI(7) to catch quick intraday reversals. The same trader using RSI(14) on that timeframe would find signals arriving too late to act on effectively.
For a comprehensive breakdown of how period selection impacts your results across different asset classes, see our guide on RSI Settings: Master the Best Period for Your Strategy.
Rule 4: Watch for RSI Divergence — It's Your Early Warning System
Once you're comfortable with the basics, RSI divergence is the next skill that genuinely elevates your trading. It's also one of the most powerful signals available to beginners because it often appears before a trend reversal — giving you early positioning opportunities that most traders miss.
What is RSI divergence?
- Bullish Divergence: Price makes a new lower low, but RSI makes a higher low. This suggests weakening selling momentum — a potential reversal upward is forming.
- Bearish Divergence: Price makes a new higher high, but RSI makes a lower high. This suggests weakening buying momentum — a potential pullback or reversal downward is approaching.
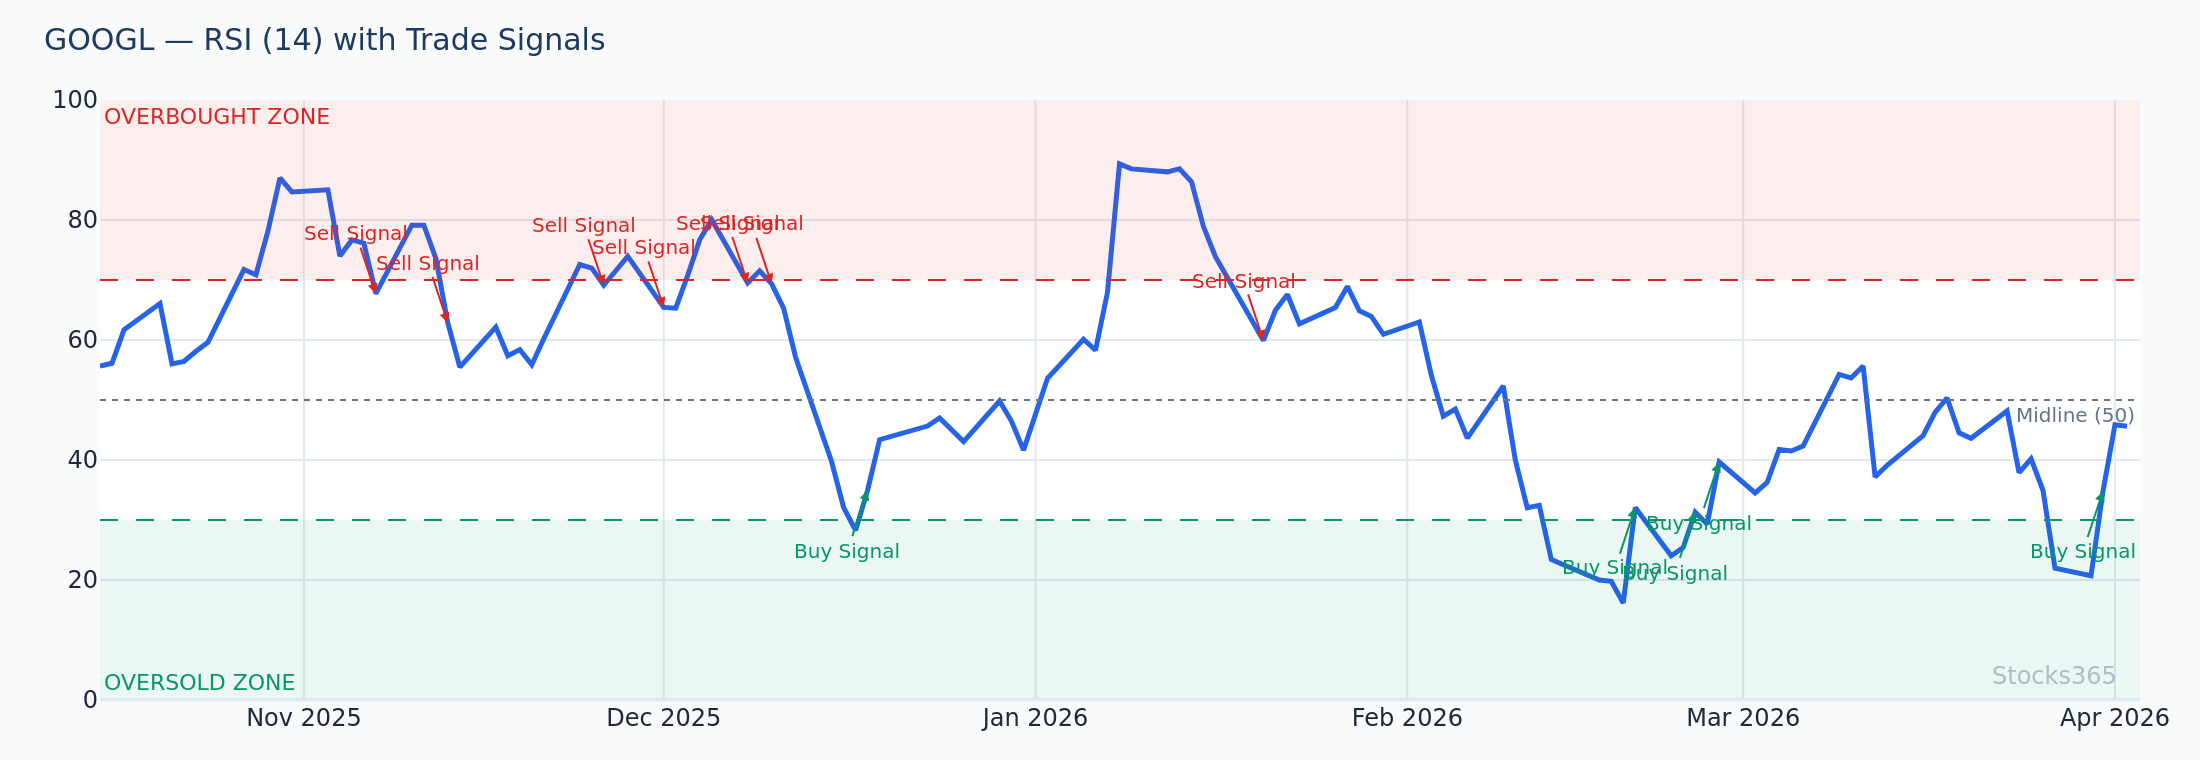
Practical Example: GOOGL has been in a downtrend, dropping from $185 to $162 over three weeks. Then it makes a new low at $158 — but RSI only dips to 36, compared to 28 on the previous low. That's bullish divergence. The sellers are losing power. A patient beginner who spots this has a high-probability entry opportunity developing before price actually reverses.
This is exactly why divergence analysis is considered a professional-grade skill despite being learnable by beginners. For a complete walkthrough of both bullish and bearish patterns, explore our article on RSI Divergence Explained: Master Bullish & Bearish Signals.
And if you're ready to go even deeper, Hidden RSI Divergence reveals a more advanced variation that most retail traders never learn — but institutional traders watch closely.
Rule 5: Define Your Risk Before You Enter Any Trade
This final rule has nothing to do with RSI levels or calculations — but it's the one that determines whether you're still trading six months from now. RSI can give you a high-probability signal, but no indicator is right 100% of the time. Risk management is what keeps a string of losing trades from becoming a catastrophe.
Here's a simple beginner framework for RSI-based trades:
- Entry: RSI signal confirmed by at least one other factor (support level, moving average, volume).
- Stop-loss: Placed below the most recent swing low (for long trades) or above the recent swing high (for short trades). Never skip this step.
- Target: Aim for a risk-to-reward ratio of at least 1:2. If you're risking $5 per share, your target should be at least $10 gain per share.
- Position size: Risk no more than 1–2% of your total trading capital on a single trade.
Practical Example: You identify a bullish RSI divergence on AMZN at $195. RSI hit 29 on the second low but price bounced off strong support at $193. You enter at $196, set your stop at $192 (risking $4/share), and target $204 (gaining $8/share) — a clean 1:2 risk-reward setup using RSI as your catalyst.
Professional platforms like Stocks365's signals dashboard help beginners streamline this process by providing pre-screened setups with built-in trust scores, so you're not hunting for signals manually across hundreds of charts. Each signal — like those available for AAPL — comes with context that helps you evaluate quality before committing capital.
RSI vs. Other Momentum Indicators: What Beginners Should Know
As you develop your skills, you'll encounter other momentum indicators alongside RSI. The most common comparison is RSI versus the Stochastic Oscillator. Both measure momentum, but they do it differently and excel in different market conditions.
In brief: RSI tends to work better in trending markets, while the Stochastic Oscillator often provides more useful signals in ranging, sideways markets. Many experienced traders use both together. For a detailed comparison that helps you decide which fits your style, read our guide on RSI vs Stochastic Oscillator: The Essential Guide.
Common RSI Mistakes Beginners Make (And How to Avoid Them)
Understanding the rules isn't enough if you're simultaneously making these classic errors:
- Treating every RSI cross of 70/30 as a trade signal: In strong trends, RSI can stay overbought or oversold for extended periods. Wait for price confirmation.
- Ignoring the trend direction: A bearish RSI divergence in a powerful bull market is far less reliable than in a stock already showing distribution. Context is everything.
- Changing settings too frequently: Stick with one RSI period long enough to understand how it behaves on your preferred timeframe before experimenting.
- Overtrading low-quality signals: Not every RSI signal is worth trading. The Stocks365 trust score system helps filter out weak setups by evaluating signals across multiple confirming factors — giving beginners a quality benchmark before they develop their own filtering instincts.
- Forgetting earnings and news events: RSI cannot predict gap moves driven by earnings surprises or major news. Always check the economic calendar before entering positions.
Putting It All Together: A Beginner's RSI Trading Checklist
Before entering any RSI-based trade, run through this quick checklist:
- ✅ Is RSI giving a clear signal (above 70, below 30, or showing divergence)?
- ✅ Is at least one other indicator or price-action signal confirming?
- ✅ Is the RSI period appropriate for my trading timeframe?
- ✅ Have I identified my entry, stop-loss, and profit target?
- ✅ Am I risking no more than 1–2% of my capital on this trade?
- ✅ Are there any upcoming earnings or major news events to consider?
If you can check all six boxes, you're operating with the discipline that separates consistently profitable traders from the rest.
Key Takeaways
- RSI measures momentum on a 0–100 scale. Above 70 signals overbought conditions; below 30 signals oversold.
- Never trade RSI alone — always confirm with price action, moving averages, volume, or support/resistance levels.
- Match your RSI period to your style: RSI(7-9) for short-term, RSI(14) for swing trading, RSI(21+) for position trading.
- RSI divergence is your early warning system — it often signals reversals before price confirms them.
- Risk management is non-negotiable. Use stop-losses, target 1:2+ risk-reward ratios, and never risk more than 1–2% per trade.
- Platforms like Stocks365 can accelerate your learning by providing quality-filtered RSI signals with trust scores across thousands of stocks.
Frequently Asked Questions
What is the best RSI setting for beginners?
The default 14-period RSI is the best starting point for beginners. It's widely used, well-tested across decades of market data, and provides a reliable balance between sensitivity and accuracy. Once you're comfortable interpreting signals with RSI(14), you can experiment with shorter periods like RSI(9) for faster signals or longer periods like RSI(21) for smoother readings on higher timeframes.
Can RSI be used for stocks, crypto, and forex?
Yes — RSI works across virtually all liquid financial markets including stocks, ETFs, cryptocurrencies, forex pairs, and futures. The core logic of measuring momentum is universal. However, the optimal settings and threshold levels may vary slightly. For example, crypto markets tend to be more volatile, so some traders adjust the overbought level to 80 and oversold to 20 to reduce false signals in those conditions.
How accurate is RSI for predicting price reversals?
RSI is a valuable tool, but no indicator predicts reversals with certainty. Studies suggest RSI signals — especially when confirmed by additional factors — can have accuracy rates in the range of 60–70% in appropriate market conditions. The key is using RSI as part of a broader strategy rather than relying on it alone. Combining RSI with divergence analysis, support/resistance levels, and sound risk management significantly improves your overall trading outcomes.
What does it mean when RSI stays above 70 for a long time?
When RSI stays above 70 for an extended period, it typically indicates a strong uptrend with persistent buying momentum. This is common in breakout situations or during earnings-driven rallies. Rather than immediately shorting or selling, experienced traders wait for RSI to break back below 70 as a signal that momentum is fading. Sustained high RSI is not automatically a sell signal — it can be a sign of strength.
How is RSI different from MACD?
RSI and MACD both measure momentum, but they do it differently. RSI compares recent gains to recent losses and produces a value between 0 and 100, making it easy to identify overbought and oversold levels. MACD measures the relationship between two moving averages and is better suited to identifying the direction and strength of a trend. Many traders use both together — RSI to gauge momentum extremes and MACD to confirm trend direction before entering a trade.