
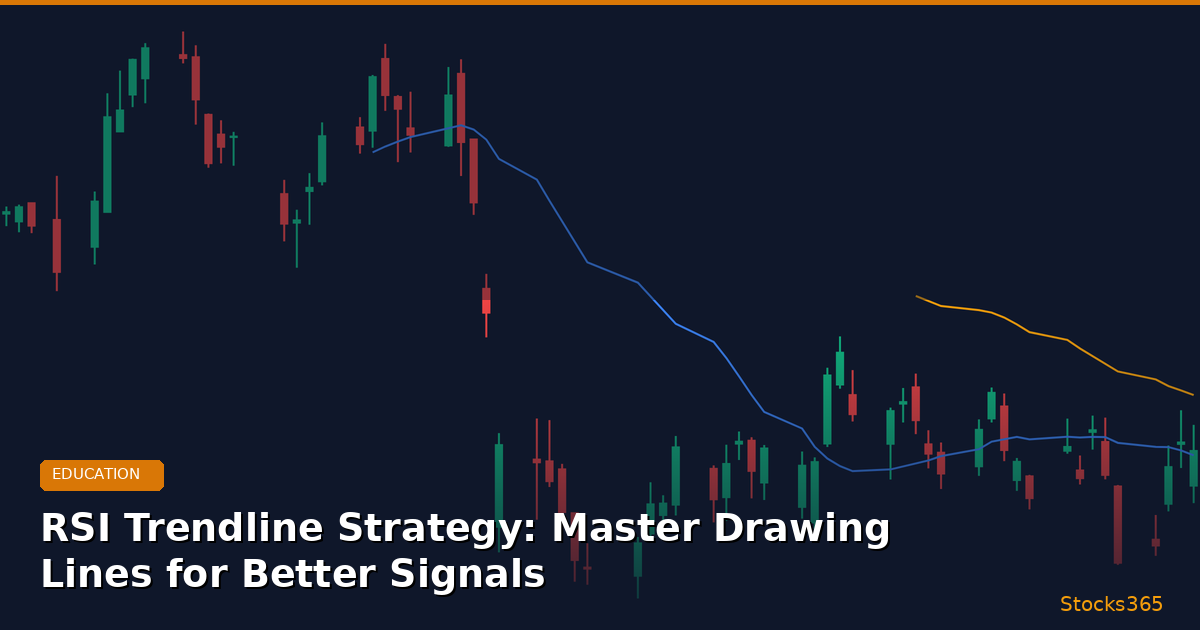
Why Most Traders Are Using RSI Wrong
Most traders use RSI the same way: wait for it to cross above 30 or below 70, then act. It's a reasonable starting point, but it leaves a lot of high-probability signals on the table. The RSI trendline strategy is different — it treats the RSI indicator itself as a chart, drawing trendlines directly on the oscillator to catch momentum shifts before price confirms them.
This technique is one of the most underused tools in technical analysis. When a trendline drawn on the RSI breaks, it often precedes a breakout or reversal in price by several candles — giving traders a critical head start. If you already understand what RSI is and how it works, this article will take your application of it to a professional level.
Let's break down exactly how to draw RSI trendlines, what they mean, and how to build a complete trading strategy around them.
What Is an RSI Trendline and How Does It Work?
An RSI trendline is simply a line drawn on the RSI oscillator panel — connecting a series of highs or lows on the RSI itself, not on the price chart. Just like drawing support and resistance lines on a price chart, you can draw support and resistance lines on RSI to identify when momentum is shifting direction.
The core insight is this: RSI often breaks its trendline before price breaks its own trendline. This makes RSI trendline breaks one of the earliest leading signals available to technical traders.
The Logic Behind RSI Trendline Breaks
RSI measures the speed and magnitude of price movements. When RSI is making a series of higher lows (even as price consolidates), it tells you that buying momentum is building beneath the surface. Draw a trendline connecting those higher lows. When price finally pushes and RSI breaks above that trendline, momentum has shifted — often 2 to 5 candles before the price chart confirms the breakout.
The reverse is equally true. A series of lower highs on RSI during a rally suggests weakening bullish momentum. A break below that RSI trendline signals the rally is losing steam — a potential shorting opportunity or exit signal.
To fully appreciate why this works, it helps to understand how RSI is calculated at the formula level. The oscillator is built on average gains versus average losses, so its shape reflects the real-time balance of power between buyers and sellers.
How to Draw RSI Trendlines Correctly
Drawing RSI trendlines is an art that becomes intuitive with practice. Here are the rules that professional traders follow:
Step 1 — Identify Significant Swing Points on the RSI
Just as you would with price action, look for clear swing highs and swing lows on the RSI panel. A swing high on RSI is a peak where the RSI reversed downward. A swing low is a trough where RSI reversed upward. These are your anchor points.
Rule of thumb: Use at least two confirmed swing points to draw a trendline. Three or more points make the line significantly more reliable.
Step 2 — Connect the Swing Points
For a bullish RSI trendline (support), connect a series of rising swing lows. For a bearish RSI trendline (resistance), connect a series of falling swing highs. The line should touch or come very close to these pivot points without cutting through the RSI line itself.
Step 3 — Watch for the Break
A trendline break occurs when the RSI closes decisively on the other side of the line. Ideally, you want to see the RSI candle (or bar, depending on your charting style) close through the trendline with some conviction — not just a wick touch. On a 4-hour chart of NVDA, for example, if RSI has been forming higher lows between 45 and 55 over 10 days and then breaks above that rising trendline to reach 62, that's a meaningful momentum signal.
Step 4 — Confirm with Price Action
Never trade the RSI trendline break in isolation. Look for confluence:
- Is price approaching a key support or resistance level?
- Is there a candlestick reversal pattern forming (pin bar, engulfing, etc.)?
- Is volume increasing on the break?
- Are other indicators confirming the move?
The Stocks365 Trust Score system is useful here — signals with higher Trust Scores are backed by multiple layers of confirmation, which aligns perfectly with the confluence-based approach required for RSI trendline trading. Check current high-confidence setups on the Stocks365 signals dashboard.
RSI Trendline Breakout Strategy: A Practical Trading Example
Let's walk through a concrete example using TSLA on the daily chart.
Scenario: Bullish RSI Trendline Break on TSLA
Suppose TSLA has been in a consolidation phase, trading between $280 and $310 for three weeks. On the RSI panel (14-period), you observe the following swing lows: RSI at 38, then 42, then 46 — a clear series of higher lows. You draw a rising trendline connecting these three points.
On day 18 of consolidation, TSLA's RSI rises sharply from 46 to 58, decisively breaking above the RSI trendline. Price at this point is at $298 — still within the consolidation range. But the RSI trendline break tells you momentum has shifted decisively to the upside.
Entry: You enter long at $299 on the next candle open, just after the RSI trendline break closes above the line.
Stop Loss: Placed at $286, just below the recent consolidation low.
Target: The next key resistance at $325, identified from prior price structure.
Two days later, TSLA breaks above $310 with volume confirmation — the price chart finally confirms what the RSI trendline showed two days earlier. Your early entry means a better risk-to-reward ratio: approximately 1:2 on this trade.
You can monitor setups like this in real time on the TSLA signal page on Stocks365.
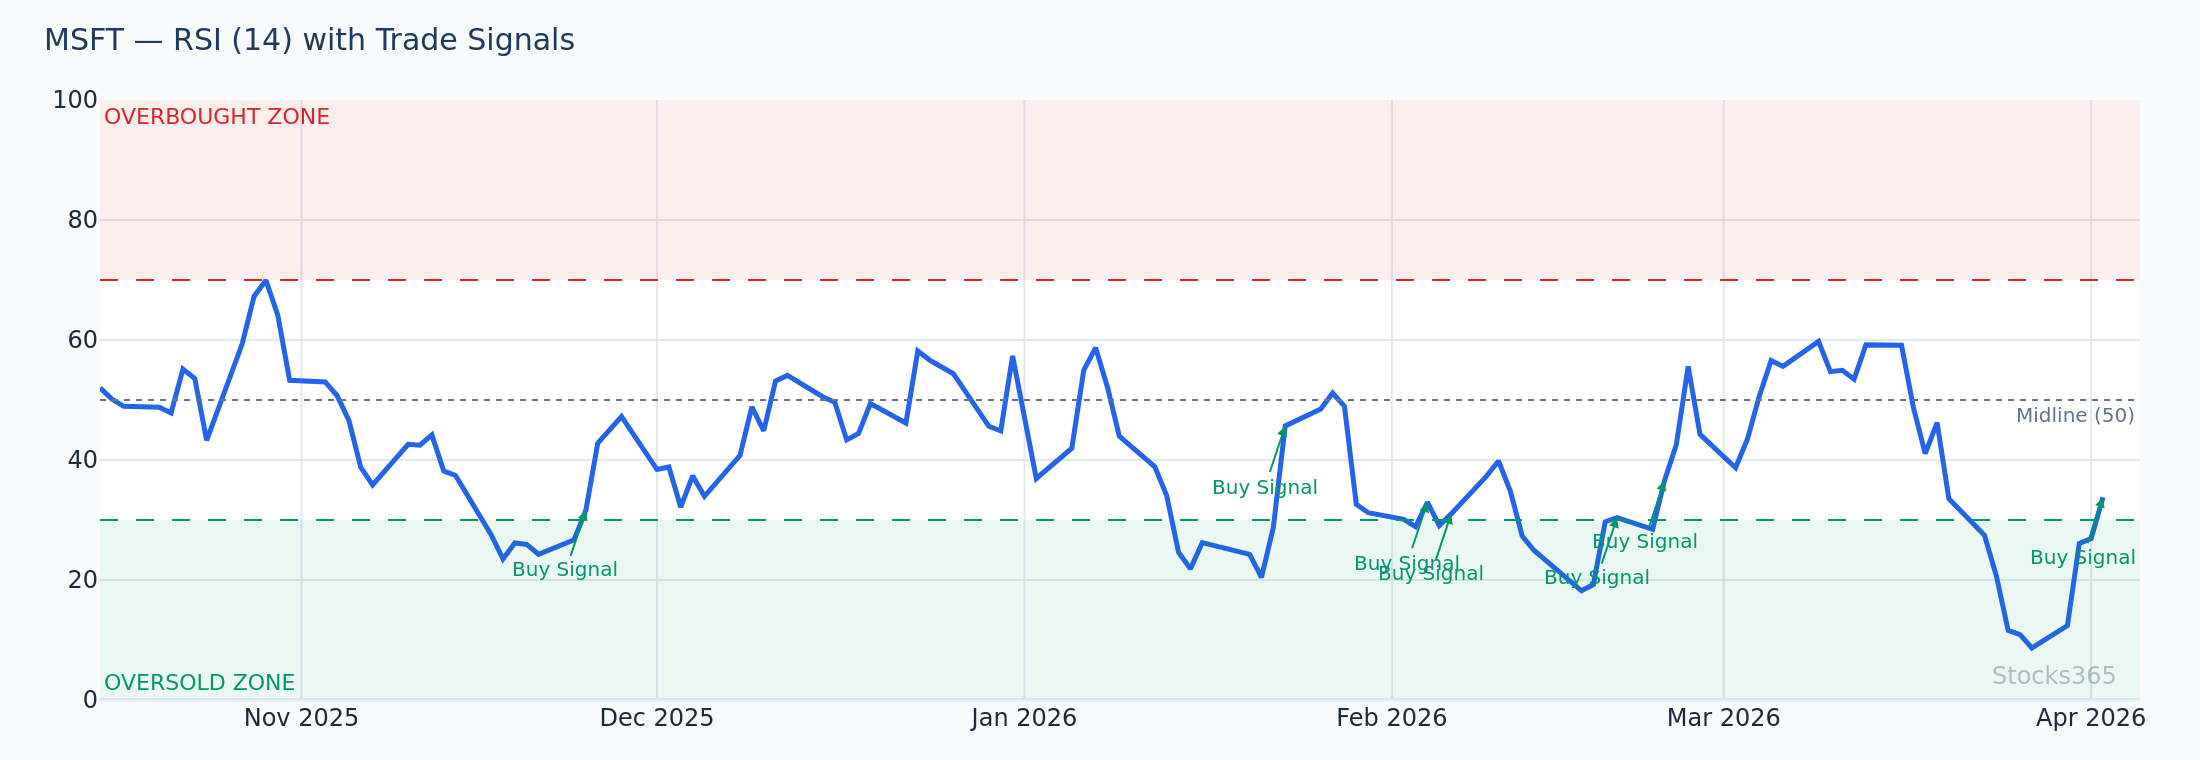
Scenario: Bearish RSI Trendline Break on MSFT
Now consider a bearish example. MSFT has been rallying from $390 to $430 over four weeks. On the RSI panel, you notice swing highs of 72, 68, and 64 — a series of lower highs indicating weakening momentum even as price climbs. You connect these three RSI peaks with a descending resistance trendline.
On the 22nd trading day, after a small price push to $432, RSI only reaches 61 — unable to reclaim its prior high. The RSI then falls sharply, breaking below the descending trendline. Price is still near its highs at $428.
Signal: Bearish RSI trendline break — exit longs or consider a short position.
Three days later, MSFT drops to $412 as broader selling pressure arrives. The RSI trendline gave you the warning several sessions before the price breakdown became obvious to most participants.
RSI Trendlines vs. Traditional RSI Signals
How do RSI trendlines compare to the standard overbought/oversold approach? Both have their place, but they serve different purposes.
Overbought/Oversold Levels
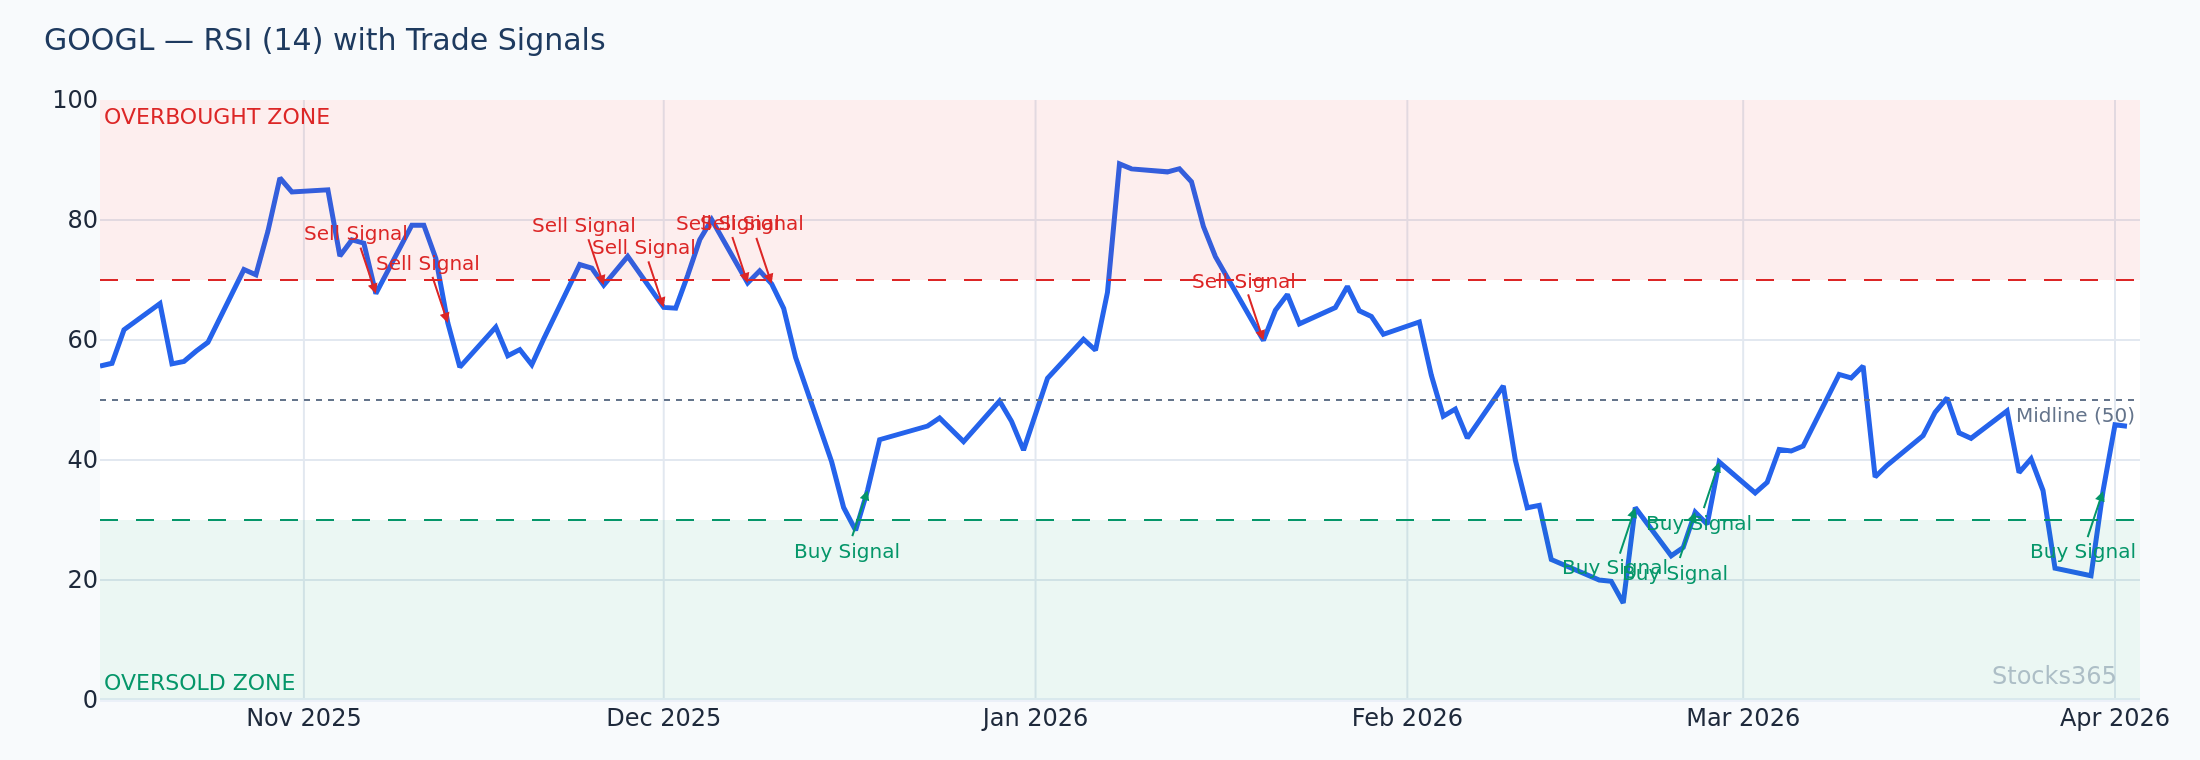
The classic RSI overbought and oversold signals (above 70 = overbought, below 30 = oversold) are reactive. They tell you the market has already moved significantly. In strong trending markets, RSI can remain overbought for extended periods, causing premature exits or false reversal signals.
RSI Trendlines Are Proactive
RSI trendlines identify momentum changes before extreme levels are reached. In the TSLA example above, the bullish RSI trendline break happened at RSI 58 — nowhere near overbought territory. A trader relying only on overbought/oversold would have missed this early signal entirely.
Best practice: Use both approaches together. An RSI trendline break near an overbought or oversold level carries significantly higher probability than either signal alone.
RSI Trendlines vs. RSI Divergence
RSI divergence is another powerful technique — comparing RSI direction to price direction to spot potential reversals. RSI trendlines and divergence are complementary, not competing strategies.
In fact, some of the highest-probability setups occur when:
- RSI divergence is present (price makes new high, RSI doesn't)
- AND the RSI trendline breaks in the reversal direction
This double confirmation dramatically increases signal reliability. For advanced traders, pairing this with hidden RSI divergence can add another layer of precision to trend-continuation entries.
RSI Trendline Strategy: Best Settings and Timeframes
Which RSI Period Works Best for Trendlines?
The standard 14-period RSI works well for most RSI trendline applications. However, the optimal setting depends on your trading style. For detailed guidance on RSI period settings, shorter periods (9-11) produce more swing points and thus more trendline opportunities, while longer periods (21-25) produce smoother RSI with fewer but more significant trendline breaks.
- Day traders (5m–15m charts): RSI 9 or 11 — more signals, faster breaks
- Swing traders (4H–Daily charts): RSI 14 — the sweet spot for balance
- Position traders (Weekly charts): RSI 21 — fewer but more powerful signals
Best Timeframes for RSI Trendline Trading
The daily and 4-hour charts produce the most reliable RSI trendline signals. On timeframes shorter than 1 hour, noise increases and trendline breaks become less meaningful. On the weekly chart, trendline breaks are rare but highly significant — often signaling major multi-week or multi-month moves.
Advanced RSI Trendline Techniques
RSI Channels
Just as price can trade within a channel, RSI can also form parallel channels. If you can draw both an upper resistance trendline and a lower support trendline on RSI, you have an RSI channel. Price tends to oscillate between these boundaries, and breaks out of the RSI channel often signal the beginning of a new trend phase.
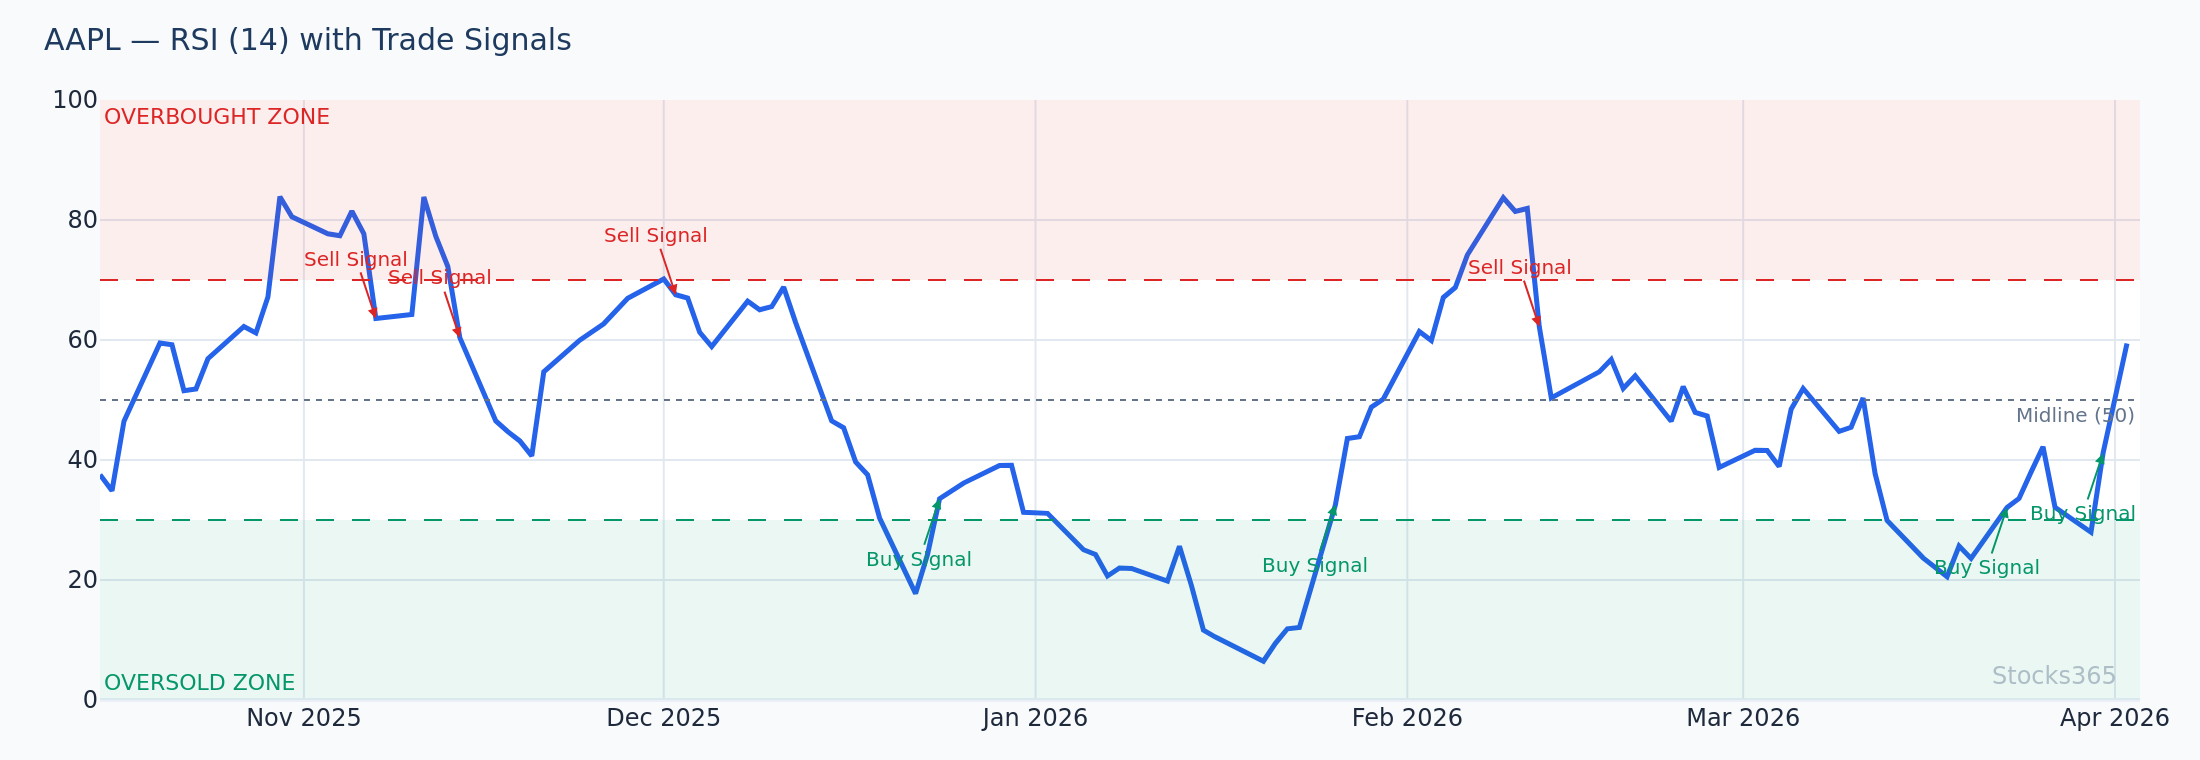
On AAPL's daily chart, if RSI has been oscillating between a floor trendline at 45 and a ceiling trendline at 65 for six weeks, a break above 65 (ceiling trendline break) suggests a new bullish impulse is beginning. Monitor live setups like this on the AAPL signals page.
RSI Trendline Retests
Like price trendlines, RSI trendlines often get retested after a break. In a bullish scenario, after RSI breaks above a descending resistance trendline, it may pull back to retest that line from above (now acting as support) before continuing higher. This retest offers a secondary entry with a tighter stop loss.
Waiting for the retest reduces your risk compared to entering on the initial break, though you may miss some fast-moving setups. Which approach you use depends on your risk tolerance and trading style.
Multiple Timeframe RSI Trendline Analysis
Combining RSI trendlines across timeframes adds significant precision. If the weekly RSI has just broken above a multi-month descending trendline, and the daily RSI also breaks a shorter-term trendline in the same direction, the confluence of both signals on different timeframes creates a very high-probability setup.
For a complete understanding of how to implement multi-timeframe analysis, our ultimate guide on using RSI in trading covers this in depth.
Common Mistakes When Drawing RSI Trendlines
Even experienced traders make these errors. Avoid them to keep your RSI trendline analysis clean and reliable:
- Forcing trendlines: Don't stretch lines to connect points that don't naturally align. If three clean pivot points don't exist, there's no valid trendline yet.
- Ignoring the angle: Extremely steep RSI trendlines break frequently and produce false signals. Shallow, gradual trendlines are more reliable.
- Trading the break before the candle closes: Always wait for the RSI to close beyond the trendline, not just touch or wick through it.
- Using RSI trendlines in isolation: Always require price action or volume confirmation. An RSI trendline break without any price confirmation is a low-quality signal.
- Over-drawing: More trendlines don't mean more accuracy. Keep your RSI panel clean with only the 1-2 most significant current trendlines.
If you're comparing RSI to other momentum oscillators and wondering which produces better trendline signals, the RSI vs Stochastic comparison guide offers useful perspective — RSI generally produces cleaner swing structure for trendline drawing.
Key Takeaways
RSI Trendline Strategy — Summary:
- 📈 RSI trendlines often break before price trendlines — giving you an early signal with better risk-to-reward.
- ✏️ Draw trendlines by connecting RSI swing highs (resistance) or swing lows (support) — use at least 2 points, prefer 3+.
- ✅ Wait for a confirmed close through the RSI trendline — don't act on wicks or touches alone.
- 🔗 Combine with divergence, price action, and volume — confluence dramatically improves reliability.
- ⚙️ RSI 14 on daily and 4H charts produces the best balance of signal frequency and quality.
- 🔄 Watch for retests — broken RSI trendlines often flip from resistance to support (or vice versa), offering secondary entries.
- 🚫 Avoid common mistakes: forcing lines, trading before close confirmation, and using trendlines in isolation.
Frequently Asked Questions
What is an RSI trendline?
An RSI trendline is a line drawn directly on the RSI oscillator panel, connecting a series of swing highs or swing lows on the RSI indicator itself. It identifies momentum trend direction and potential breakouts — often signaling shifts in price direction before the price chart itself confirms the move.
How do I draw a trendline on RSI?
To draw an RSI trendline, identify at least two (preferably three) clear swing pivot points on your RSI panel — either swing lows for a rising support trendline or swing highs for a descending resistance trendline. Connect these points with a straight line. The line should touch or closely approach each pivot without cutting through the RSI plot. Monitor the line for a decisive close-through break as your signal trigger.
Is an RSI trendline break a buy or sell signal?
It depends on the direction of the break. If RSI breaks above a descending resistance trendline (bearish RSI trendline), it's a bullish signal indicating momentum is shifting upward. If RSI breaks below a rising support trendline (bullish RSI trendline), it's a bearish signal suggesting momentum is fading. Always confirm with price action before acting.
How is an RSI trendline different from RSI divergence?
RSI divergence compares the direction of RSI to the direction of price — looking for disagreements that suggest reversals. An RSI trendline focuses solely on the structure within the RSI panel, identifying momentum acceleration or deceleration through trendline breaks. Both techniques are complementary, and the most powerful setups occur when both signals confirm the same direction simultaneously.
Which timeframe is best for RSI trendline trading?
The daily and 4-hour timeframes offer the best balance of signal quality and frequency for most traders using the RSI trendline strategy. The 14-period RSI setting works well on these timeframes. Day traders may prefer the 1-hour or 15-minute chart with a 9-period RSI for more frequent setups, while longer-term traders can use weekly charts for major momentum trend signals.