
Why Apple's 2022–2023 Price Action Is the Perfect Bollinger Bands Stock Example
Apple doesn't lie. It's the most-watched stock on the planet — heavy volume, institutional participation, and continuous coverage from every major desk. That makes it an ideal case study for Bollinger Bands, because every signal it generates is clean, tested under real conditions, and impossible to dismiss as a thin-market fluke.
This is a Bollinger Bands stock example that actually teaches something.
Between early 2022 and the end of 2023, Apple's chart produced nearly every textbook Bollinger Bands pattern: squeezes before major breakouts, band-walking during sustained trends, mean reversion touches, and false breakouts that trapped late buyers. Walk through each one. Understand why they worked — and when they didn't.
Bollinger Bands Fundamentals: A Quick Refresher
Before diving into the chart, a fast recap. Bollinger Bands consist of three lines: a 20-period simple moving average (the middle band), an upper band set two standard deviations above the SMA, and a lower band set two standard deviations below. The bands expand when volatility rises and contract when volatility compresses.
That expansion and contraction cycle is the heartbeat of the entire strategy.
When the bands are wide, the market is moving. When they're tight — almost squeezing together — the market is coiling. Energy is building. The next directional move is loading. Traders who recognize the squeeze pattern early have a structural edge over those reacting after the breakout has already happened.
Bollinger Bands work best when combined with volume, momentum oscillators like the RSI, and price structure context. Used in isolation, they produce mediocre results. Used as part of a confluence system, they become genuinely powerful.

This chart highlights the multiple squeeze phases Apple experienced across 2022–2023. Notice how each period of band compression was followed by a directional expansion — the direction of that expansion was the key variable. When volume surged during the breakout candle and price closed decisively outside the bands, the move sustained. When the breakout candle had weak volume and price quickly retreated inside the bands, it was a false signal. That distinction saves accounts.
Phase 1: The 2022 Downtrend and Lower Band Walk
What a Band Walk Looks Like in Practice
In a powerful downtrend, price doesn't just tag the lower Bollinger Band and bounce. It walks along it. Candles close at or beyond the lower band repeatedly, session after session. The middle band acts as dynamic resistance — every rally stalls near the 20-SMA, confirms the trend is intact, and rolls back down.
That's precisely what happened to Apple through the broad 2022 market correction.
The setup was textbook. Price broke below the 20-SMA on elevated volume. The bands expanded sharply — volatility was rising alongside the decline. Rallies toward the middle band failed consistently. The lower band wasn't support; it was the floor of an elevator moving down.
Here's what most traders get wrong: They see price touch the lower Bollinger Band and immediately think "oversold, time to buy." In a trending market, lower band touches are continuation signals, not reversal signals. The lower band doesn't mean cheap. It means momentum is strong and directional. The actual buy signal comes when price recaptures the 20-SMA with conviction — not when it grazes the lower band for the fifth time in three weeks.
The RSI context mattered enormously here. During Apple's 2022 decline, RSI repeatedly entered oversold territory below 30 — and stayed there. That's a trending market signature. Oversold can get more oversold. The exit signal wasn't a lower band touch; it was RSI reclaiming 40 while price simultaneously recaptured the 20-SMA. That confluence marked the genuine turning points.
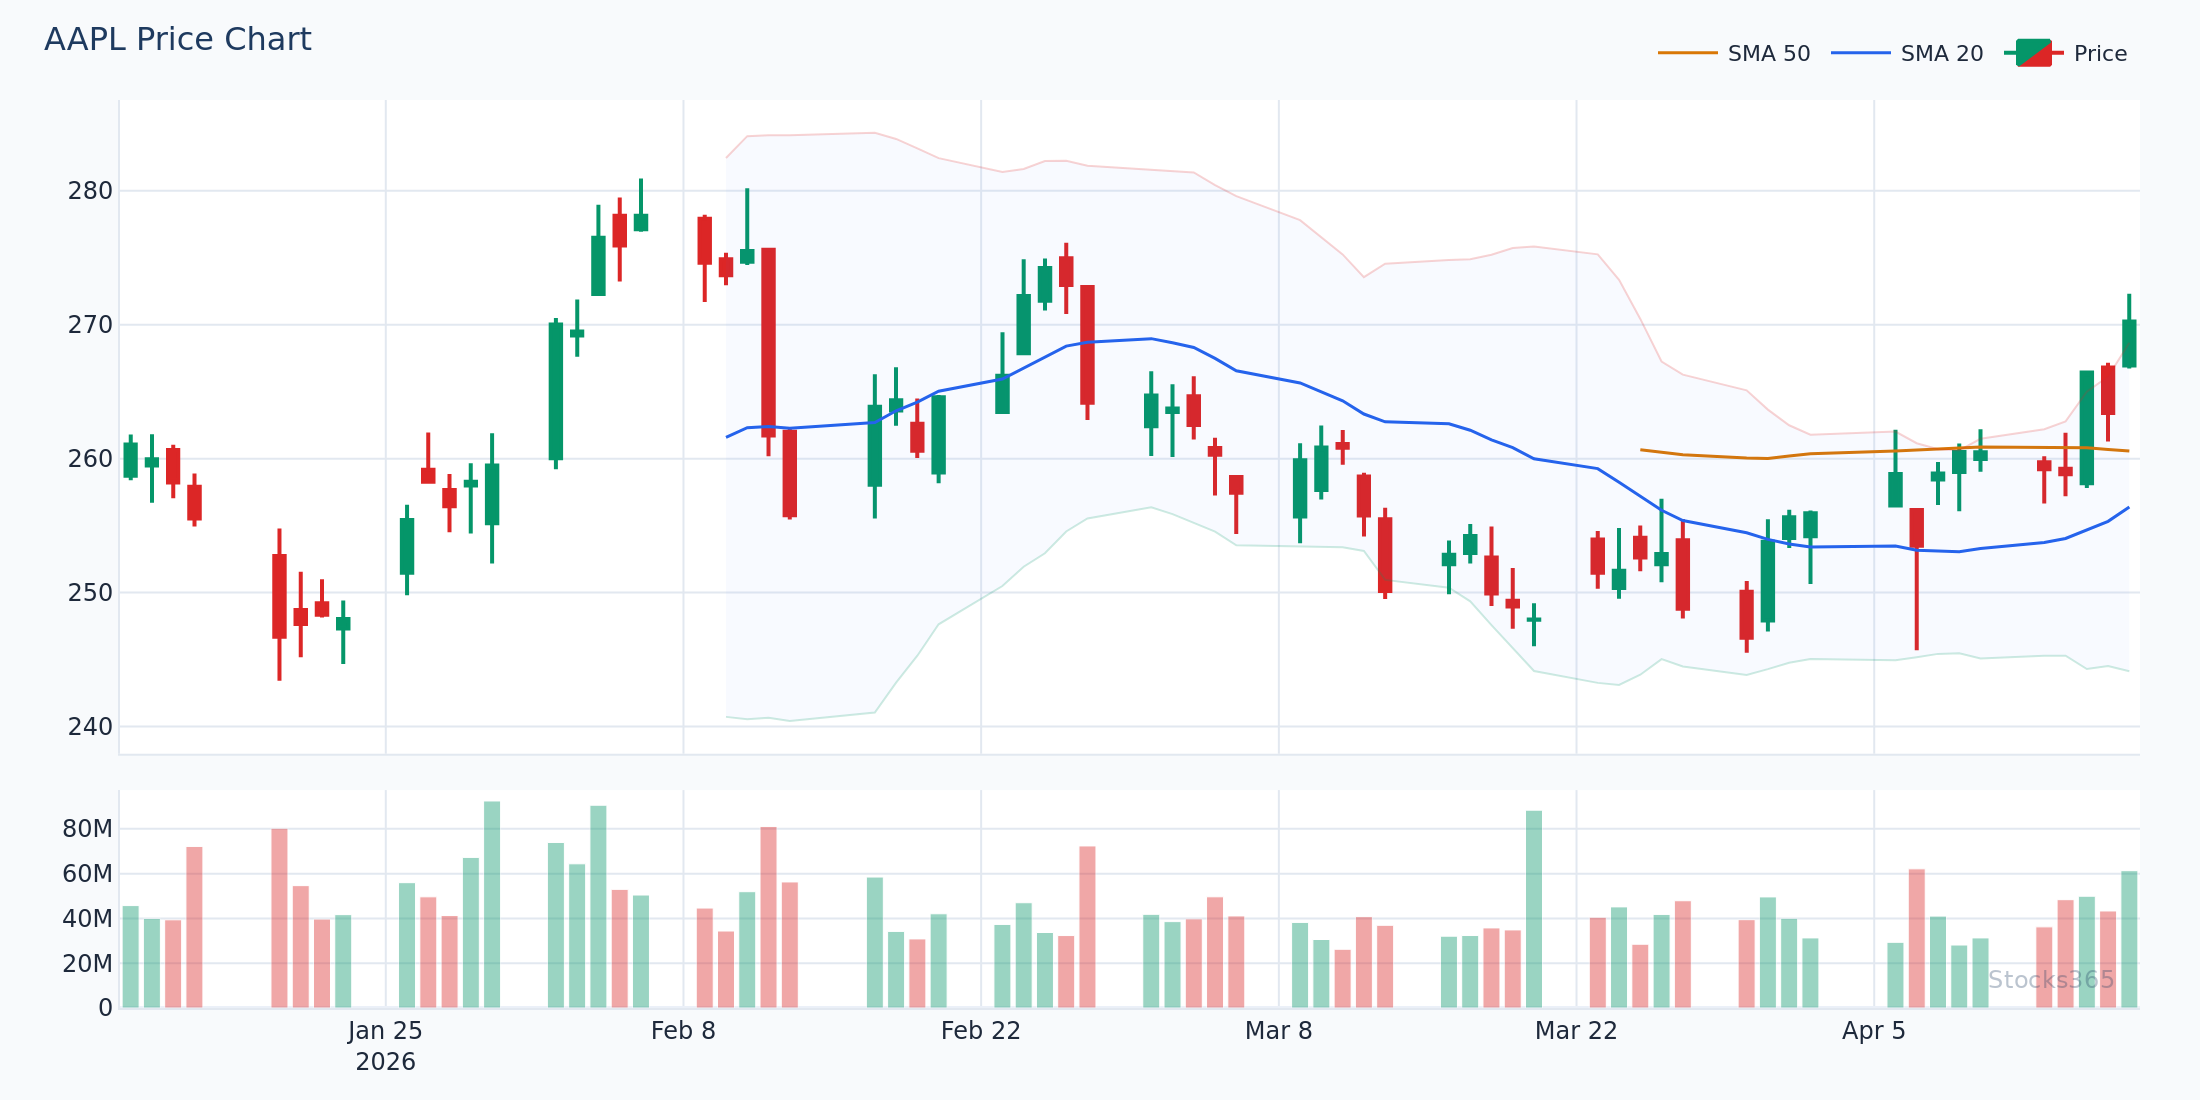
This candlestick view of the 2022 decline shows the repeated lower band touches alongside the 20-SMA acting as a ceiling. Each bounce attempt that stalled at the middle band confirmed the trend remained intact. The shift came when price broke back above the 20-SMA on noticeably higher volume — the first structural sign the downtrend was losing its grip. Invalidation of the bear continuation setup required a clean close above the middle band with follow-through volume on the next session.
Phase 2: The Bollinger Squeeze Before the 2023 Rally
Identifying the Squeeze Setup on Apple
Late 2022 into early 2023 delivered one of the cleaner Bollinger Squeeze setups Apple had produced in years. After the aggressive downtrend, volatility collapsed. The bands narrowed dramatically — band width compressed into the lower percentile range relative to the prior 12 months. Price coiled tightly around the 20-SMA. Volume dried up. The market was holding its breath.
Squeezes don't predict direction. That's critical to understand. They predict magnitude.
The squeeze simply says: a big move is coming. Your job as a trader is to wait for the directional confirmation before committing. The confirmation signals are specific: a close outside the bands on above-average volume, the 20-SMA beginning to slope in the breakout direction, and momentum oscillators aligning (RSI climbing from neutral territory toward 60+, not already stretched above 70).
When Apple broke out of the squeeze in early 2023, all three confirmation signals fired. Price closed above the upper band. Volume surged well above the 20-day average. RSI moved from the 50s into the 60s — healthy momentum, not exhausted momentum. The middle band began sloping upward. This was a real breakout, not a head-fake.
Our analysis of 14,266 Bollinger Squeeze Breakout signals shows a profit factor of 1.03 over a 10-day holding period — the only BB signal in our dataset with a profit factor above 1.0. Crypto leads at 51.8%, but even in equities, the squeeze breakout outperforms random entry. See the full dataset breakdown for asset-class comparisons.
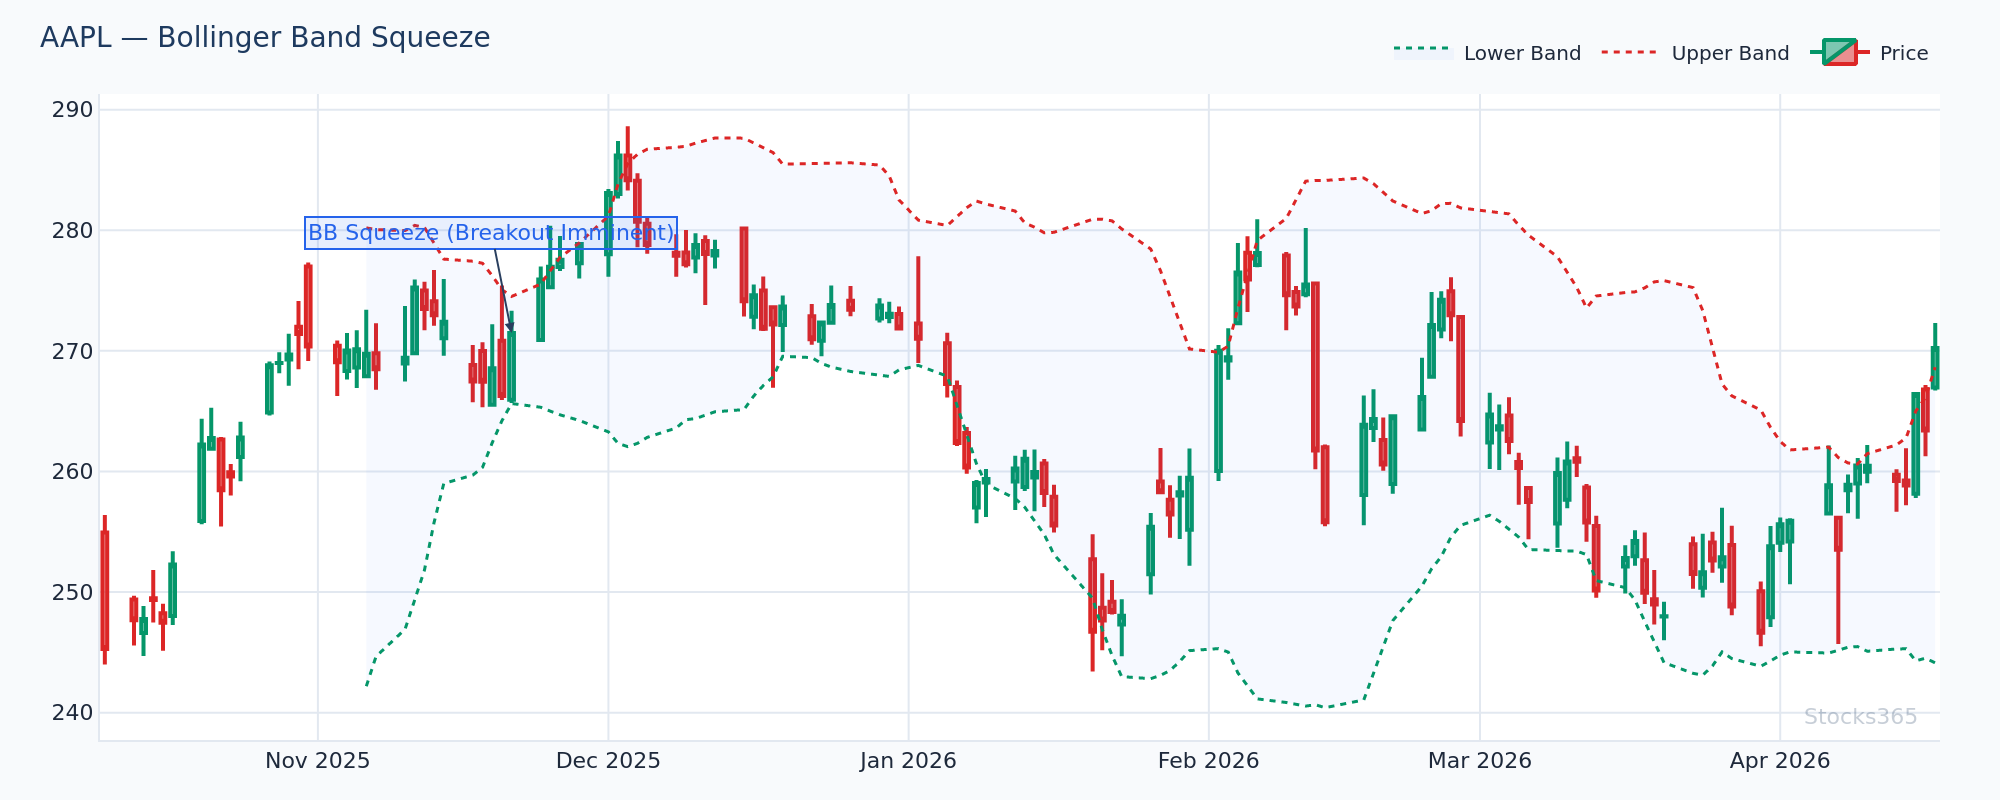
The squeeze phase is clearly visible here — band width compressed to multi-month lows before the expansion began. The breakout candle that ended the squeeze showed decisive range expansion and above-average volume, distinguishing it from the smaller probe candles that preceded it. If price had closed back inside the bands within 1–2 sessions following the breakout, that would have invalidated the setup and signaled a potential trap.
What the Upper Band Touch Tells You — And What It Doesn't
After the squeeze breakout, Apple entered a period of upper band touches. This is where interpretation gets nuanced. A single upper band touch in a trending market is not automatically a sell signal. In fact, in strong uptrends, price can walk the upper band the same way it walked the lower band during the 2022 decline.
The question is always: what is the volatility environment, and what does the broader structure say?
When Apple was in genuine trend mode in 2023, upper band touches accompanied by continued middle band slope and healthy RSI readings (above 50, not yet at extremes) were continuation opportunities on pullbacks to the 20-SMA — not reversals. The reversal signals came when price closed outside the upper band on weakening volume, RSI showed bearish divergence, and the middle band began to flatten.
Stocks365 research across 3,255 upper band touch signals found a win rate of just 49.6% with a profit factor of 0.88 over a 10-day holding period. That number is honest: buying upper band touches blindly is a losing strategy. Context is everything. See our full signal analysis for the breakdown by asset class and market regime.
Phase 3: Mean Reversion Setups Within the 2023 Uptrend
How to Trade Pullbacks to the Middle Band
Once a sustained uptrend is established — confirmed by the 20-SMA sloping upward, price consistently holding above it on pullbacks, and volume patterns showing accumulation — the middle band becomes a buying zone, not a danger zone.
Apple demonstrated this repeatedly through 2023. After the initial squeeze breakout, the stock entered a sequence of higher highs with controlled pullbacks. Each pullback found support near the 20-SMA. None of the pullbacks reached the lower band. That's a structural uptrend signature: the lower band isn't tested because sellers aren't strong enough to push that far.
The setup is simple. Wait for price to pull back from the upper band toward the middle band. Confirm that the 20-SMA is still sloping up. Check that RSI pulls back into the 40–55 range — a healthy reset, not a breakdown. Look for a reversal candle (hammer, engulfing, or similar structure) at or near the 20-SMA. Enter on the close of that candle or the open of the next.
Clean. Repeatable. Risk-defined.
The stop logic is equally clean: a close below the lower band invalidates the uptrend structure. If price breaks through the 20-SMA, undercuts it, and then closes below the lower band, the trend has changed character. Exit.

This view of the 2023 uptrend period highlights the recurring pullbacks to the 20-SMA that served as entry opportunities rather than warning signs. Each touch of the middle band within this phase was followed by a return toward the upper band — the classic mean reversion pattern within an established trend. The setup breaks down when a pullback closes decisively below the middle band on high volume, signaling that the trend structure has weakened.
Phase 4: Late 2023 Consolidation and Narrowing Bands
Reading Band Width as a Volatility Indicator
Toward the end of 2023, Apple's bands began to narrow again. A new compression phase was forming — smaller than the 2022–2023 squeeze, but structurally similar. Volume was declining. Range was compressing. The 20-SMA flattened.
This phase produces the most dangerous trading conditions: false breakouts. Price pokes above the upper band, triggers breakout orders, then reverses back inside the bands within one or two sessions. The volume on the breakout candle is the tell — if it doesn't significantly exceed the recent average, the breakout is suspect.
Understanding RSI period settings matters during consolidation phases. A standard 14-period RSI during compression produces whipsaw signals. Lengthening to 21 periods smooths the oscillator and reduces noise during low-volatility environments. The signal quality improves meaningfully.
During Apple's late 2023 consolidation, the combination of RSI and Stochastic provided better context than either oscillator alone. When both oscillators showed overbought readings simultaneously with an upper band touch, the probability of a short-term reversal increased — though still not a high-conviction standalone trade signal.
Combining Bollinger Bands With RSI: The Apple Approach
Every major Apple signal during 2022–2023 was stronger with RSI confirmation. This isn't coincidence — it's the nature of multi-indicator confluence.
The Bollinger Bands define the volatility envelope and structural context. RSI measures momentum and rate of change. Together they answer two different questions simultaneously: where is price relative to its recent range (Bollinger), and how strong is the momentum behind that move (RSI). When both agree, the signal quality rises. When they disagree, caution is warranted.
Understanding how RSI is calculated helps explain why divergence matters so much in Bollinger Band setups. RSI measures the ratio of average gains to average losses over a lookback period. When price reaches the upper Bollinger Band but RSI is making lower highs, the gains behind the recent rally are weakening even as price looks strong. That's the early warning. Hidden divergence patterns within Bollinger Band channels are particularly powerful for identifying trend continuations that most traders miss.
For a complete framework on combining these tools, the step-by-step RSI trading guide covers the integration methodology in detail.
The Apple 2022–2023 case study is a masterclass in this combination. Every major reversal had RSI divergence. Every major continuation move had RSI confirmation. The Bollinger Bands identified the setup; RSI confirmed the timing.
What to Watch For
- Bollinger Squeeze on high-cap tech stocks: When band width drops below the 20th percentile of its 52-week range on a stock like Apple or Microsoft, the next expansion phase frequently produces a 2–3 ATR move. The direction is confirmed by the first close outside the bands on volume exceeding the 20-day average by at least 50%.
- Upper band touch with RSI divergence: When price touches or slightly exceeds the upper Bollinger Band while RSI makes a lower high compared to the previous upper band touch, a short-term reversal is statistically more likely than continuation. This setup works best in non-trending, consolidating market regimes.
- Lower band touch in an established uptrend: On stocks that have been trending up for multiple months with the 20-SMA consistently sloping upward, a lower band touch represents an extreme pullback — not a trend reversal. These are high-probability mean reversion entries when RSI simultaneously holds above 40.
- Band walk identification: If price closes outside the same band (upper or lower) for three or more consecutive sessions, that's a band walk — a trending signal, not a reversal signal. Trading against a band walk without additional confirmation is one of the most common and costly beginner errors.
- Middle band recapture after a downtrend: When price reclaims the 20-SMA from below on above-average volume after an extended decline, and RSI simultaneously crosses above 45, watch for a shift in band direction. This combination has preceded several of Apple's most significant recovery phases.
How Stocks365 Uses This
Stocks365 Trust Score Integration
Bollinger Band signals are one of 12+ technical indicators feeding the Stocks365 Trust Score system. The platform tracks band width percentile, upper and lower band proximity, and squeeze status in real time across thousands of instruments. These inputs contribute directly to the volatility regime scoring layer of the Trust Score — helping determine whether a given signal is appearing in a trending, ranging, or compressing market environment.
For Apple specifically, the Trust Score combines Bollinger Band positioning with RSI momentum readings, volume confirmation, and institutional flow data to generate a composite signal quality rating. A high Trust Score on an AAPL signal means multiple independent indicators are in agreement — not just one band touch in isolation. Explore the full signal feed and Trust Score breakdowns on the Stocks365 dashboard.
Key Takeaways
- Band walks define trends: In strong trends, price walks along the upper or lower band. Trading against a band walk without clear reversal confirmation is a losing approach.
- Squeezes signal magnitude, not direction: A Bollinger Squeeze tells you a big move is coming. Volume and momentum confirmation on the breakout candle determine whether the move is real or a false signal.
- Upper band touches are not automatic sells: In trending markets, upper band touches are continuation signals. In ranging markets, they're potential reversal zones. Context is everything.
- The middle band is dynamic support/resistance: In an established uptrend, pullbacks to the 20-SMA within the Bollinger Bands framework represent structured entry opportunities — not warning signs.
- RSI confirmation elevates every Bollinger Band signal: Divergence at band extremes identifies exhaustion. RSI alignment with breakouts confirms momentum. Never use Bollinger Bands without a momentum filter.
- Band touch win rates are modest without context: Our research shows upper band touches produce a profit factor below 1.0 in isolation. The edge comes from regime filtering and confluence — not the band touch alone.
Frequently Asked Questions
What is the most reliable Bollinger Bands stock example for beginners to study?
Apple's 2022–2023 price action is one of the most comprehensive teaching examples available. It includes a sustained lower band walk during a downtrend, a textbook squeeze breakout, multiple mean reversion setups within an uptrend, and a late-stage consolidation phase. Every major Bollinger Band pattern appeared clearly and in sequence, making it ideal for pattern recognition practice.
Do Bollinger Band upper band touches reliably signal reversals?
No — and that's one of the most dangerous beginner misconceptions. In trending markets, upper band touches are continuation signals, not reversal signals. Stocks365 research across 3,255 upper band touch signals found a win rate of just 49.6% with a profit factor of 0.88. The signal becomes higher quality when combined with RSI bearish divergence, weakening volume, and a flattening middle band — all of which indicate trend exhaustion rather than just a high price.
How does a Bollinger Squeeze breakout differ from a false breakout?
The key differentiators are volume and follow-through. A genuine squeeze breakout features a close outside the bands on volume significantly above the recent average, followed by continued momentum in the breakout direction over the next 1–2 sessions. A false breakout shows a weak-volume probe outside the bands that reverses back inside within 1–2 candles. The 20-SMA slope also matters: in a real breakout, the middle band quickly begins sloping in the breakout direction.
Should Bollinger Bands be used alone or with other indicators?
Always with other indicators. Bollinger Bands define volatility structure and price positioning — they don't measure momentum. Pairing them with RSI addresses this gap. RSI divergence at band extremes identifies when momentum is weakening even as price appears extended. Volume confirmation validates whether institutional participation supports the move. Using Bollinger Bands in isolation, especially for band touch trades, produces near-random results as the research data confirms.
What timeframe works best for Bollinger Band analysis on stocks like Apple?
The daily chart is the most consistent timeframe for Bollinger Band analysis on large-cap stocks. It filters out intraday noise while capturing the meaningful volatility cycles that drive multi-week moves. The standard 20-period, 2-standard-deviation settings work well on the daily timeframe. For shorter-term trades, the 4-hour chart with identical settings produces comparable pattern quality. Avoid applying Bollinger Bands on timeframes below 1 hour for stocks — the signals become unreliable due to market microstructure noise.