
MACD vs Stochastic Oscillator: Which Indicator Should You Use?
Two of the most widely used technical indicators in active trading are the MACD (Moving Average Convergence Divergence) and the Stochastic Oscillator. Both help traders identify momentum shifts and potential entry or exit points — but they work in fundamentally different ways, suit different market conditions, and reward different trading styles.
Whether you're swing trading large-caps like AAPL or scalping volatile moves in NVDA, understanding the distinction between MACD vs stochastic is essential for building a more precise, reliable strategy. This guide breaks down exactly how each indicator functions, where each excels, and how to combine them for stronger confluence signals.
Key Insight: Neither MACD nor the Stochastic Oscillator is universally superior. The right choice depends on your timeframe, the asset's volatility, and whether you're trading with or against the prevailing trend.
What Is the MACD Indicator?
The MACD is a trend-following momentum indicator developed by Gerald Appel in the late 1970s. It measures the relationship between two exponential moving averages (EMAs) of price, typically the 12-period and 26-period EMAs. The result is plotted as a line (the MACD line), alongside a 9-period EMA of that line called the signal line.
MACD Components Explained
- MACD Line: 12-period EMA minus 26-period EMA. Measures the spread between short- and long-term momentum.
- Signal Line: A 9-period EMA of the MACD line. Acts as a trigger for buy/sell signals.
- Histogram: The visual difference between the MACD line and signal line. Expanding bars indicate strengthening momentum; shrinking bars warn of a slowdown.
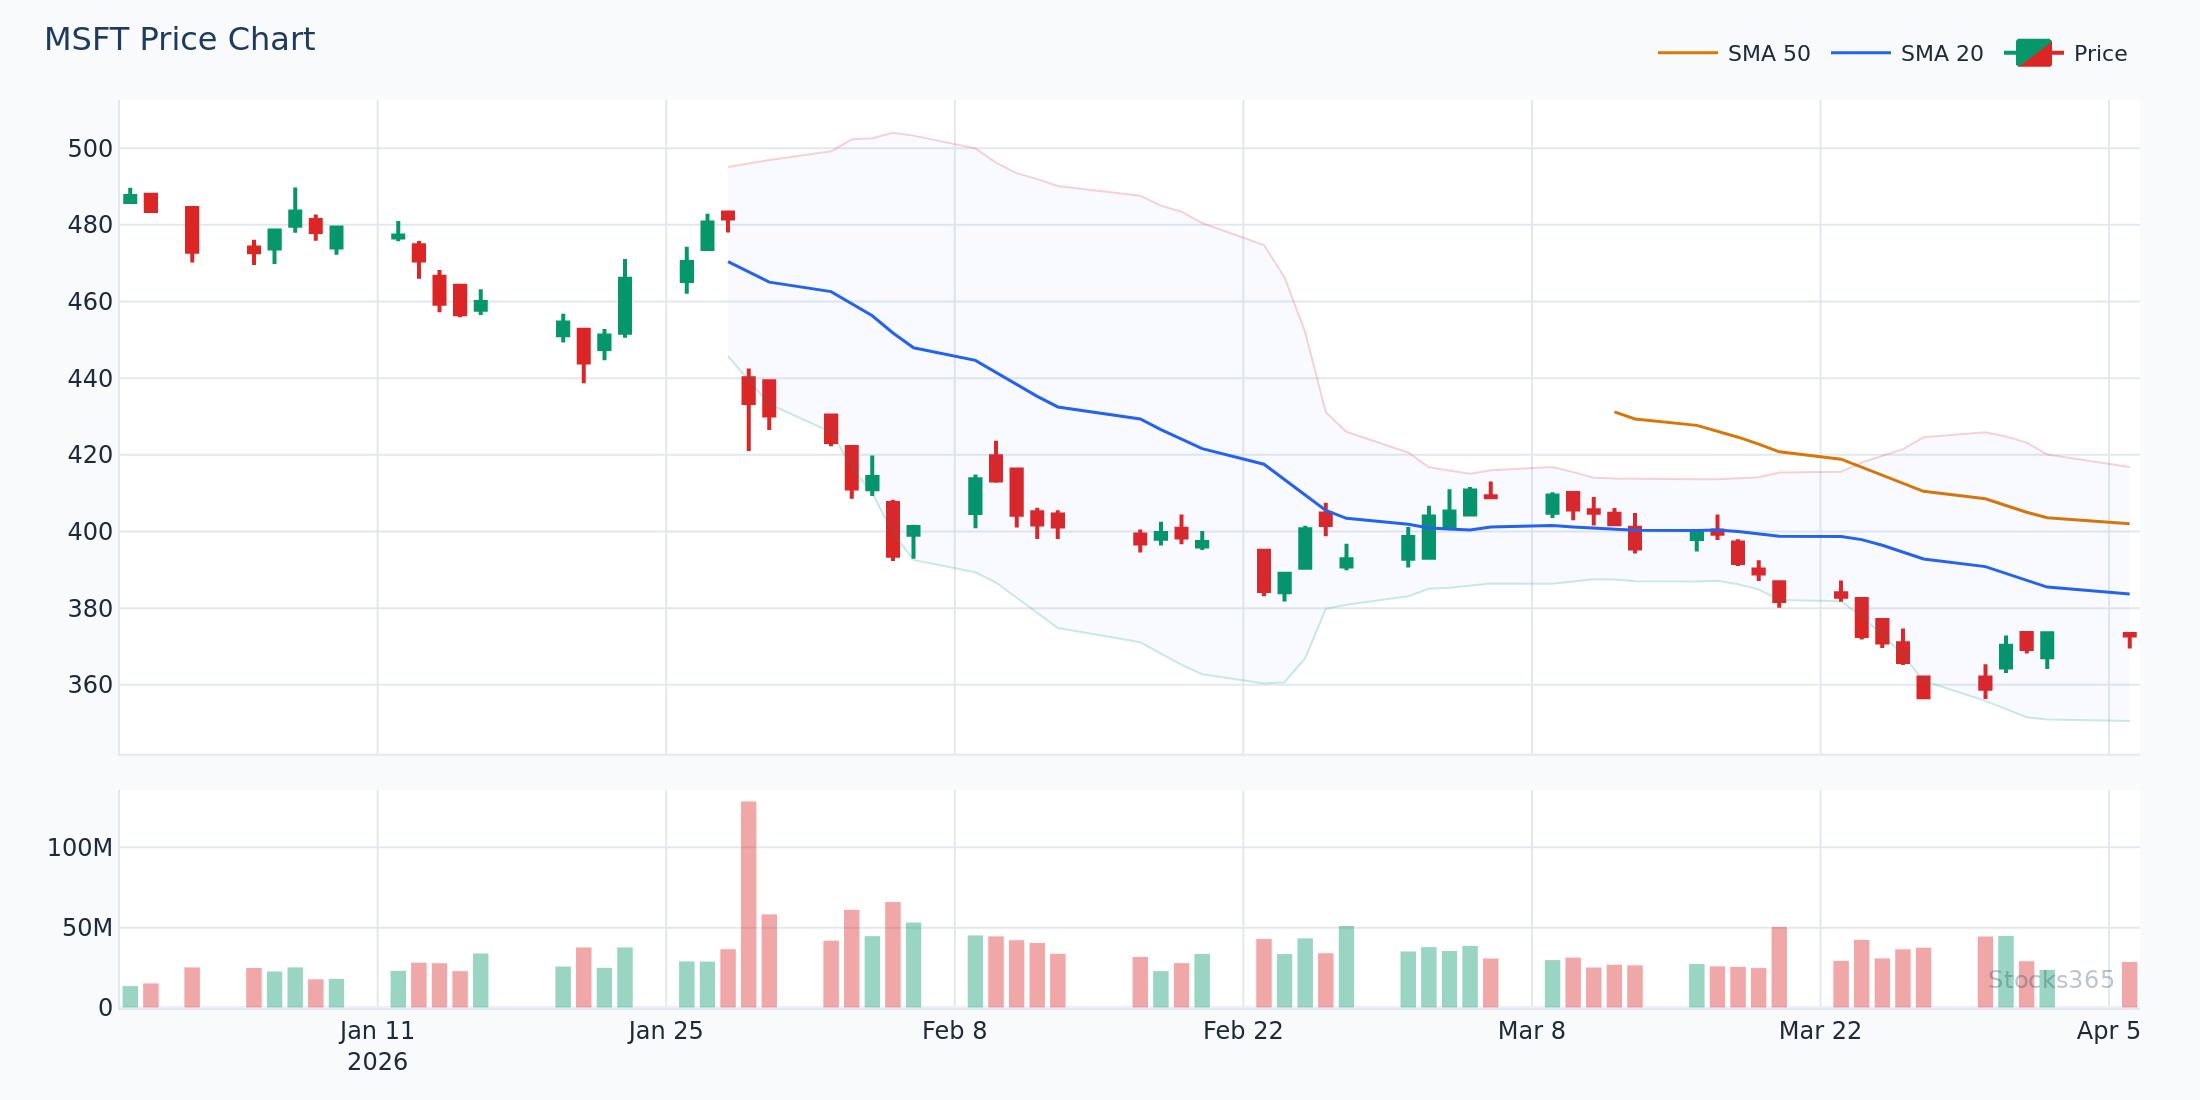
A classic MACD bullish crossover occurs when the MACD line crosses above the signal line below the zero line — often a powerful early signal in trending markets. For example, in early 2026, MSFT formed a textbook MACD crossover near the $390 support zone before rallying over 12% in five weeks.
What MACD Does Best
- Identifying the direction and strength of a trend
- Spotting momentum divergence before major reversals
- Working effectively on daily and weekly timeframes for swing and position traders
- Filtering out noise in strongly trending markets
What Is the Stochastic Oscillator?
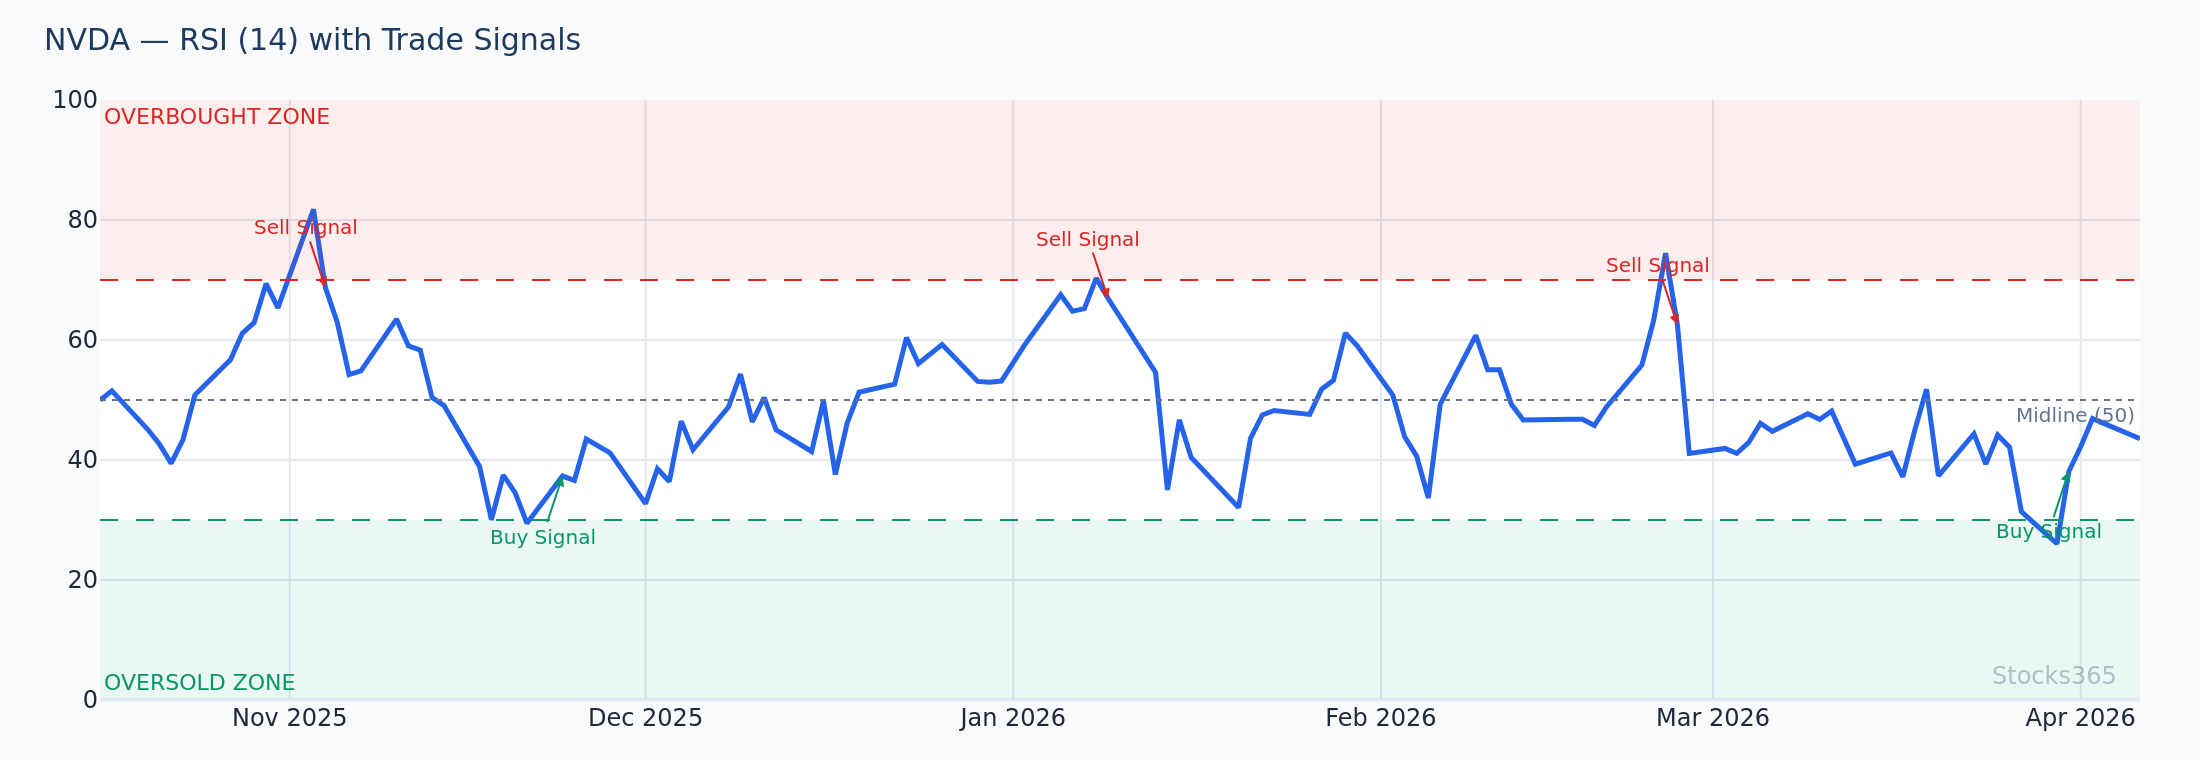
The Stochastic Oscillator, developed by George Lane in the 1950s, is a range-bound momentum oscillator that compares a security's closing price to its price range over a specific look-back period — typically 14 periods. It produces a value between 0 and 100, making it easy to identify overbought and oversold conditions.
Stochastic Components Explained
- %K Line: The fast line. Calculated as: (Current Close − Lowest Low) ÷ (Highest High − Lowest Low) × 100.
- %D Line: A 3-period moving average of %K. This is the signal line traders watch for crossovers.
- Overbought/Oversold Zones: Readings above 80 signal overbought conditions; readings below 20 indicate oversold territory.
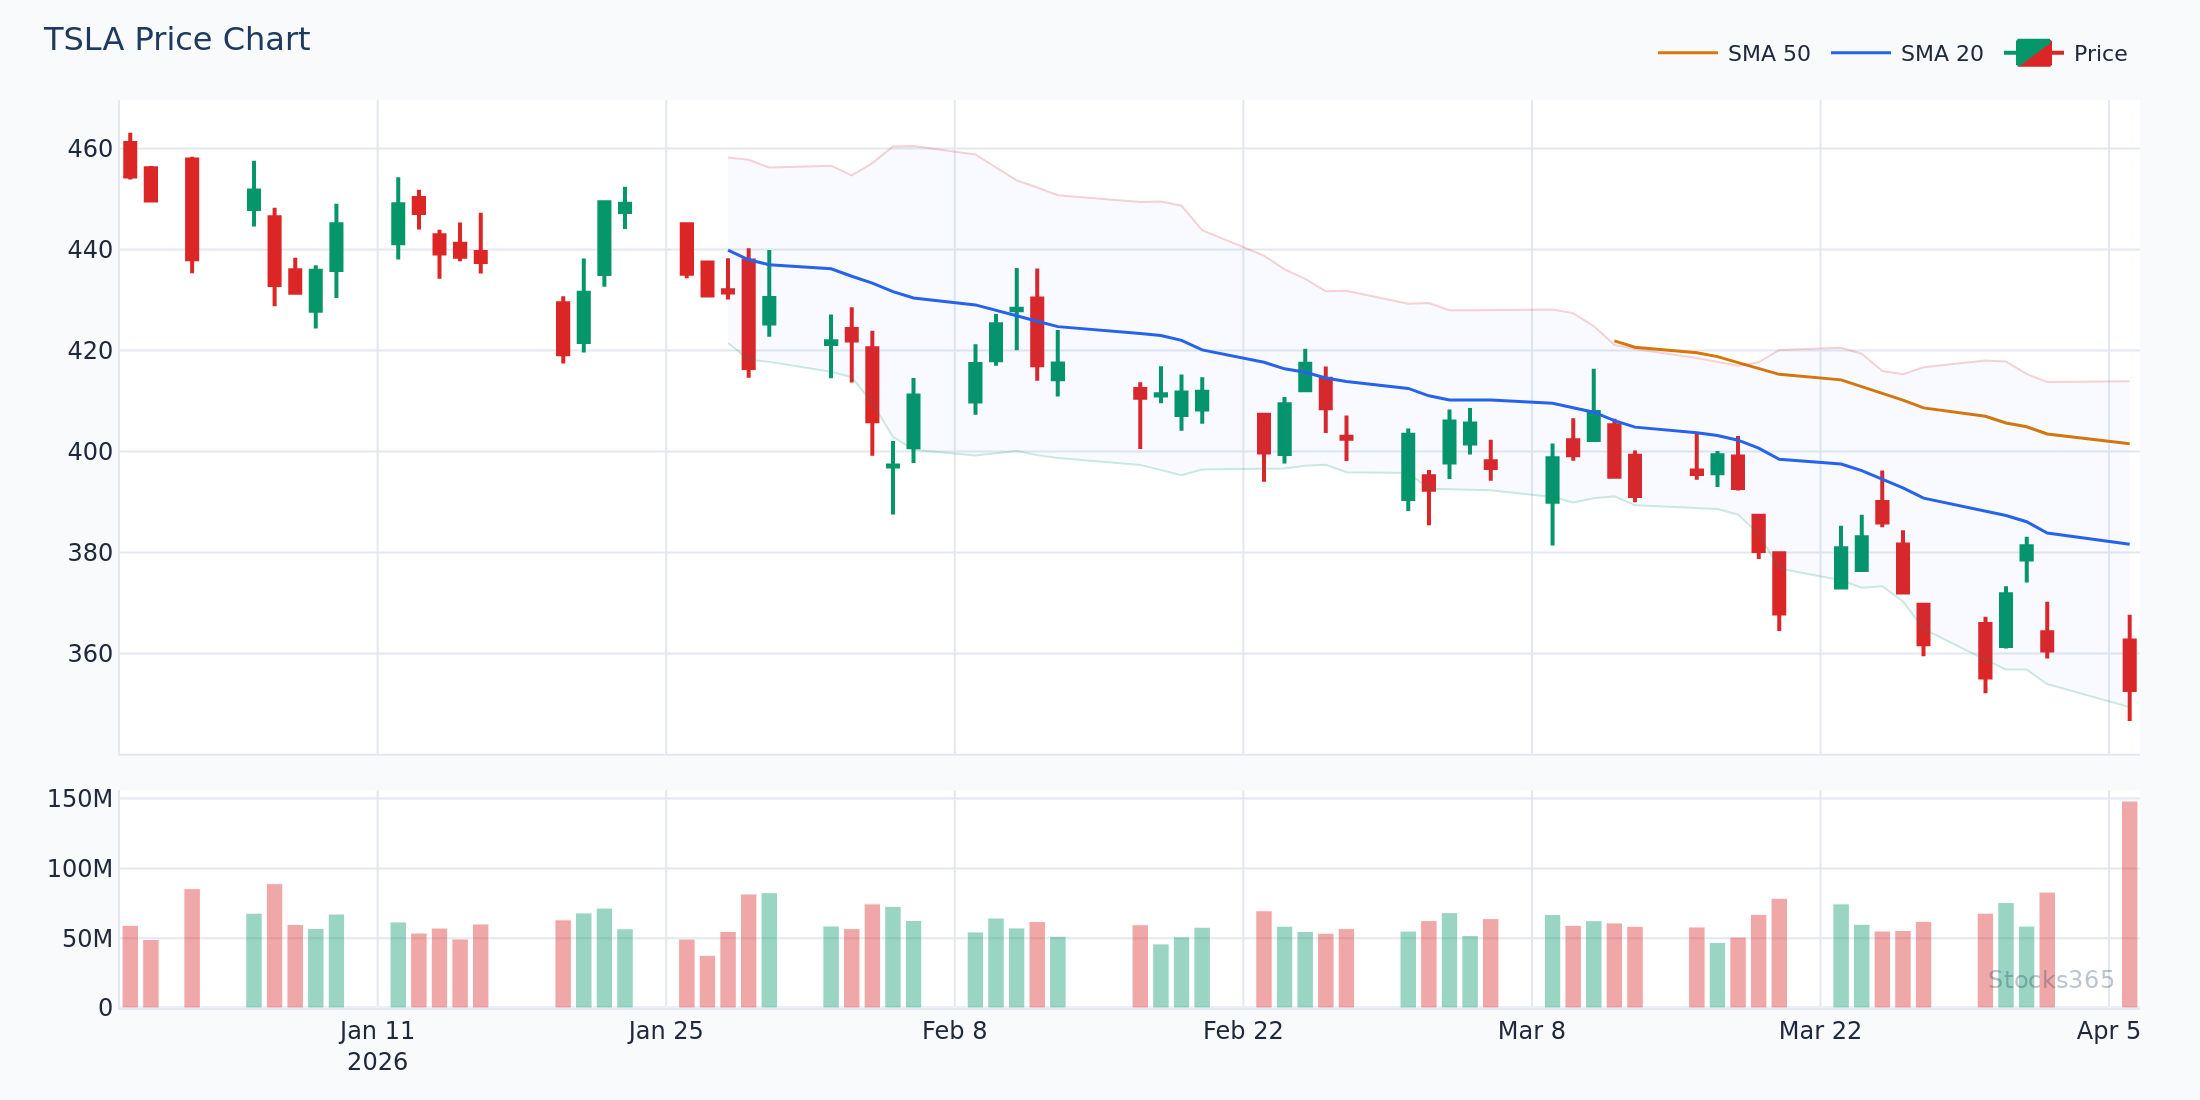
When %K crosses above %D below the 20 level, it generates a bullish signal. When %K crosses below %D above the 80 level, it signals a potential bearish reversal. Consider a recent TSLA example in Q1 2026: the stochastic dropped to 12 while price held a well-defined support at $215 — the subsequent %K/%D crossover preceded a 9% bounce within days.
What the Stochastic Oscillator Does Best
- Pinpointing overbought and oversold extremes in ranging markets
- Generating faster, more frequent signals on short timeframes
- Identifying short-term pullback entries within a trend
- Complementing other indicators for timing precise entries
MACD vs Stochastic: Core Differences Compared
While both indicators measure momentum, they do so through completely different lenses. Here's a direct comparison of the key structural and functional differences:
1. Calculation Methodology
MACD is based on the difference between two exponential moving averages. It is an unbounded indicator — meaning there are no fixed upper or lower limits. Its values can theoretically extend infinitely in either direction, which makes it especially useful for gauging trend magnitude.
Stochastic is a bounded oscillator, always producing values between 0 and 100. It compares price position within a recent high-low range. This makes it ideal for identifying extremes in non-trending (ranging) markets.
2. Speed and Sensitivity
The Stochastic Oscillator reacts faster to price changes. This makes it effective for short-term traders and scalpers who need quick signals. However, this speed comes at a cost — it produces more false signals in trending markets.
The MACD is a slower, smoother indicator. It lags price action more than the stochastic but compensates with greater reliability in trending environments. Swing traders and position traders typically find MACD signals more actionable over 4-hour, daily, or weekly charts.
3. Best Market Conditions
- MACD excels in trending markets — it helps traders stay in trends longer and avoid premature exits.
- Stochastic excels in ranging or consolidating markets — it thrives when price bounces between defined support and resistance levels.
Using MACD in a sideways market often produces a string of whipsaw crossovers that erode profitability. Similarly, using only the stochastic in a powerful trend will generate repeated (and costly) countertrend signals. This is why many professional traders use both indicators together.
4. Signal Types Generated
MACD signals:
- MACD/signal line crossovers (bullish and bearish)
- Zero line crossovers (momentum confirmation)
- Histogram expansion and contraction (momentum strength)
- Bullish and bearish divergence
Stochastic signals:
- %K/%D crossovers in overbought/oversold zones
- Overbought (above 80) and oversold (below 20) readings
- Bullish and bearish divergence
- Stochastic pop (breakout from consolidation)
How to Combine MACD and Stochastic for Higher-Probability Setups
The most powerful use of MACD vs stochastic isn't choosing one over the other — it's using both in tandem to achieve confluence. When MACD and stochastic agree, the probability of a successful trade increases significantly.
The Dual Confirmation Strategy
Here's a practical framework for combining both indicators on a daily chart:
- Step 1 — Trend filter with MACD: Only take long trades when the MACD histogram is positive and expanding (uptrend confirmed). Only take short trades when the histogram is negative and expanding.
- Step 2 — Time entry with Stochastic: Wait for a stochastic pullback into oversold territory (below 20) during an uptrend, then enter on the %K/%D bullish crossover.
- Step 3 — Confirm with price structure: Ensure the entry point aligns with a key support level, trendline, or moving average.
Using this approach on GOOGL in February 2026, a trader would have identified the MACD trending positively above zero while the stochastic dipped briefly to 18 at the $178 support zone. The %K/%D crossover at that level provided an ideal long entry ahead of a multi-week rally to $198.
For traders who also incorporate RSI into their workflows, pairing these indicators with RSI vs Stochastic Oscillator analysis creates an even more complete momentum picture. Understanding how all three indicators interact can dramatically sharpen your timing.
Divergence: Where Both Indicators Become Powerful
Both MACD and the Stochastic Oscillator can produce divergence signals — situations where price makes a new high or low but the indicator fails to confirm it. Divergence is one of the most reliable leading signals in technical analysis.
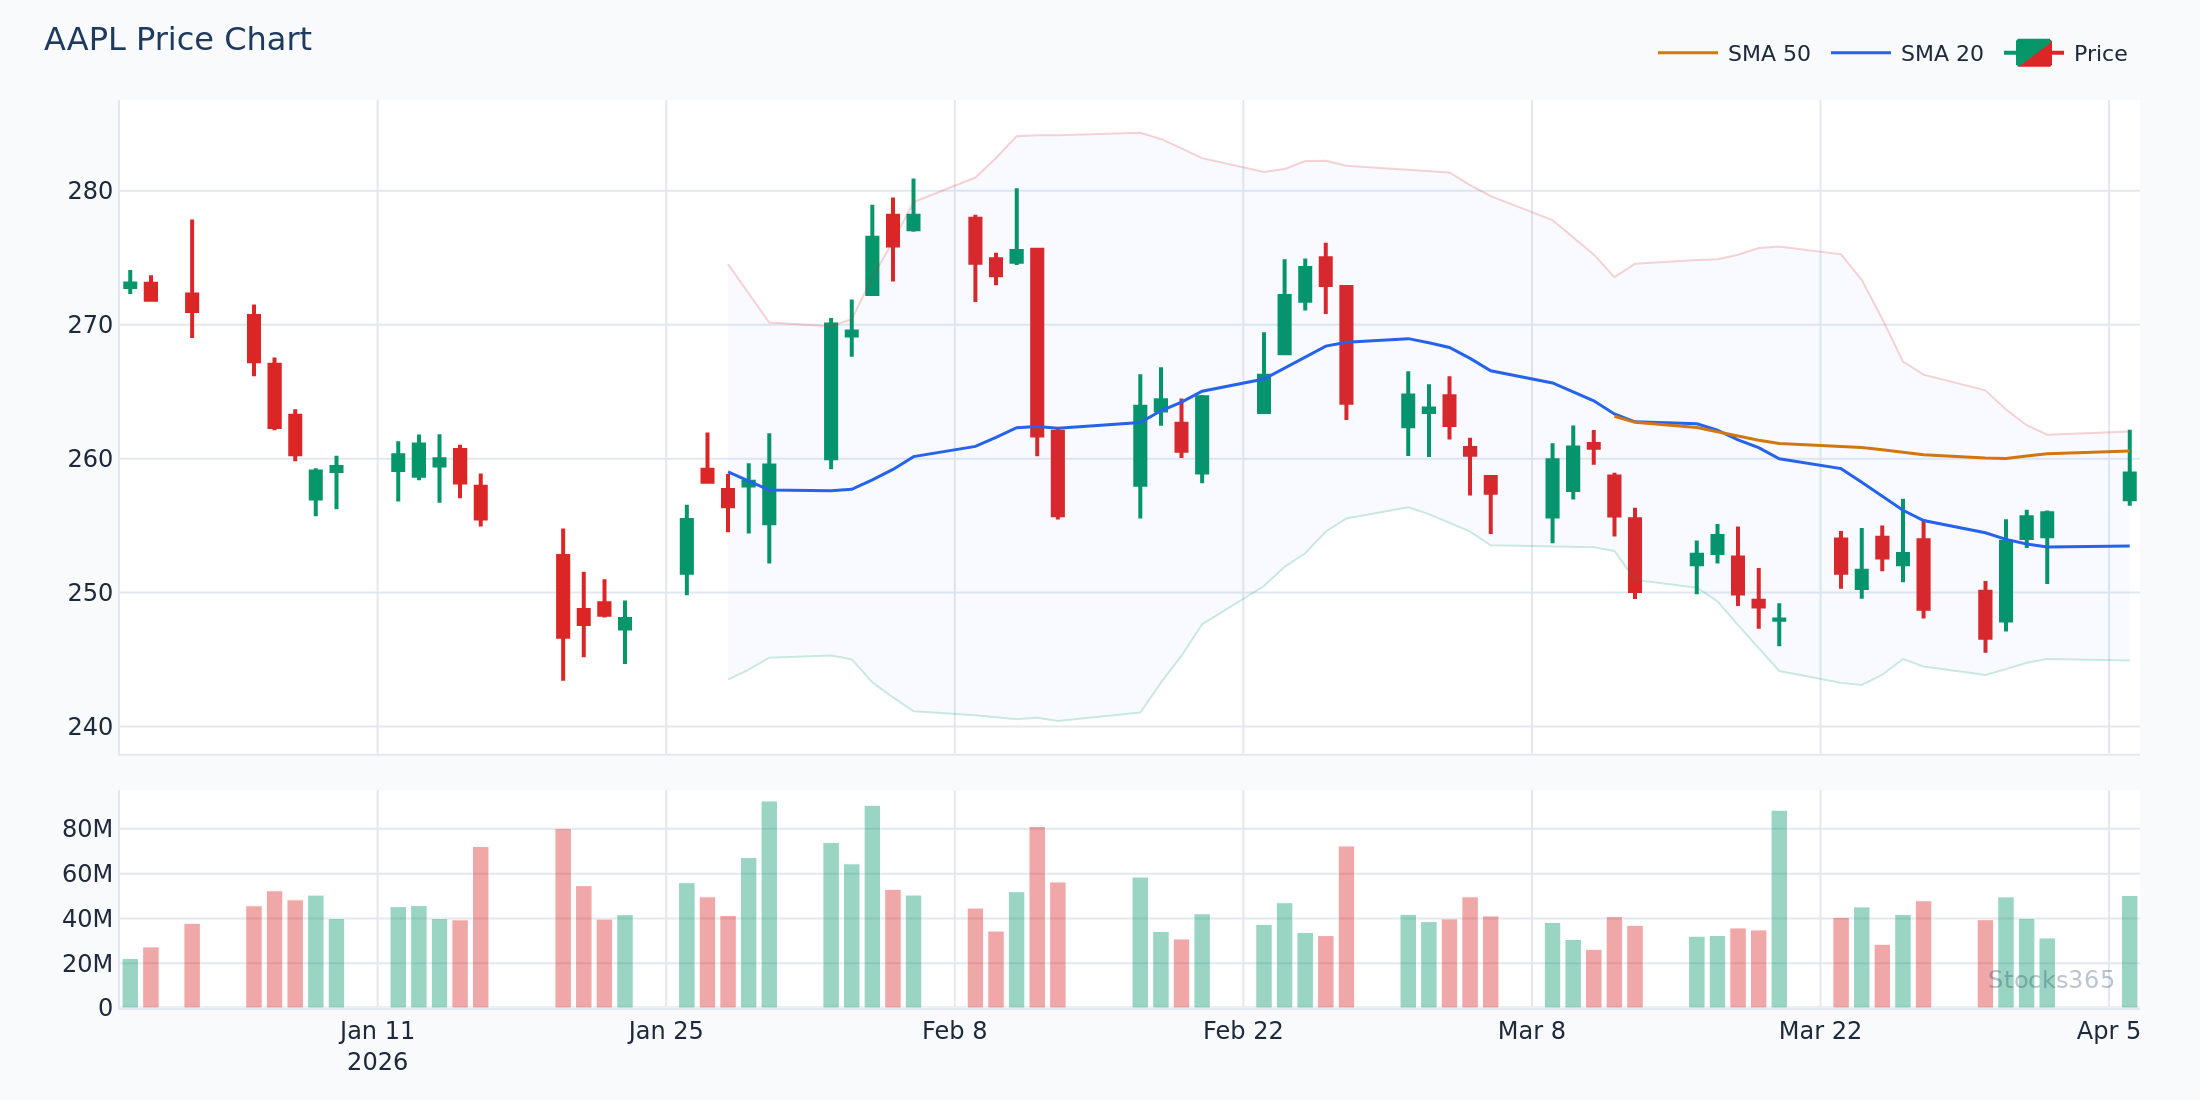
A bearish MACD divergence on AAPL in Q1 2026, for example, showed price printing new highs near $245 while the MACD histogram made a lower peak — warning of fading momentum before the subsequent 8% correction. If that MACD divergence aligned with a stochastic reading above 80 and a bearish %K/%D cross, the signal would be considerably more compelling.
To deepen your understanding of divergence-based trading, explore our guide on RSI Divergence: Master Bullish & Bearish Signals — many of the same principles apply across oscillators. Advanced traders can also explore Hidden RSI Divergence, a continuation signal that most retail traders overlook entirely.
Common Mistakes Traders Make With MACD and Stochastic
Using Stochastic Alone in Trending Markets
This is one of the most costly errors in trading. In a strong uptrend, the stochastic will remain in overbought territory (above 80) for extended periods. Traders who blindly short every overbought reading will stack up losses as the trend continues. Always use MACD or a trend filter first to determine the prevailing direction before acting on stochastic signals.
Chasing MACD Crossovers Late
Because MACD uses lagging EMAs, crossover signals can appear well after the initial price move has already occurred. Entering on a MACD crossover without considering where price sits relative to support/resistance often means buying near the top of a short-term move. Use stochastic to time a better entry within the MACD-confirmed trend.
Ignoring the Zero Line on MACD
Many traders focus exclusively on MACD/signal line crossovers and miss the significance of the zero line. A crossover of the MACD line above zero confirms that the 12-period EMA has moved above the 26-period EMA — a meaningful shift in medium-term momentum. Trades taken in the direction of the zero line cross tend to be higher probability.
MACD vs Stochastic Across Different Timeframes
The effectiveness of each indicator shifts meaningfully based on the chart timeframe you're trading:
- Scalping (1-5 minute charts): Fast Stochastic (5,3,3) is more responsive. MACD tends to lag too much for scalping setups.
- Day trading (15-minute to 1-hour charts): Both indicators are viable. Use MACD for trend bias and stochastic for entry timing.
- Swing trading (4-hour to daily charts): Standard MACD (12,26,9) performs well. Slow Stochastic (14,3,3) reduces noise and filters false signals.
- Position trading (weekly charts): MACD is particularly effective here. Weekly MACD crossovers are rare but carry significant weight as trend change signals.
If you're still building your foundation with oscillators, start with What Is RSI? The Complete Beginner's Guide to understand how momentum indicators are constructed and interpreted. From there, reviewing RSI Settings: Master the Best Period for Your Strategy will help you apply the same period-optimization thinking to your MACD and stochastic settings.
How Stocks365 Helps You Apply These Indicators
Understanding MACD vs stochastic is one thing — applying them in real-time market conditions is another challenge entirely. Stocks365's signals dashboard integrates multiple momentum indicators with our proprietary Trust Score system, which grades each trade signal based on the number of confirming factors present.
When a signal on a stock like AAPL scores high on the Trust Score, it typically means that MACD trend alignment, stochastic timing, price structure, and volume are all pointing in the same direction simultaneously — exactly the kind of confluence that professional traders spend years learning to identify manually.
Rather than toggling between indicators and second-guessing your reads, the platform surfaces the highest-conviction setups so you can focus on execution and risk management.
Key Takeaways
MACD vs Stochastic — Summary:
- ✅ MACD is a trend-following, unbounded indicator best suited for trending markets and longer timeframes.
- ✅ Stochastic Oscillator is a bounded oscillator (0–100) best suited for ranging markets and short-term entry timing.
- ✅ MACD divergence signals weakening trends before price confirms the reversal.
- ✅ Stochastic overbought/oversold crossovers provide precise entry and exit timing.
- ✅ Using both together — MACD for trend direction and stochastic for entry timing — produces higher-probability setups than either alone.
- ✅ Always consider market conditions: trending vs. ranging environments determine which indicator leads and which confirms.
- ✅ The Stocks365 Trust Score system automates multi-indicator confluence analysis to surface the strongest signals in real time.
Frequently Asked Questions
Is MACD or Stochastic better for day trading?
For day trading on 15-minute to 1-hour charts, using both together is more effective than relying on either alone. Use MACD to determine whether the intraday trend is bullish or bearish, then use the Stochastic Oscillator to time your entries on pullbacks. On very short timeframes like 1–5 minutes, the fast Stochastic (5,3,3) often responds more quickly than standard MACD settings.
Can MACD and Stochastic give conflicting signals?
Yes, and this is actually useful information. When MACD is trending bullish but the stochastic is overbought, it may simply mean the uptrend is maturing and a minor pullback is approaching — not necessarily a trend reversal. Conflicting signals are a cue to reduce position size or wait for clarity rather than forcing a trade.
What's the difference between MACD divergence and Stochastic divergence?
Both types of divergence compare indicator direction to price direction, but they measure different things. MACD divergence reflects changes in the trend's underlying momentum via moving average relationships, making it more relevant over medium-term periods. Stochastic divergence is based on price's position within its recent range and tends to trigger more frequently on shorter timeframes. When both show divergence simultaneously, the signal is considerably more powerful.
Should I use Slow Stochastic or Fast Stochastic alongside MACD?
For most swing trading applications alongside MACD, Slow Stochastic (14,3,3) is preferred. It smooths out the %K line, reducing false crossovers and noise. Fast Stochastic (5,3,3) is better suited to scalping or very short-term day trading contexts where speed is more important than signal quality.
How does MACD relate to RSI in a trading strategy?
MACD and RSI are complementary but distinct. MACD measures trend momentum through EMA relationships, while RSI measures the speed and magnitude of price changes relative to recent closes. Many traders use all three — MACD for trend direction, Stochastic for entry timing, and RSI for overbought/oversold confirmation. To understand RSI's role in depth, start with How to Use RSI in Trading: The Ultimate Step-by-Step Guide and explore RSI Overbought and Oversold Levels for signal interpretation.