
How Bollinger Bands Work: The Math Behind the Indicator
Most traders use Bollinger Bands wrong. They see price touch the upper band and sell. They see price touch the lower band and buy. Then they wonder why the trades keep failing. The issue isn't the indicator — it's a fundamental misunderstanding of what Bollinger Bands actually measure.
This guide breaks down the exact math, explains what the bands are really telling you, and shows you the setups that produce a genuine edge.
Stocks365 backtested 14,266 Bollinger Squeeze Breakout signals across multiple asset classes and found a profit factor of 1.03 — making it the only core Bollinger setup with a positive expected value over a 10-day holding period. That number matters. It tells you something real about how the indicator works and, just as importantly, when it doesn't.
What Are Bollinger Bands? A Clean Definition
Bollinger Bands are a volatility-based envelope indicator developed by John Bollinger in the early 1980s. They consist of three lines plotted directly on a price chart:
- Middle Band: A 20-period simple moving average (SMA) of closing prices
- Upper Band: Middle band + (2 × standard deviation of closing prices over 20 periods)
- Lower Band: Middle band − (2 × standard deviation of closing prices over 20 periods)
That's it. No black box. No complex algorithm. The power — and the limitation — comes entirely from how standard deviation responds to price behavior.
The Exact Math: How Bollinger Bands Are Calculated
Understanding how Bollinger Bands work at a mathematical level separates traders who use them well from those who misread them constantly.
Step 1: Calculate the 20-Period SMA
Add up the closing prices for the last 20 candles. Divide by 20. That's your middle band. It's the same SMA you'd see on any chart — nothing exotic.
Step 2: Calculate Standard Deviation
This is where the real information lives. For each of the 20 closing prices:
- Subtract the 20-period SMA from that closing price
- Square the result
- Sum all 20 squared differences
- Divide by 20 (population standard deviation)
- Take the square root
The result is one number: the standard deviation of price over the last 20 periods. When price has been moving wildly, this number is large. When price has been grinding sideways in a tight range, this number is small.
Step 3: Apply the Multiplier
Multiply the standard deviation by 2. Add it to the SMA for the upper band. Subtract it from the SMA for the lower band.
With a multiplier of 2, approximately 95% of all closing prices should fall inside the bands — assuming a normal distribution. That assumption is imperfect in financial markets (fat tails exist), but it's close enough to be useful.
The key insight: Bollinger Bands don't predict price direction. They measure volatility. Wide bands mean high volatility. Narrow bands mean low volatility. Price touching a band is not a signal — it's information about where price sits relative to recent volatility.
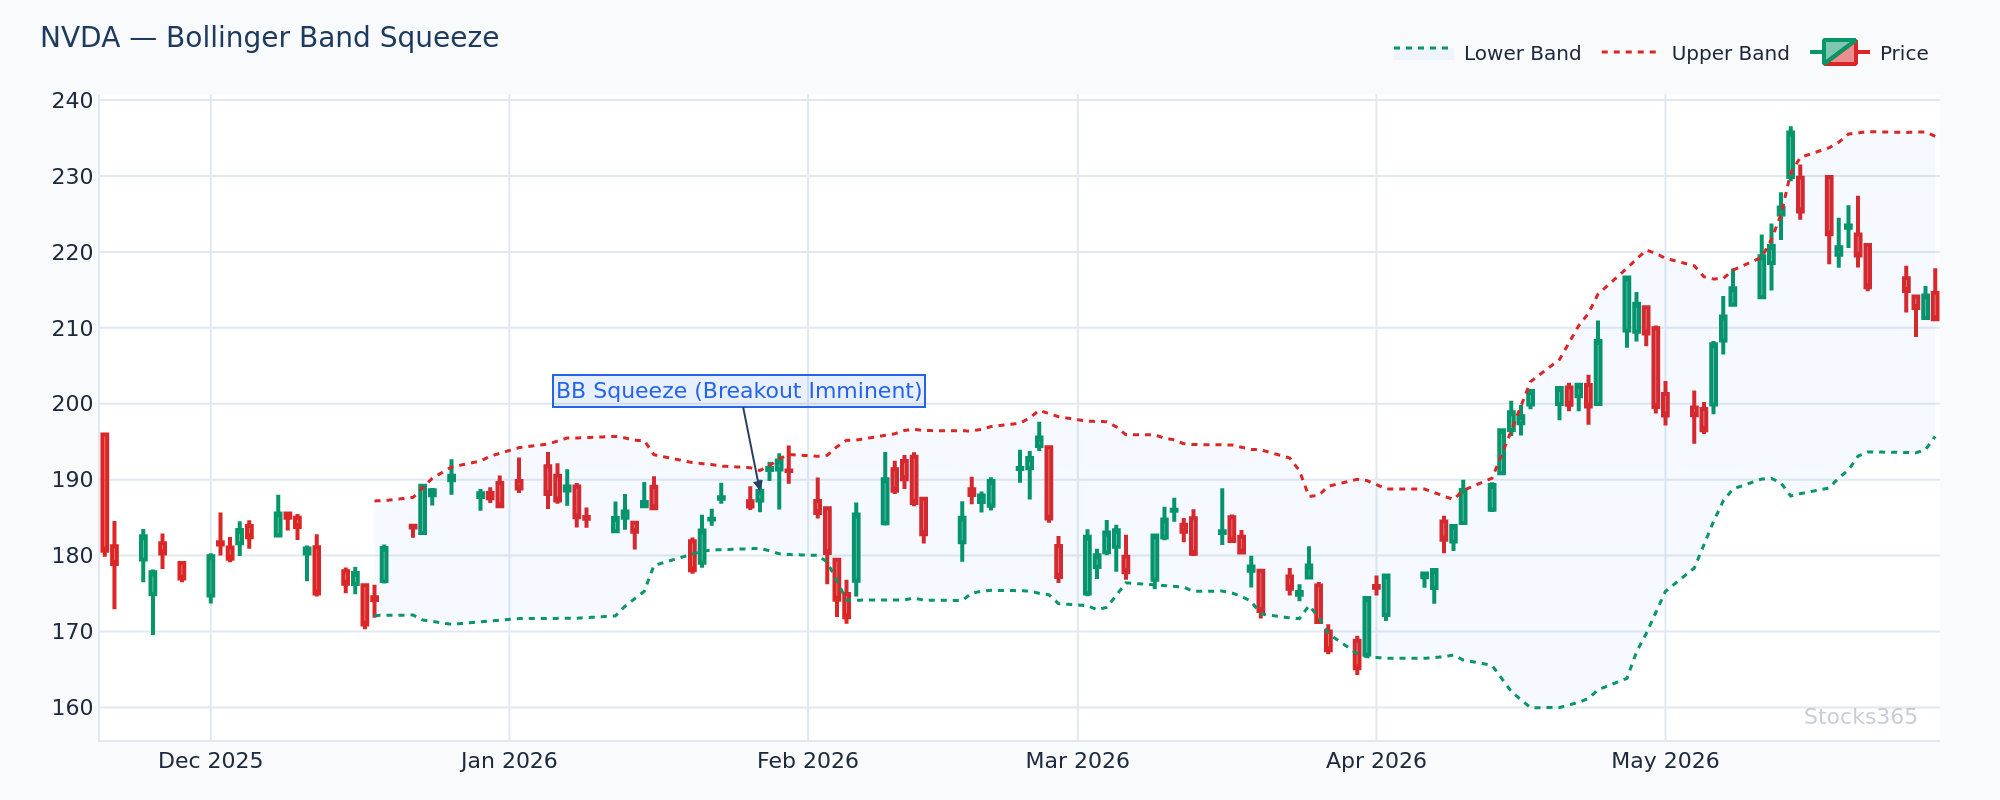
This chart shows band width compressing toward multi-month lows — a classic squeeze setup. When bands narrow this aggressively, the next directional move tends to be sharp. Confirmation comes when price closes decisively outside the bands on rising volume. A failure looks like price poking outside the band and immediately reversing back inside within one or two candles.
Why Band Width Is the Most Underrated Signal
Band width is the percentage distance between the upper and lower bands relative to the middle band. The formula:
Band Width = (Upper Band − Lower Band) / Middle Band × 100
When band width drops to multi-month lows, volatility has compressed. Markets don't stay quiet forever. The compression is a coiling spring — and the breakout that follows is often the highest-probability setup Bollinger Bands produce.
This is the Bollinger Squeeze. And it's the only setup our backtesting data consistently supports with a positive profit factor.
Here's What Most Traders Get Wrong
Most traders treat an upper band touch as an automatic sell signal. In trending markets, price walks the upper band for weeks. The bands widen to accommodate the trend, and every "overbought" signal fires while price keeps climbing. The edge isn't in fading band touches — it's in watching what happens to band width and whether price confirms or fails to hold outside the band.
A close above the upper band in a high-momentum environment is continuation evidence. A close above the upper band followed by an immediate return inside the band — that's the reversal signal. The touch alone means nothing.
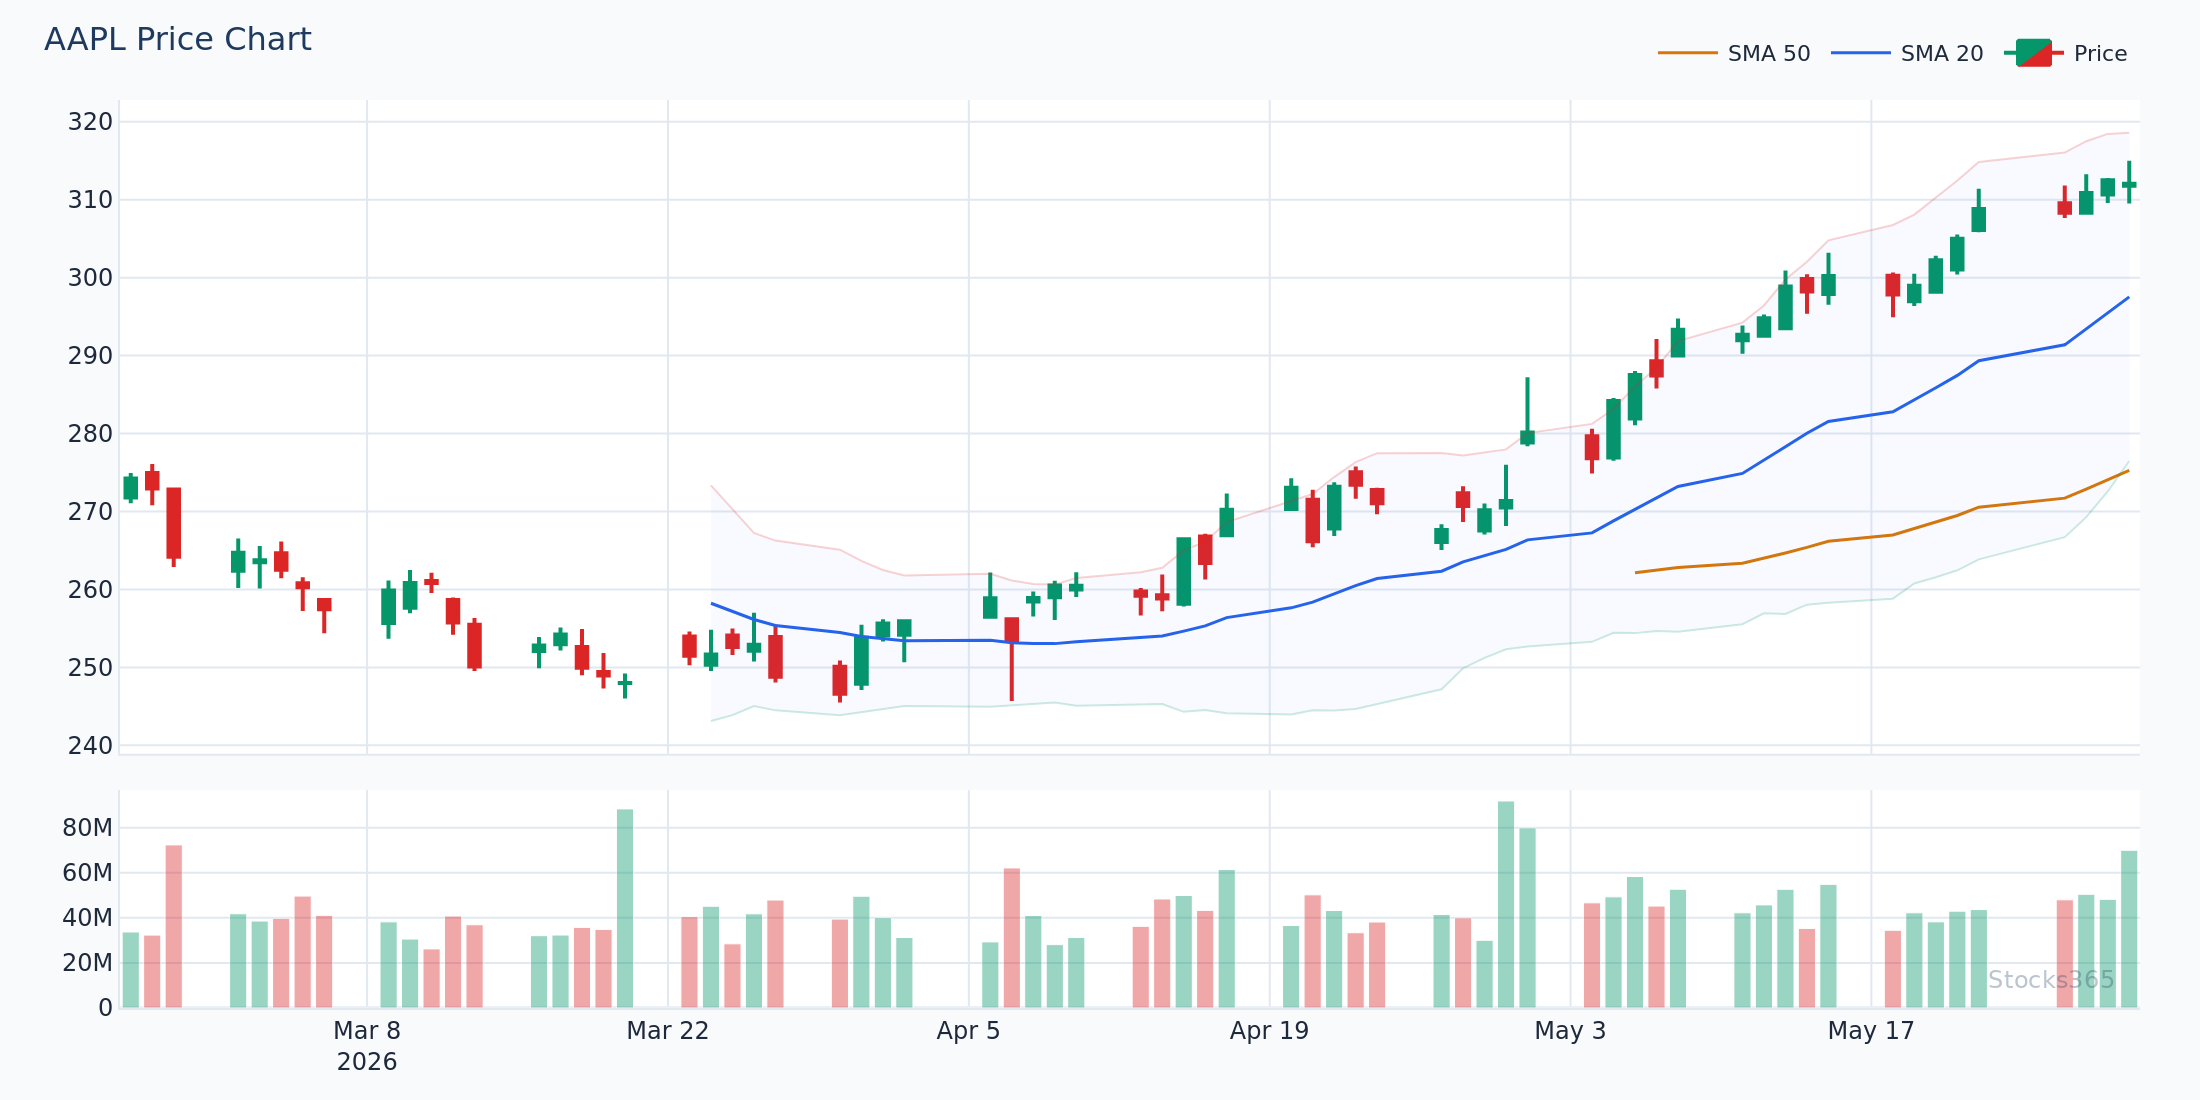
This chart illustrates a textbook band-walk: price repeatedly closes near or above the upper band while the bands expand outward. This is a trending market, not an overbought one. Selling every upper band touch here would have produced a string of losing trades. The pattern invalidates when price closes back below the 20-SMA with a momentum shift confirmed by declining volume on up days.
The Three Core Bollinger Band Setups
1. The Bollinger Squeeze Breakout
This is the highest-quality setup. Band width contracts to an extreme low. Then price breaks out with force — typically on above-average volume.
The setup logic: low volatility precedes high volatility. When the bands are tightest, the market is coiling. The breakout direction is the trade. Across our analysis of 14,266 signals, the squeeze breakout produced a profit factor of 1.03, with crypto performing best at a 51.8% win rate and forex performing worst at 47.1%.
The practical filter: require a breakout candle that closes outside the band by at least half the average true range. Weak pokes that barely breach the band have far lower follow-through.
2. The Band Walk (Trend Continuation)
In strong trends, price doesn't just touch a band — it rides it. Each pullback to the middle band (20-SMA) is a potential entry in the direction of the trend. You're not fading the move. You're joining it at a mean-reversion point within the trend structure.
This setup pairs naturally with trend confirmation tools. The Triple Moving Average Strategy for Trend Confirmation adds a reliable filter here — when all three moving averages align in the direction of the band walk, the probability of continuation improves meaningfully.
3. The W-Bottom and M-Top
These are John Bollinger's own preferred patterns. A W-bottom forms when price makes a low that pierces the lower band, pulls back, then makes a second low that stays inside the lower band. The second low failing to breach the band signals diminishing selling pressure.
The M-top is the mirror image. First push breaks above the upper band. Second push fails to reach it. That non-confirmation is the signal.
Both patterns require volume confirmation. Without it, they fail frequently.
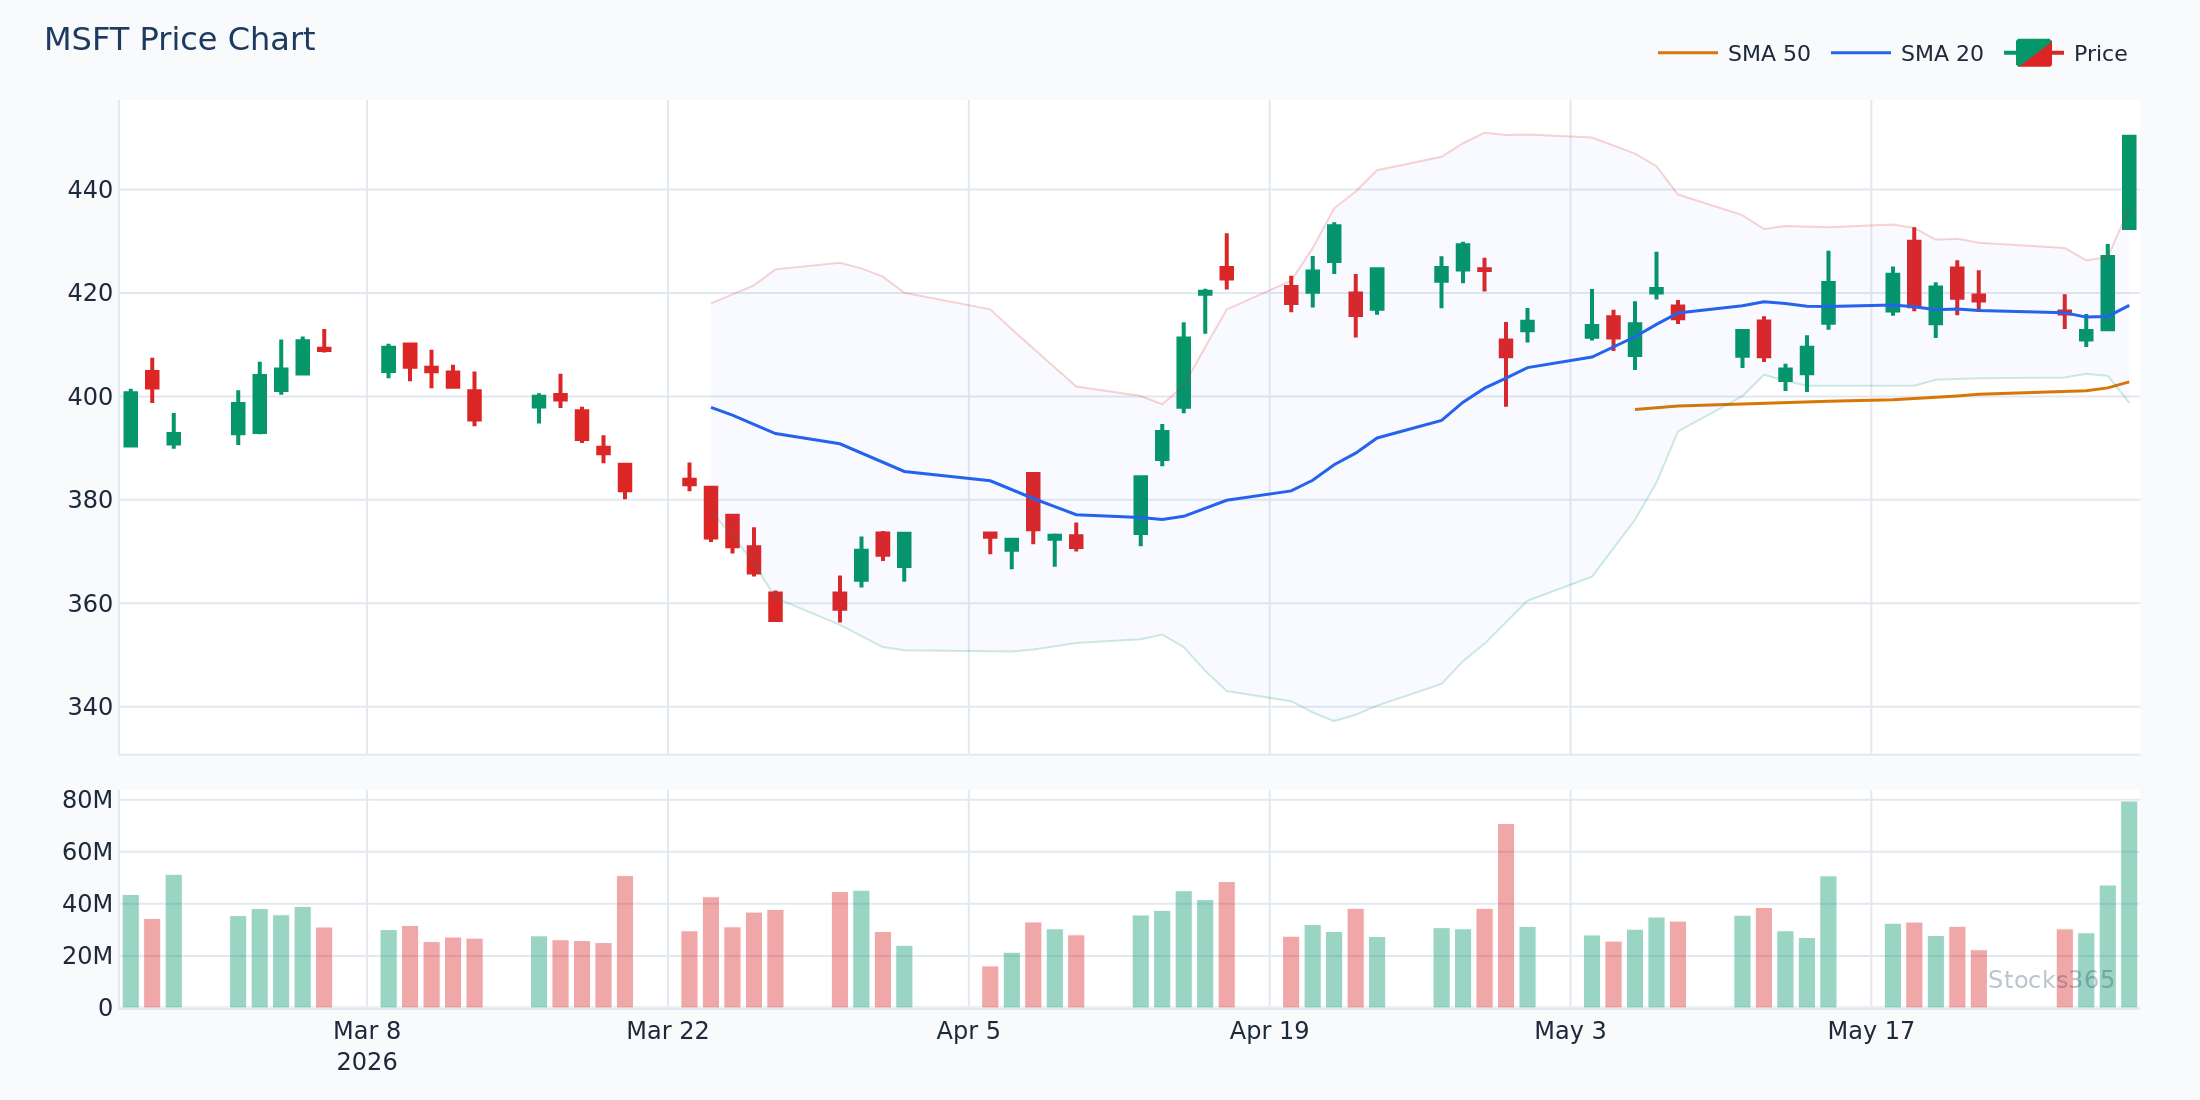
The first low here pushed through the lower band on heavy volume — capitulation selling. The second low formed inside the band with lighter volume, a classic non-confirmation. The move back above the 20-SMA with expanding volume is the entry trigger. The pattern fails if price breaks below the first low before completing the W structure.
Combining Bollinger Bands With Other Indicators
Bollinger Bands are a volatility tool, not a momentum tool. They tell you where price is relative to recent volatility. They don't tell you whether momentum is accelerating or decelerating. That's why pairing them with momentum indicators adds genuine information — not just noise.
Bollinger Bands + RSI
RSI adds the momentum dimension Bollinger Bands lack. When price touches the lower band and RSI simultaneously shows a bullish divergence (price makes a lower low, RSI makes a higher low), the reversal probability increases significantly.
For deeper RSI technique, the RSI Trendline Strategy at Stocks365 shows how drawing trendlines directly on the RSI plot produces earlier, higher-quality signals than standard overbought/oversold levels alone.
One important note: Our analysis of 3,026 BB + Stochastic Double Overbought signals found a win rate of just 49.9% with a profit factor of 0.91 — a losing strategy on average. Crypto was the exception at 58.0%, but commodities dragged to 40.7%. Combining two overbought signals amplifies the problem of fading strong trends. Use momentum divergence to confirm reversals, not momentum confirmation of extremes.
Bollinger Bands + Volume
Volume is the most important confirming signal for any Bollinger Band breakout. A squeeze breakout on 2x average volume is materially different from the same breakout on below-average volume. The Volume-Weighted Moving Average (VWMA) provides a clean way to assess whether the breakout candle carries genuine institutional participation or is just retail noise.
Bollinger Bands + MACD
MACD crossovers near Bollinger Band boundaries are a powerful combination for trend entries. A MACD bullish crossover occurring while price sits at the lower band — and while band width is expanding after a squeeze — stacks multiple technical factors in the same direction. For currency pair applications specifically, the MACD in Forex Trading guide covers how this plays out across major pairs.
Price here made a lower low that touched the lower band while RSI held above its prior low — a clean bullish divergence. The divergence doesn't guarantee reversal, but it substantially reduces the probability of immediate continuation lower. Confirmation requires price to close back above the 20-SMA. A break to new lows on the price chart invalidates the divergence entirely.
When Bollinger Bands Fail (And Why)
Bollinger Bands fail in two specific environments: sustained low-volatility grinds and explosive directional trending markets with expanding volatility.
In a low-volatility grind, the bands stay narrow for extended periods. Breakout signals fire repeatedly, each one failing because there's no underlying momentum to sustain the move. The profit factor for the squeeze breakout strategy in forex — 47.1% win rate — reflects this problem. Currency pairs often compress for weeks, produce a breakout, then reverse into the range.
In explosive trends, mean-reversion signals at the bands simply don't work. Price overshoots statistical bounds repeatedly. The upper band touch signal produced a 49.6% win rate across 3,255 signals — essentially a coin flip with a slight negative edge. Our research dashboard shows this clearly: the worst performance for band-touch fade signals consistently appears during high-momentum trending regimes.
The fix isn't to abandon Bollinger Bands — it's to understand which regime you're in. For regime identification, the Golden Cross vs. Death Cross framework provides a clean structural filter. When a golden cross is active, don't fade upper band touches. When a death cross is in effect, don't buy lower band touches expecting reversals.
Ignore the regime. Lose the trade.
Default Settings vs. Custom Settings
The standard Bollinger Band settings are 20 periods and 2 standard deviations. These are defaults, not laws.
Shorter lookback periods (10-15) make the bands more reactive — useful for intraday traders who need faster signals. Longer lookback periods (50+) smooth the bands considerably, better suited for swing traders and investors holding positions over weeks.
The multiplier adjustment is less common but worth knowing. A multiplier of 1.5 produces tighter bands — price touches the bands more frequently, which increases signal frequency but reduces reliability per signal. A multiplier of 2.5 produces wider bands with fewer touches, each carrying more statistical significance.
For most applications, the 20/2 default is appropriate. Change it only when you have a specific, tested reason.
Bollinger Bands Across Asset Classes
The indicator doesn't behave identically across every market. This matters for position sizing and strategy selection.
Equities: The band-walk setup performs well during earnings-driven trends. Squeeze breakouts on individual stocks often coincide with pre-earnings compression followed by post-earnings expansion. For a detailed real-world example, the Bollinger Bands Case Study on Apple decodes how these patterns played out across a full market cycle.
Crypto: Higher volatility means wider bands and more frequent extreme readings. The squeeze breakout and band-walk setups both outperform their equity equivalents in crypto — our data shows a 51.8% win rate on squeeze breakouts versus the overall 49.5%. Crypto trends hard and fast when it moves.
Forex: The weakest environment for most Bollinger setups. Currencies mean-revert frequently, making squeeze breakouts prone to whipsaw. The 47.1% win rate on forex squeeze breakouts is below random chance. Use Bollinger Bands in forex as a regime filter, not as a primary entry signal.
Commodities: Seasonal patterns and macro events create sharp one-directional moves that punish mean-reversion strategies. The commodities win rates across both band-touch (41.5%) and double-overbought (40.7%) setups are the worst in our dataset. Caution warranted.
For a broader look at whether moving average-based tools hold up across asset classes, the data-driven moving average analysis provides useful context — the conclusions apply directly to the SMA component embedded in every Bollinger Band calculation.
Reading the Stochastic Alongside Bollinger Bands
The Stochastic Oscillator adds cycle timing to Bollinger Band setups. When the Stochastic drops below 20 at the same moment price touches the lower Bollinger Band, the signal is more specific: you're at a volatility extreme and a short-term momentum cycle low simultaneously.
But use this combination carefully. The double-overbought combination (BB upper band + Stochastic above 80) showed a negative edge in our backtesting across most asset classes. The explanation is intuitive: two overbought signals together often just mean you're in a strong uptrend. For a complete walkthrough of Stochastic mechanics, the step-by-step Stochastic Oscillator guide is the right starting point before applying this combination.
Also consider how the Stochastic interacts with the broader momentum picture — a Stochastic at 20 in a downtrend is very different from a Stochastic at 20 in a range. Context determines everything.
What to Watch For
- Bollinger Squeeze on tech stocks: When band width drops below the 20th percentile of its 52-week range on a daily chart, watch for a breakout candle with volume at least 1.5x the 20-day average. The subsequent move often extends 2–3 ATR before the next consolidation.
- W-bottom non-confirmations at cycle lows: After a broad market drawdown of 15%+ in large-cap equities, look for individual stocks where the second low in a potential W-bottom forms inside the lower band on declining volume. This pattern in the context of broader market stabilization has historically produced sharp mean-reversion moves.
- Band-walk entries during golden cross regimes: When the 50-SMA is above the 200-SMA (golden cross active), pullbacks to the 20-SMA middle band on declining volume in trending momentum stocks represent continuation entries — not reversal setups.
- Crypto squeeze breakouts with VWMA confirmation: In crypto, when price breaks above the upper Bollinger Band and simultaneously closes above the VWMA with volume surging, the follow-through rate improves materially. This is the cleanest, highest-conviction Bollinger setup our data supports in that asset class.
- Avoid band-touch fades in commodities: The data is unambiguous — mean-reversion Bollinger setups in commodity markets underperform significantly. Use the bands for range context only, not as entry triggers in this asset class.
How Stocks365 Uses This
Bollinger Bands in the Stocks365 Trust Score System
Bollinger Bands are one of 12+ indicators integrated into the Stocks365 Trust Score — our proprietary signal quality rating applied to every alert on the signals dashboard.
Specifically, Bollinger Band data contributes to two dimensions of the Trust Score:
- Volatility Regime Scoring: Band width percentile rank determines whether a signal is firing in a compressed or expanded volatility environment. Breakout signals in low-band-width environments receive higher volatility regime scores. Mean-reversion signals in high-band-width environments are penalized.
- Indicator Agreement Scoring: When a Bollinger Band signal aligns with RSI, MACD, or volume confirmation, the agreement score rises. A band touch with no confirming momentum signal receives a low agreement score and typically a lower overall Trust Score — reflecting exactly the kind of low-reliability setup our backtesting identified.
When you view a signal like AAPL on the Stocks365 platform, the Trust Score reflects this multi-factor assessment — not just a raw band touch, but how that touch fits within volatility regime, momentum context, and indicator agreement. That's the difference between a signal and a high-quality signal.
Key Takeaways
- Bollinger Bands measure volatility, not direction. The middle band is a 20-period SMA; upper and lower bands are ±2 standard deviations.
- The Bollinger Squeeze Breakout is the only setup with a positive profit factor (1.03) in our backtested data — but only by a small margin, and only in the right asset classes.
- Band touches are not signals. What matters is what price does after the touch — does it hold outside the band, or immediately return inside?
- The band-walk in trending markets is real. In a golden cross regime, upper band touches are continuation evidence, not reversal signals.
- Crypto outperforms; forex and commodities underperform across all core Bollinger setups in our dataset. Adjust expectations and position sizing accordingly.
- Combine Bollinger Bands with volume, RSI divergence, or MACD to add the momentum dimension the indicator lacks on its own.
- The regime matters above all. Know whether you're in a trending, ranging, or transitioning market before applying any Bollinger Band setup.