
Golden Cross vs Death Cross: The Moving Average Signals That Move Markets
Two crossovers dominate trading headlines more than almost any other technical signal. The golden cross and the death cross. When either appears on a major index or large-cap stock, institutional desks take notice, financial media runs the story, and retail traders flood into positions. But are these signals as powerful as the hype suggests — or are most traders using them completely wrong?
Let's cut through the noise.
What Is a Golden Cross?
A golden cross occurs when a short-term moving average crosses above a long-term moving average. The most widely watched version: the 50-day simple moving average (50-SMA) crossing above the 200-day simple moving average (200-SMA). This crossover is broadly interpreted as a bullish signal — a sign that medium-term momentum has shifted decisively to the upside.
Three distinct phases define a genuine golden cross setup:
- Phase 1 — The Downtrend: Price trades below both the 50-SMA and 200-SMA. Bears are in control.
- Phase 2 — The Crossover: The 50-SMA turns upward and crosses through the 200-SMA from below. This is the signal itself.
- Phase 3 — The Confirmation: Price holds above both moving averages. Volume expands. The uptrend accelerates.
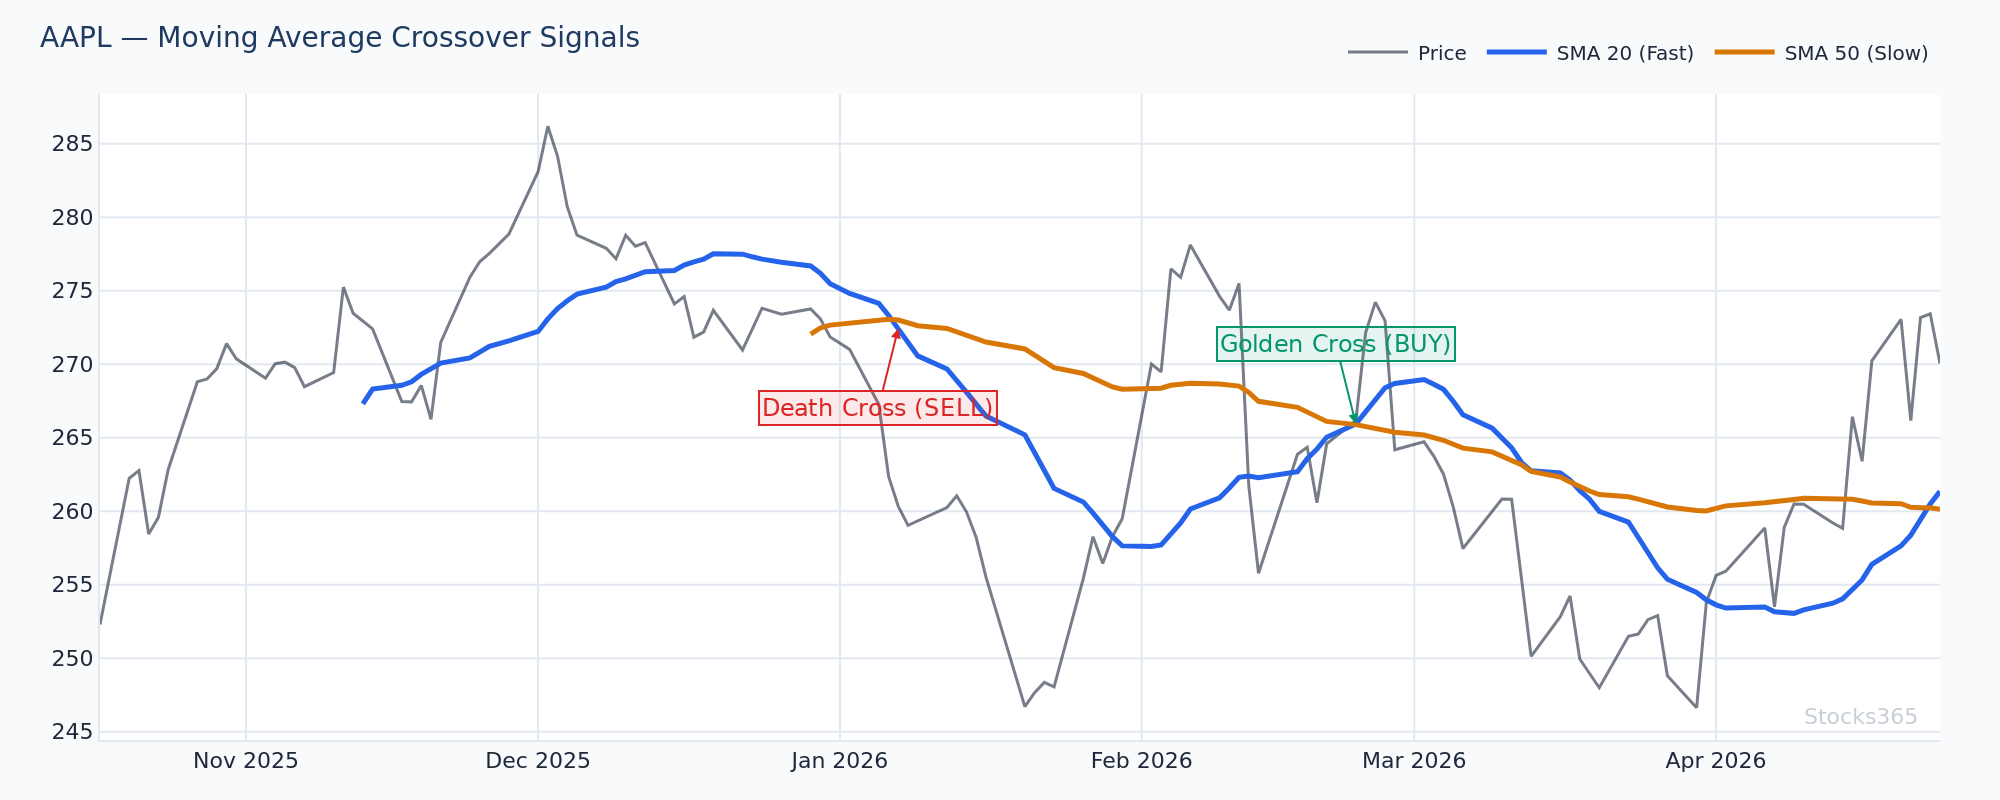
This chart shows the 50-SMA curling upward toward the 200-SMA after a prolonged base. When the crossover fires and price holds above both lines, it signals the early stage of a potential trend reversal. The pattern invalidates quickly if price falls back below the 200-SMA within a few sessions — that's a false breakout, not a confirmed golden cross.
What Is a Death Cross?
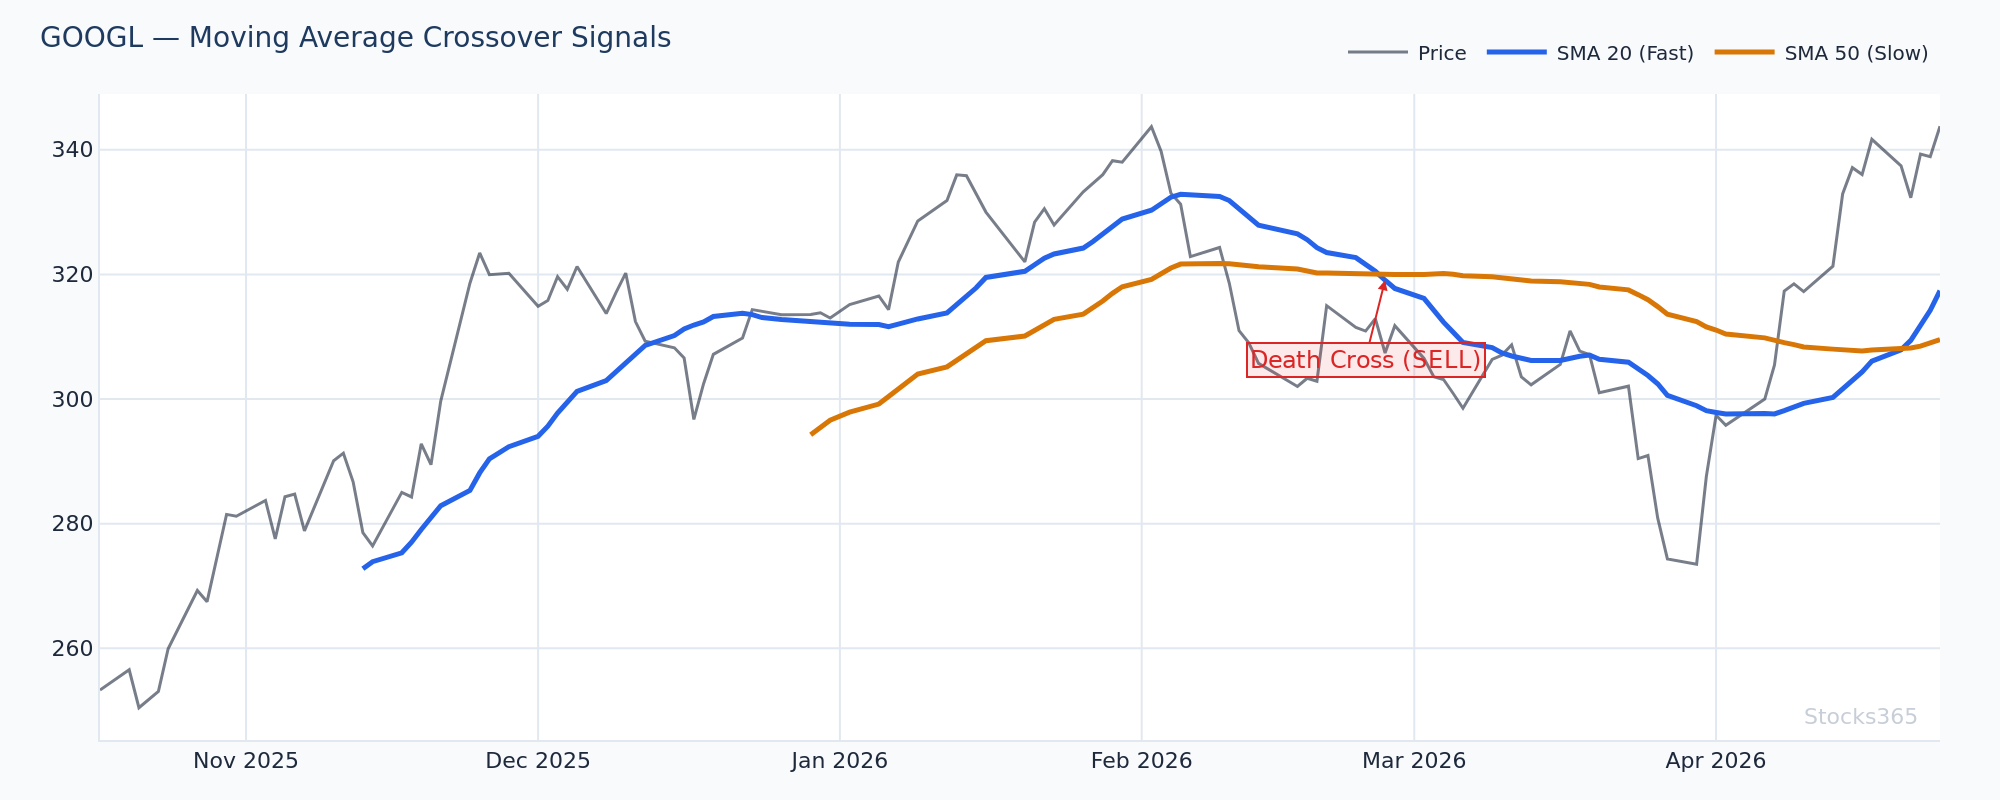
The death cross is the mirror image. It forms when the 50-SMA crosses below the 200-SMA, signaling that short-term momentum has deteriorated enough to drag the medium-term average under the long-term baseline. Markets treat this as a bearish structural shift.
The same three-phase logic applies in reverse:
- Phase 1 — The Uptrend Stalls: Price begins failing at resistance. The 50-SMA flattens.
- Phase 2 — The Crossover: The 50-SMA rolls over and cuts below the 200-SMA.
- Phase 3 — Acceleration Lower: Price fails to reclaim the 200-SMA. Selling pressure mounts.
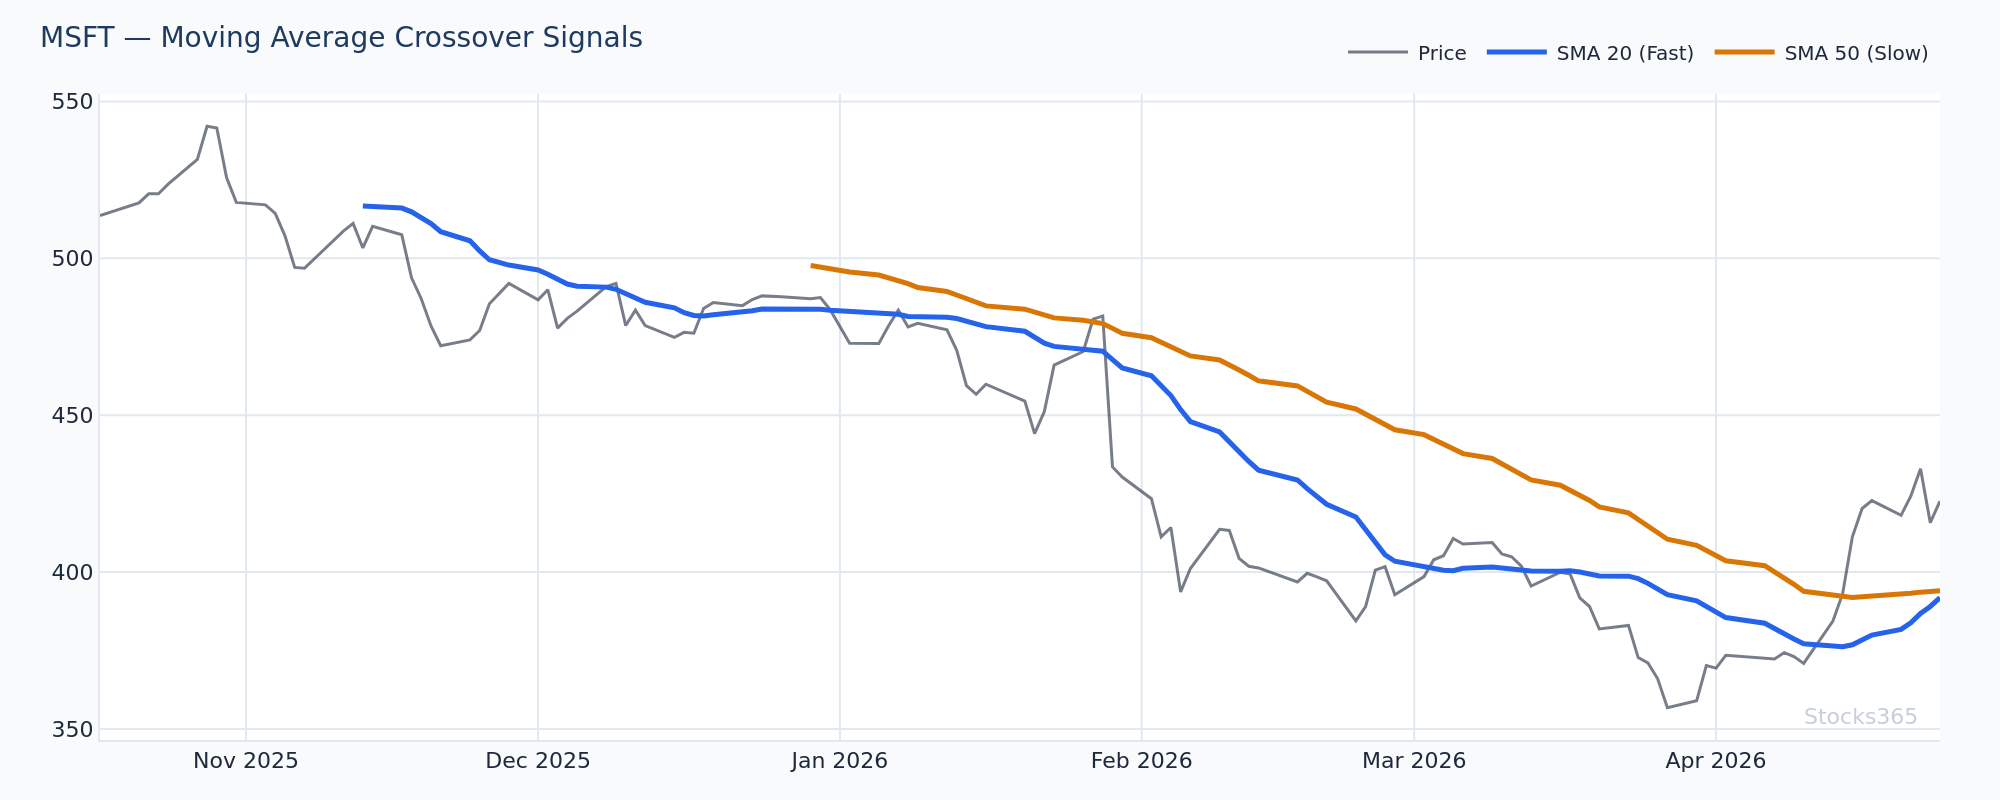
Here you can see the 50-SMA rolling over while price trades in a series of lower highs beneath the 200-SMA. Once the cross completes, any rally that stalls at the 200-SMA from below acts as resistance confirmation. The setup breaks down — and turns bullish — if price reclaims the 200-SMA on strong volume and the 50-SMA begins flattening.
The Critical Distinction: Lagging Signals by Design
Here's what most traders get wrong: they treat the golden cross or death cross as a predictive signal when it's actually a confirmatory one. Moving averages are lagging indicators. By definition. The crossover doesn't predict the trend — it confirms that a trend has already been established long enough to shift a major average.
This means buying the exact moment a golden cross fires often means entering after a significant portion of the move has already happened. The 50-SMA doesn't cross the 200-SMA after a two-day rally. It takes weeks of sustained buying pressure. By the time the cross appears, early trend followers are already sitting on gains. Late entries using the raw signal alone frequently experience the dreaded "whipsaw" — buying the cross, then watching price pull back sharply as profit-taking hits.
The edge isn't in the crossover. It's in how price behaves around it.
Golden Cross vs Death Cross: Key Differences at a Glance
| Factor | Golden Cross | Death Cross |
|---|---|---|
| Signal Type | Bullish | Bearish |
| 50-SMA Direction | Crosses above 200-SMA | Crosses below 200-SMA |
| Market Interpretation | Trend reversal to upside | Trend reversal to downside |
| Reliability | Higher in confirmed bull regimes | Higher in confirmed bear regimes |
| False Signal Risk | Elevated in choppy, sideways markets | Elevated in low-volatility ranges |
When Golden Cross and Death Cross Signals Actually Work
Trend Context Is Everything
These signals perform best in trending markets and worst in ranging or choppy conditions. A golden cross firing on a stock that's been consolidating sideways for six months in a narrow band is far less meaningful than one appearing after a deep corrective pullback in a fundamentally strong sector. The market regime matters more than the crossover itself.
In strong bull markets, golden cross signals tend to lead to sustained follow-through. In bear markets, the same signal produces more false positives — rallies that quickly roll back over. Death crosses in genuine bear regimes accelerate selling. Death crosses in bull-market corrections often resolve quickly with the 50-SMA reclaiming the 200-SMA within weeks.
Volume Confirms or Kills the Signal
Volume is the single best filter for crossover quality. A golden cross forming on above-average volume — two times the 20-day average or more — carries far greater weight than one formed on thin, summer-session-style participation. Institutional buying shows up in volume. If the cross happens quietly, skepticism is warranted.
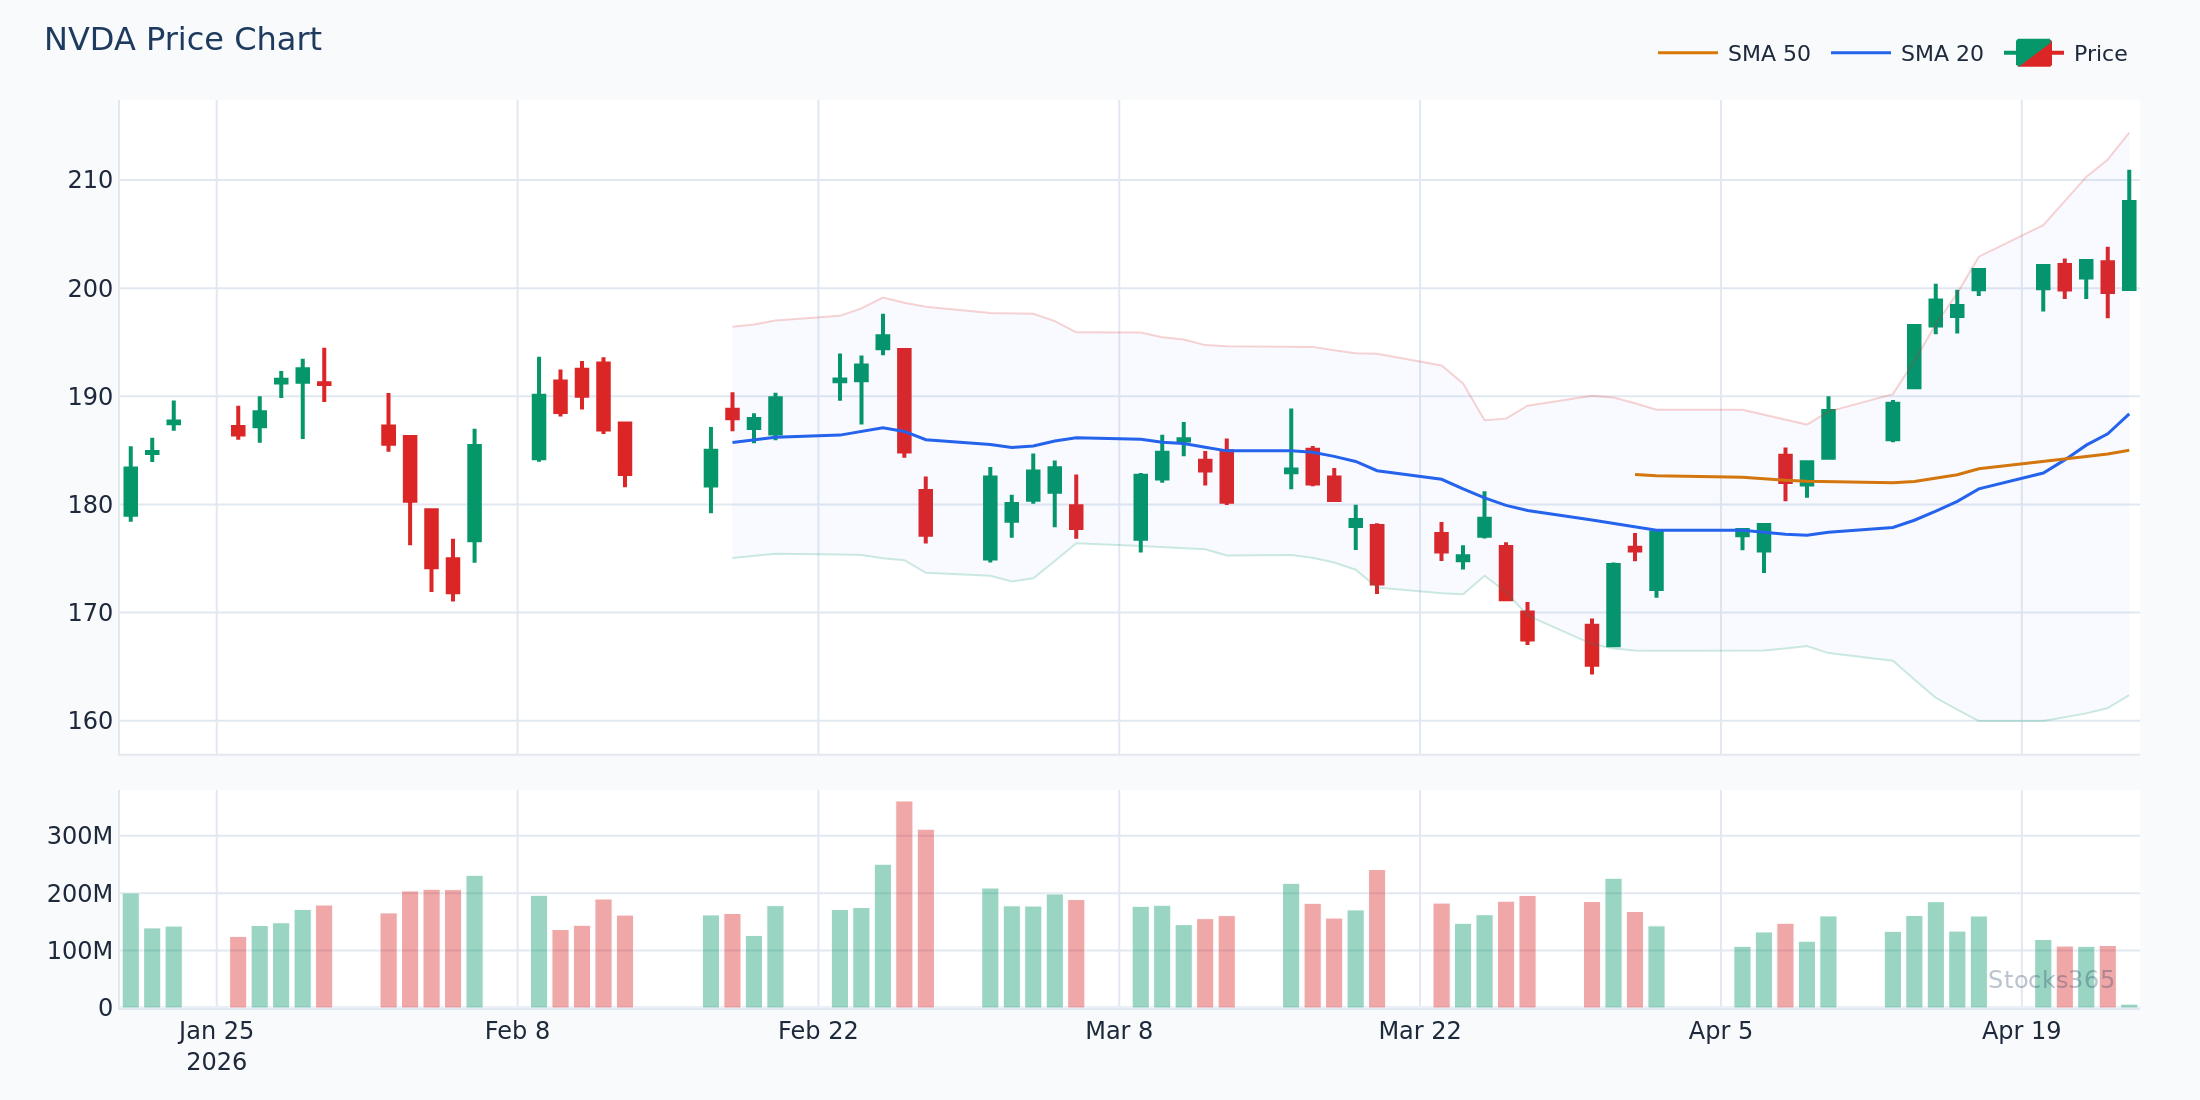
Notice the volume surge accompanying the breakout above both moving averages. When volume expands like this as the 50-SMA crosses the 200-SMA, it signals that large participants are accumulating — not just algorithmic noise. Without that volume confirmation, the same crossover on a low-volume day often leads to a failed breakout and quick reversal.
Pair with RSI for Superior Entries
Moving average crossovers tell you direction. Momentum oscillators tell you strength. Combining them eliminates a significant portion of false signals. The best golden cross setups occur when the RSI is rising from oversold territory (below 30) but hasn't yet reached overbought levels — meaning momentum is building, not exhausted.
If you're not already comfortable reading RSI alongside these crossovers, start with What Is RSI? The Complete Beginner's Guide before layering it onto your moving average analysis. Once you understand the basics, mastering overbought and oversold RSI levels will sharpen your crossover entries significantly.
Death cross signals paired with RSI above 70 and rolling over are particularly potent. Momentum is already deteriorating from extended levels. That combination has historically led to more sustained downside than a death cross appearing when RSI is already deeply oversold.
Real-World Setup Examples: How to Read These Signals in Practice
The Classic Golden Cross Entry
Here's a clean setup pattern to recognize. Price has been in a downtrend, then begins basing — forming higher lows, but not yet higher highs. The 50-SMA, which has been falling, starts to flatten. Price reclaims the 200-SMA on strong volume. Then the 50-SMA completes the cross above the 200-SMA. RSI at this point reads between 50 and 65 — bullish momentum territory without being overbought. Volume on the crossover day is at least 1.5x the 20-day average.
That's the high-quality setup. Not just the cross. The full confluence.
This setup demonstrates the ideal golden cross: the 50-SMA crossing the 200-SMA while price trades above both, RSI trending upward through the 50-60 zone, and volume expanding on the signal day. When all three align, the probability of follow-through increases meaningfully. A close back below the 200-SMA on elevated volume invalidates the setup entirely.
The Death Cross That Actually Held
Contrast that with a high-quality death cross. Price has failed multiple times to break above a prior high. The 50-SMA has crossed below the 200-SMA. Each rally attempt stalls exactly at the 200-SMA — now acting as resistance from above. RSI bounces reach 50-55 but can't push through. Volume on down days consistently exceeds volume on up days. That's a bearish market structure with a death cross as the headline indicator.
The death cross alone isn't the trade. The behavior of price relative to the moving averages after the cross is where the real edge lives.
Timeframes: Which One Matters Most?
The 50/200-SMA combination dominates because it applies primarily to daily charts, which represent the standard timeframe for institutional positioning decisions. But crossovers exist on every timeframe — and the rules change depending on which you use.
- Weekly chart crossovers are slower to form but carry the most structural weight. A golden cross on the weekly is a multi-month or multi-year bullish signal.
- Daily chart crossovers are the standard. Most algorithmic triggers and media coverage focus here.
- 4-hour and hourly crossovers are used by active swing traders and day traders. They generate far more signals, far more false positives, and require tighter confirmation filters.
For optimal RSI settings by timeframe — which directly complements your moving average crossover strategy — the same logic applies: longer timeframes require fewer filters, shorter timeframes demand more confluence before acting.
Common Variations Beyond 50/200
The 50/200 pairing is dominant but not exclusive. Other combinations traders use:
- 10/50 SMA cross: Shorter-term signal, often used by swing traders on the daily chart. Faster to form, more frequent, less reliable as a standalone signal.
- 20/50 EMA cross: Uses exponential moving averages, which weight recent price action more heavily. Faster responses to trend changes but also more whipsaw-prone.
- 13/48 EMA cross: A variation popularized by certain futures and forex traders. Essentially the same concept, slightly different lag characteristics.
Regardless of which combination you use, the principles remain identical: confirm with volume, layer in RSI momentum, respect the market regime.
Death Cross Myths: What History Actually Shows
The death cross has a dramatic name — and markets have consistently responded to it with fear. But historical analysis reveals a more nuanced picture. Many well-documented death cross formations on major indices have resolved within weeks or months with a golden cross reclaiming, particularly during bull market corrections. The signal is not inherently catastrophic.
What the death cross does reliably signal is that risk is elevated. Not that markets will collapse. Use it as a regime indicator — a reason to reduce position sizing, tighten stops, and avoid aggressive long entries — not necessarily as a trigger to short everything in sight.
Pair the death cross with RSI divergence signals for a more complete picture. If price makes a new low but RSI fails to confirm with a new low, that divergence within a death cross regime often signals the early exhaustion of the downtrend — a potential reversal setup before the golden cross officially forms.
Golden Cross and Death Cross in Different Asset Classes
Equities
The signals work well on individual stocks and major indices. Large-cap stocks with liquid options markets — where institutional players are active — generate the most reliable crossover signals because moving average levels are actively monitored and traded around by algorithms.
Crypto
Bitcoin and major cryptocurrencies respond strongly to crossover signals due to the high proportion of retail and algorithmic traders watching them. However, the increased volatility of crypto means false signals are more frequent. Volume confirmation becomes even more critical in this asset class. Hidden RSI divergence is particularly useful in crypto markets where trend continuation setups within crossover regimes are common.
Forex
Currency pairs use crossover signals effectively on higher timeframes (daily, weekly). The 24-hour nature of forex markets means volume data is less standardized, so confirmation approaches shift more toward RSI and price action patterns.
How to Combine Golden Cross and Death Cross with Other Indicators
The highest-probability setups use crossovers as the framework and layer in additional filters:
- RSI: Confirms momentum direction and warns of overbought/oversold extremes. See how to use RSI in trading for a complete step-by-step approach.
- MACD: Another moving average-based momentum tool. MACD bullish crossover aligning with a golden cross dramatically strengthens the signal.
- Bollinger Bands: Price breaking above the upper band after a golden cross on expanding bands signals strong trend initiation.
- Stochastic Oscillator: Useful for timing entries within the larger crossover framework. When a golden cross is in play and the stochastic dips to oversold on a pullback, that's a refined entry. Explore the RSI vs Stochastic Oscillator comparison to understand which momentum tool suits your style.
What to Watch For
- Golden cross setups where RSI reclaims the 50 level simultaneously: When the 50-SMA crosses the 200-SMA at the same time RSI breaks above 50 after being below it, the dual confirmation historically precedes stronger, more sustained uptrends than the crossover alone.
- Death cross formations in sector ETFs: When a sector ETF forms a death cross while the broader index remains in golden cross territory, it signals sector rotation risk — the lagging sector often continues underperforming for weeks even as the overall market holds up.
- Volume divergence during crossover formation: If the 50-SMA is approaching the 200-SMA on declining volume during what looks like a golden cross setup, the cross may form but fail to produce follow-through. Wait for a volume surge to confirm the breakout is real.
- Post-death-cross bounces to the 200-SMA: After a confirmed death cross, watch for price to rally back and test the 200-SMA from below. If RSI reaches 50-55 on that bounce and stalls, it's a high-probability short setup. If price bursts through the 200-SMA on heavy volume, the death cross regime is reversing.
- Golden cross on weekly chart while daily is in death cross: This multi-timeframe conflict often resolves bullishly over a longer horizon — the weekly golden cross tends to dominate, and the daily death cross turns out to be a correction within a larger uptrend.
Key Takeaways
- The golden cross (50-SMA above 200-SMA) is bullish; the death cross (50-SMA below 200-SMA) is bearish — but both are lagging signals, not predictive ones.
- Market regime matters more than the crossover itself. In bull markets, golden crosses are highly reliable. In bear markets, false golden crosses are common.
- Volume confirmation separates high-quality crossovers from noise. Look for 1.5-2x average daily volume on the signal day.
- Pair crossovers with RSI and momentum indicators to refine entries and filter false signals.
- The death cross is an elevated risk signal, not an automatic sell-everything indicator. Many death crosses resolve quickly in bull market corrections.
- Multi-timeframe analysis — especially weekly chart alignment — strengthens any crossover signal dramatically.
How Stocks365 Uses This
How Stocks365 Integrates Golden Cross and Death Cross Signals
The Stocks365 signals dashboard incorporates moving average crossover analysis as a core component of its market regime scoring — one of 12+ indicators that feed into the platform's trust score system. When a stock like AAPL forms a golden cross or death cross, the trust score system registers the shift in regime weighting, adjusting the agreement score across trend-following indicators accordingly.
The platform doesn't treat the crossover in isolation. Golden cross signals receive higher trust score weighting when they align with RSI momentum confirmation, expanding volume, and sector-level trend agreement. Death cross signals are flagged with elevated risk scores when they appear alongside deteriorating breadth and weakening momentum — not just on the moving average crossover alone. This multi-indicator regime approach is precisely why Stocks365 trust scores provide more reliable signal context than any single indicator in isolation.
| # | Strategy | Type | Win Rate | Sharpe | PF | N | Status |
|---|---|---|---|---|---|---|---|
| #1 | Golden Cross (SMA 50/200) | trend | 61.0% | 0.56 | 1.38 | 105 | TEST |
| #2 | Ichimoku Cloud Breakout Up | trend | 52.1% | 0.13 | 1.08 | 750 | TEST |
| #3 | ADX Trend + DI Short | trend | 50.1% | 0.11 | 1.07 | 11,899 | TEST |
| #4 | Ichimoku Cloud Breakout Down | trend | 46.5% | 0.10 | 1.06 | 837 | TEST |
| #5 | Price Crosses Below SMA 20 | trend | 50.9% | 0.09 | 1.06 | 3,332 | TEST |
Frequently Asked Questions
What is the difference between a golden cross and a death cross?
A golden cross forms when the 50-day moving average crosses above the 200-day moving average — a bullish structural signal. A death cross is the opposite: the 50-day crosses below the 200-day, signaling bearish structural momentum. Both are based on the same moving average relationship but indicate opposite directional bias.
Are golden cross and death cross signals reliable?
They are reliable as regime indicators — tools that tell you the prevailing trend structure — but less reliable as precise entry or exit timing tools. They work best in trending markets and lose reliability in choppy, sideways conditions. Combining them with volume analysis and RSI momentum confirmation significantly improves their practical value.
How long does it take for a golden cross or death cross to form?
There's no fixed timeframe. A crossover can take weeks to develop as the shorter-term moving average gradually closes the gap with the longer-term average. On daily charts using the 50/200-SMA combination, the formation period following a trend change typically spans several weeks to a few months of sustained directional price movement.
Can a death cross be a buying opportunity?
In specific contexts, yes. A death cross forming during a bull market correction — when the broader trend remains intact — often resolves with a golden cross reclaiming within weeks. If RSI shows bullish divergence while price prints new lows within a death cross regime, that combination can signal an early reversal setup. Context, momentum, and volume all matter more than the crossover label alone.
What moving average periods are best for golden cross and death cross analysis?
The 50/200 SMA combination on the daily chart is the most widely used and institutionally recognized. For shorter-term swing trading, the 10/50 or 20/50 combinations offer faster signals with higher false-positive rates. For longer-term macro analysis, weekly chart 50/200 crossovers carry the most structural significance. Match the periods and timeframe to your holding period and trading style.