
Do Moving Averages Work? The Answer Is More Complicated Than You Think
Every trader learns moving averages first. They're clean. They're visual. They feel like they should work. But do they actually deliver an edge — or are they just a way to make noise look meaningful?
The honest answer: it depends entirely on how you use them.
Stocks365 backtested 6,621 signals across stocks, crypto, and forex using SMA 20 crossover setups, and the results challenge almost everything you've read in a beginner trading guide. Some setups showed genuine edge. Others were statistical noise dressed up as strategy. Here's the full picture.
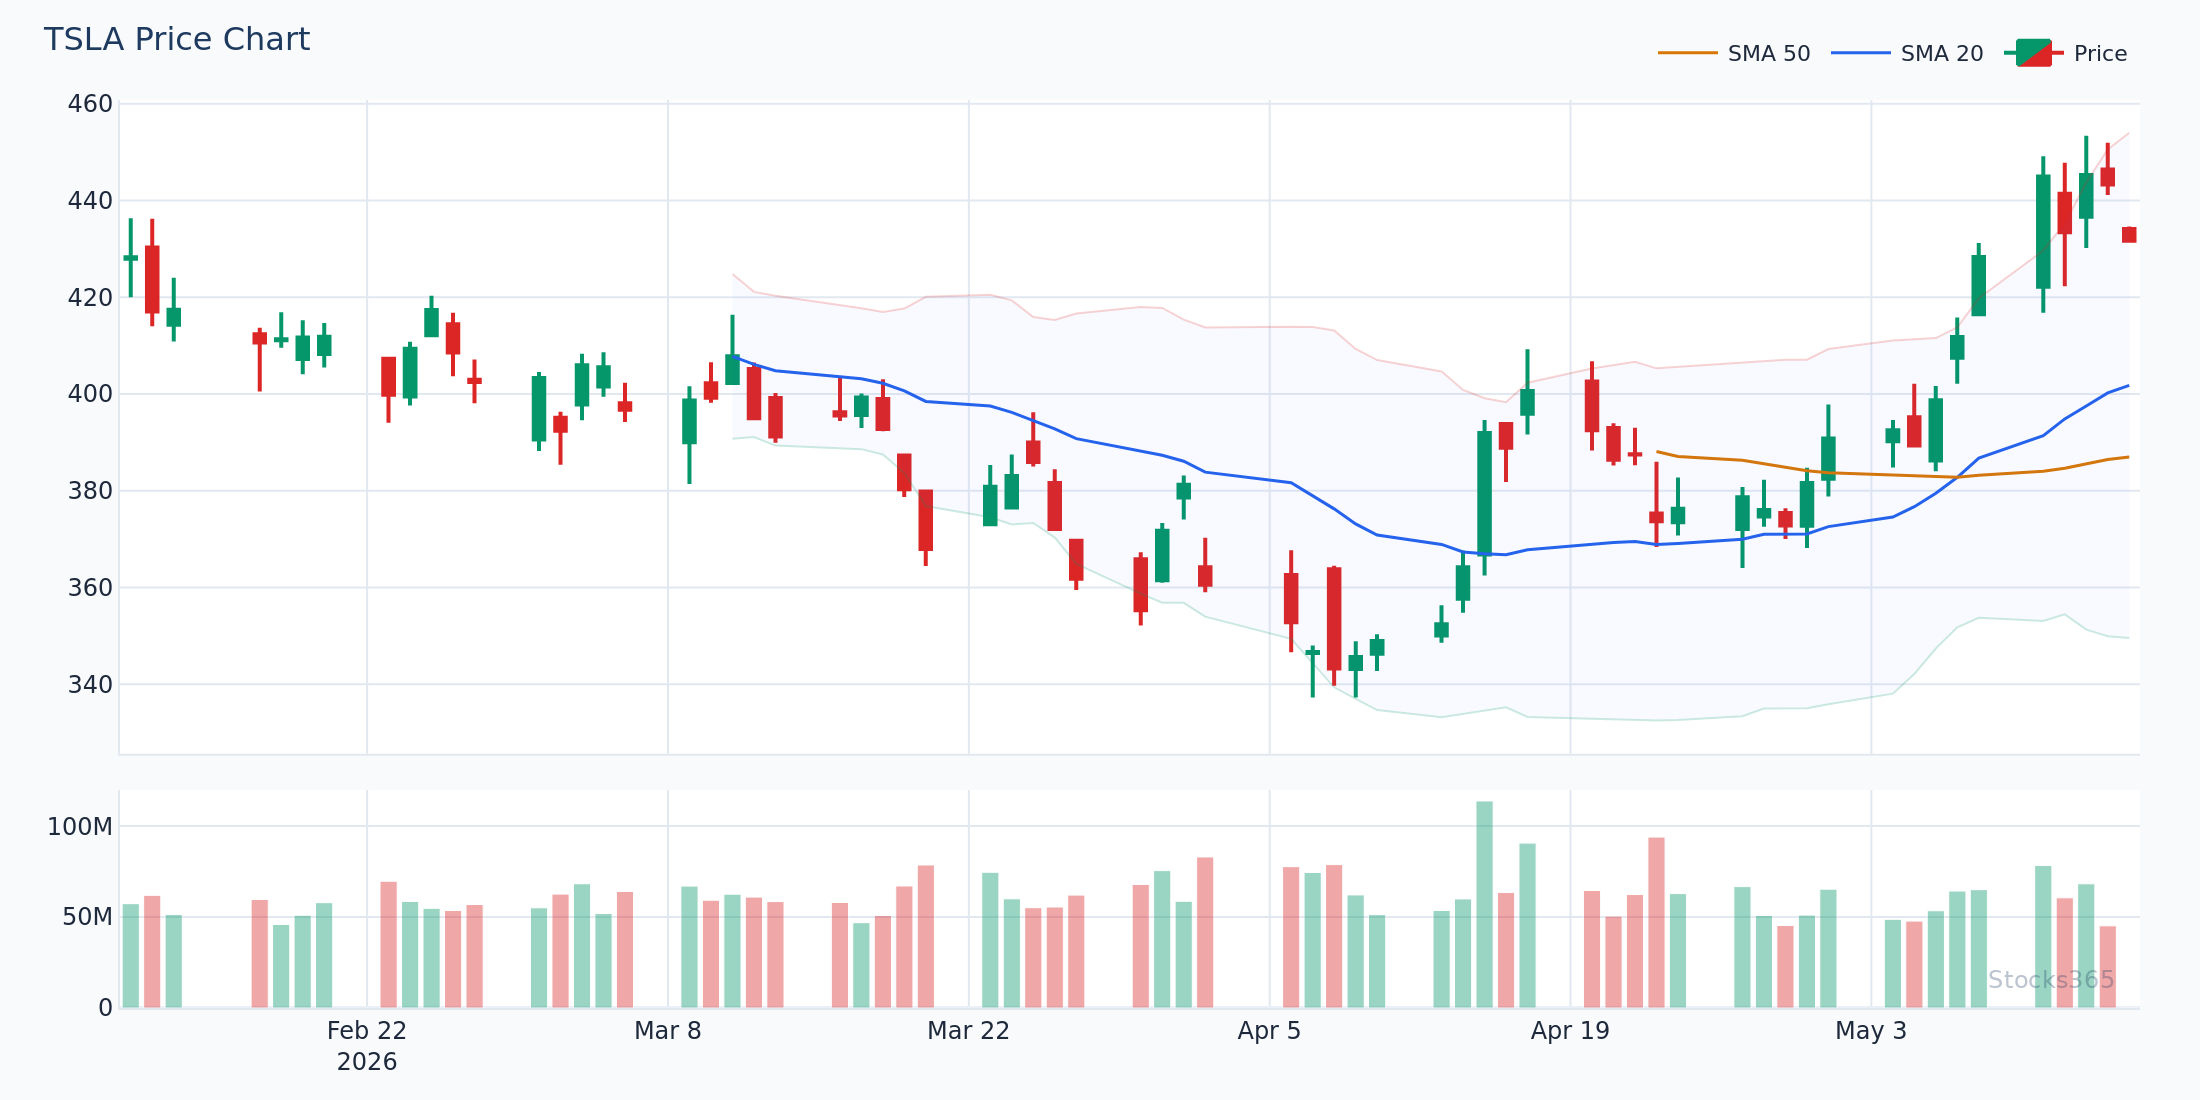
This chart shows a price crossover relative to the 20-SMA. When price crosses cleanly above with expanding volume, the pattern carries follow-through potential. When price crosses with shrinking volume or immediately reverses back through the average, the move typically fades within 3–5 sessions — that failed cross is often more informative than the signal itself.
What Moving Averages Actually Measure
A moving average smooths price data over a defined period. The 20-period SMA, for example, takes the closing prices of the last 20 candles and divides by 20. That's it. There's no predictive magic buried in the formula.
What moving averages do well:
- Identify trend direction — price above a rising MA signals upward momentum
- Define dynamic support and resistance — prices frequently respect major MAs during pullbacks
- Filter trade entries — taking longs only above the MA reduces countertrend trades
- Confirm momentum shifts — especially when combined with volume or indicators like RSI
What they don't do: predict reversals with accuracy in isolation. Relying on a single MA crossover as a standalone signal is where most traders lose money.
The Backtested Reality: What 6,600+ Signals Actually Show
Our analysis of 6,621 signals — split across the Price Crosses Below SMA 20 and Price Crosses Above SMA 20 setups — revealed a striking asymmetry between the two directions.
Price Crosses Below SMA 20: 50.9% win rate across 3,332 signals with a profit factor of 1.06 over a 10-day holding period. Marginal positive expectancy. Not exciting — but real.
Price Crosses Above SMA 20: 48.3% win rate across 3,289 signals with a profit factor of 0.88 over the same holding period. Negative expectancy. Buying every cross above the 20-SMA loses money over time.
"The bullish crossover feels intuitive. The data says it costs you money. That gap between intuition and evidence is where trading accounts go to die."
These aren't small samples prone to noise. Over 3,000 signals per setup is statistically meaningful. The conclusion is clear: not all moving average crossovers are created equal, and direction matters far more than most traders realize.
Explore the full methodology and additional signal breakdowns in our research dashboard.
When Moving Averages Work Best — And When They Fail
Asset Class Matters Enormously
The breakdown by asset class is where the backtested data gets genuinely useful. For the Price Crosses Below SMA 20 setup, crypto led with a 66.8% win rate. Forex came in worst at 42.5%. For the Price Crosses Above SMA 20 setup, stocks performed best at 52.3%, while crypto collapsed to 36.9%.
What drives this divergence? Three factors:
- Trend persistence — crypto trends harder and longer than forex, which means bearish breaks below key MAs carry more follow-through
- Mean reversion pressure — forex pairs are structurally range-bound more often, which kills momentum-based setups
- Volume dynamics — stocks have institutional order flow that respects technical levels; crypto has retail momentum that amplifies them; forex has liquidity that absorbs them
In a strong trending environment, price repeatedly tests the 20-SMA from above before resuming higher — each touch is a potential entry, not a reversal signal. The pattern invalidates when price closes decisively below the MA on above-average volume and fails to recover within two sessions. That failure candle is the confirmation most traders miss while waiting for the "perfect" setup.
Market Regime Changes Everything
Moving averages are trend-following tools. In trending markets, they perform. In choppy, sideways conditions, they generate whipsaws that bleed accounts through repeated small losses.
The fix isn't to abandon moving averages. It's to assess regime first.
A simple regime filter: if the 200-SMA is flat and price is oscillating above and below the 50-SMA repeatedly, you're in chop. Moving average crossover signals in that environment carry negative expectancy. Step back. Wait for the trend to assert itself before engaging MA-based entries.
Here's What Most Traders Get Wrong
Most traders treat a price cross above the 20-SMA as an automatic buy signal. It feels logical — price just broke above a key average, momentum is resuming, time to enter. The backtested data across 3,289 signals says otherwise: that setup produces a profit factor of 0.88, meaning you lose more than you make over time by acting on it mechanically.
The real edge isn't the cross itself. It's what happens in the 2–3 sessions after the cross. Does price hold above the MA and retest it as support? Does volume confirm the move? Does the MA itself turn upward? A cross that immediately fails — where price drops back below within one or two sessions — is a trap. The traders who learn to distinguish a genuine breakout from a failed cross are the ones who extract consistent value from this tool.
Moving Averages as Filters, Not Triggers
The most profitable use of moving averages isn't as entry triggers. It's as filters that improve other signals.
Consider these setups:
- RSI divergence + MA confirmation: When RSI shows bullish divergence on a pullback while price holds above the 50-SMA, the setup carries more conviction than either signal alone. Read more about RSI divergence in our RSI Trendline Strategy guide.
- MACD crossover + MA slope: A MACD bullish cross means more when the 20-SMA is already sloping upward. A cross while the MA is flat or declining is weak. Our MACD in Forex Trading article covers how to layer these signals in currency pairs.
- Triple MA alignment: When the 10, 20, and 50-period MAs align in the same direction with consistent spacing, trend strength is high. Breakouts in the direction of alignment carry the cleanest follow-through. Our Triple Moving Average Strategy breaks this down in full.
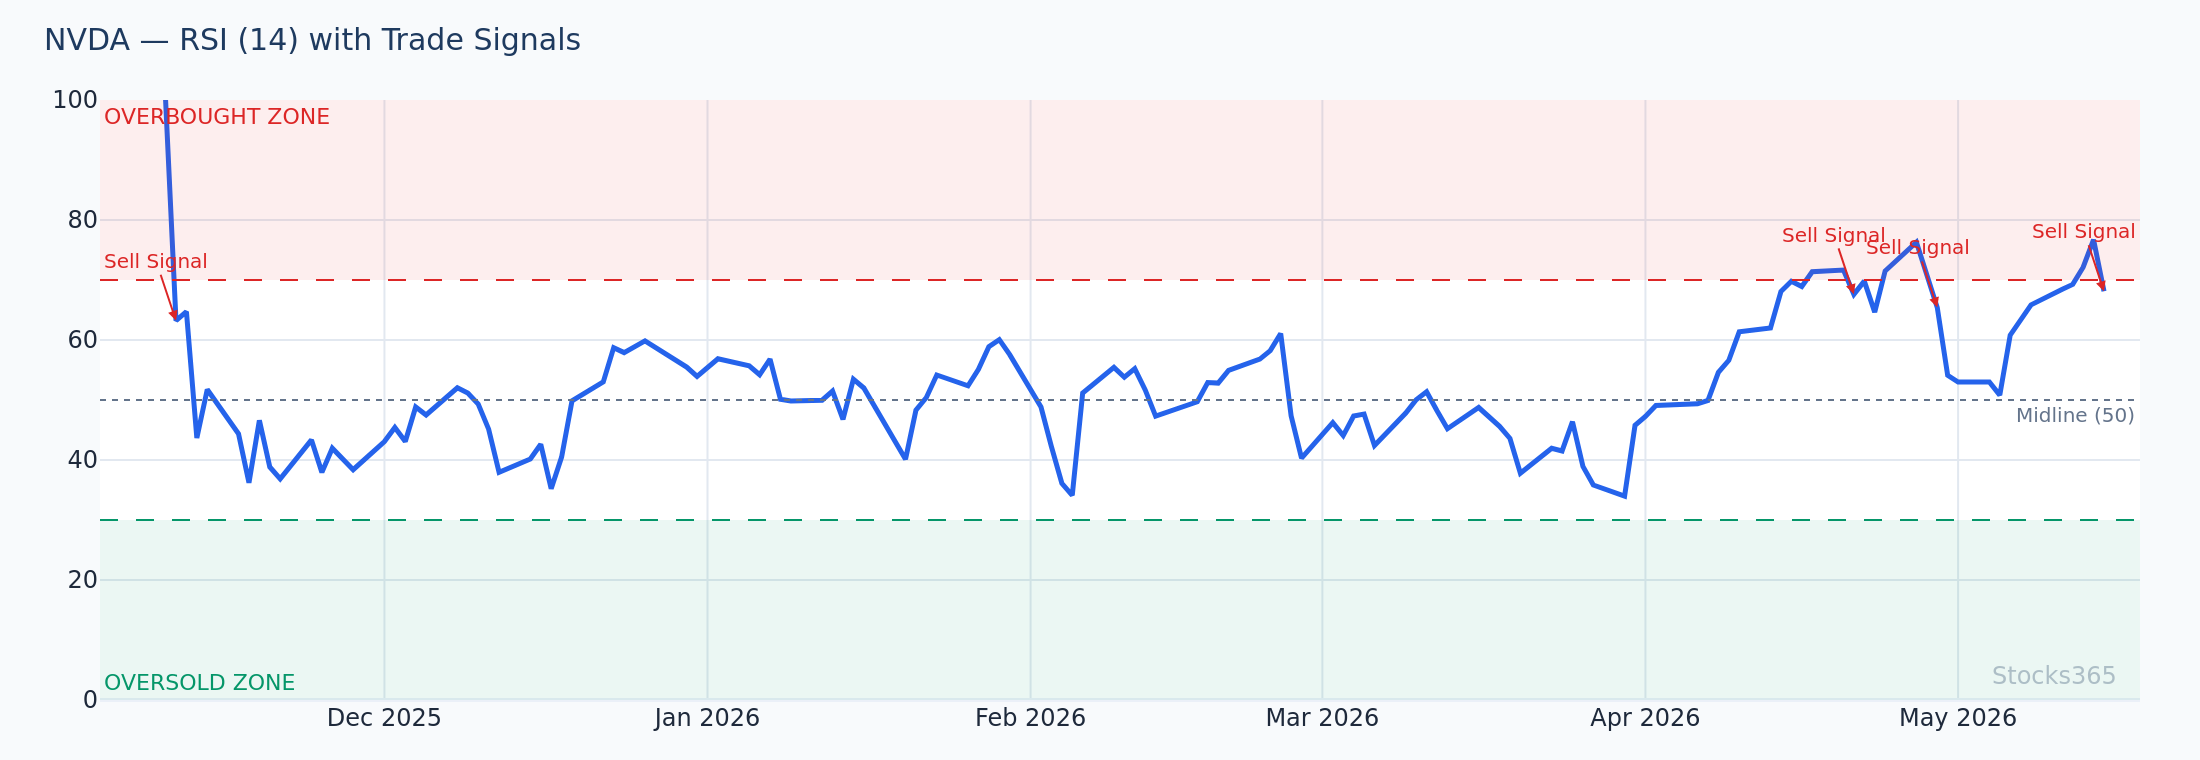
When RSI confirms a price crossover — holding above 50 during an upside MA cross, or breaking below 50 during a downside cross — win rates improve significantly versus the crossover signal in isolation. When RSI contradicts the MA signal (price crosses above the MA but RSI is already overbought above 70), the probability of a failed move increases sharply. Divergence between price structure and RSI momentum is one of the most reliable warning signs in technical analysis — see our guide on RSI overbought and oversold levels for context.
Choosing the Right Moving Average Period
Short-Term MAs (5–20 period)
Highly responsive to price. Excellent for identifying momentum shifts in active trends. Prone to whipsaws in choppy markets. Best used on higher-quality setups where volume and other indicators confirm. The 20-SMA is the most-watched short-term average among institutional traders, which is partly why it creates self-fulfilling support and resistance behavior.
Medium-Term MAs (50 period)
The institutional favorite. The 50-SMA defines intermediate trend. Pullbacks to this level in confirmed uptrends are watched by fund managers globally. When price tests the 50-SMA after an extended move and bounces with volume, that's a high-conviction setup. When it breaks with force, the trend has changed.
Long-Term MAs (100–200 period)
Macro trend filters. The 200-SMA separates bull and bear territory for most serious traders. Price above a rising 200-SMA: buy the dips. Price below a declining 200-SMA: sell the rips. These aren't entry signals — they're regime filters that shape how you approach every other setup.
For a deeper dive into period selection across different trading styles, the RSI Settings guide covers analogous trade-offs that apply directly to MA period selection.
EMA vs. SMA: Does It Actually Matter?
Exponential moving averages weight recent prices more heavily. Simple moving averages treat all periods equally. In practice, the difference is smaller than most traders think.
EMAs react faster to price changes. That's an advantage in fast markets — and a disadvantage in choppy ones, because they generate more false signals. SMAs are smoother and slower, which means entries come slightly later but with fewer whipsaws.
The choice matters less than consistency. Pick one. Apply it systematically. The edge comes from disciplined execution, not from optimizing between EMA and SMA.
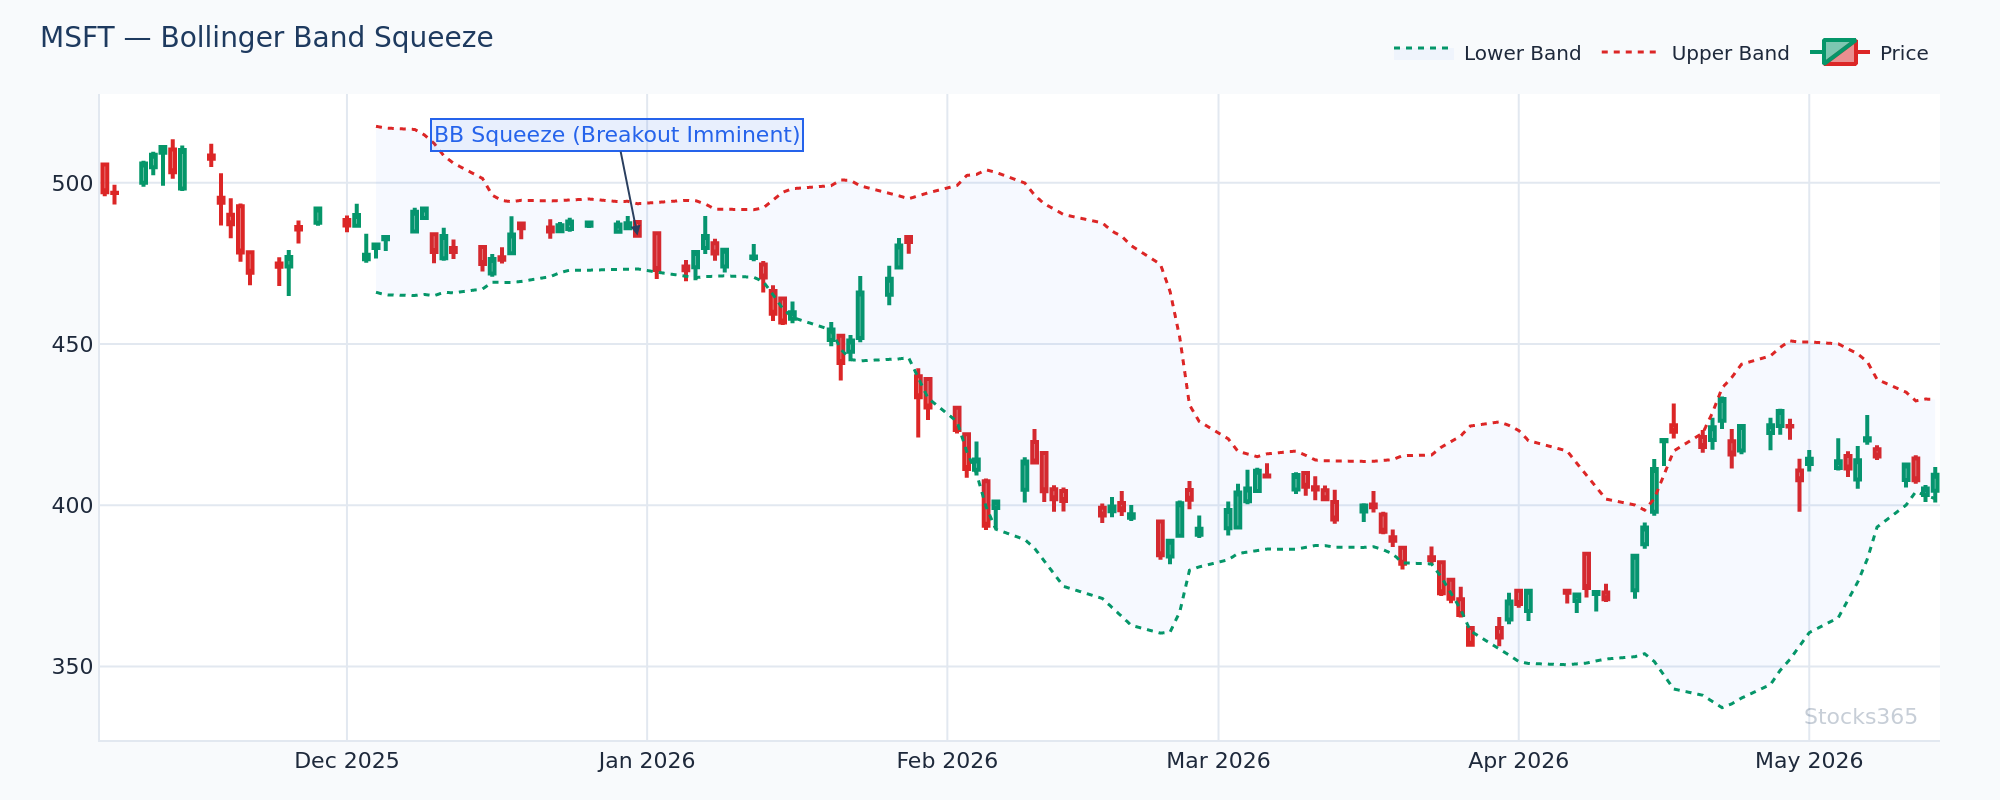
When Bollinger Bands squeeze tight around the 20-SMA — band width compressing to the lowest levels in weeks — a volatility expansion is building. The 20-SMA acts as the anchor for this compression. The direction of the breakout from the squeeze, confirmed by a close above or below the bands with volume, defines the next significant move. A breakout that immediately reverses back inside the bands within two sessions signals a failed expansion and often precedes a move in the opposite direction.
Practical Moving Average Setups That Show Real Edge
The Pullback-to-MA Entry
In a confirmed uptrend (price above rising 50-SMA and 200-SMA), wait for price to pull back to the 20-SMA. Look for: a bullish reversal candle at the MA level, RSI holding above 40, and volume declining during the pullback (sellers exhausting). Entry on the close of the reversal candle, or the open of the following session. This setup respects the trend while providing a structurally logical entry point.
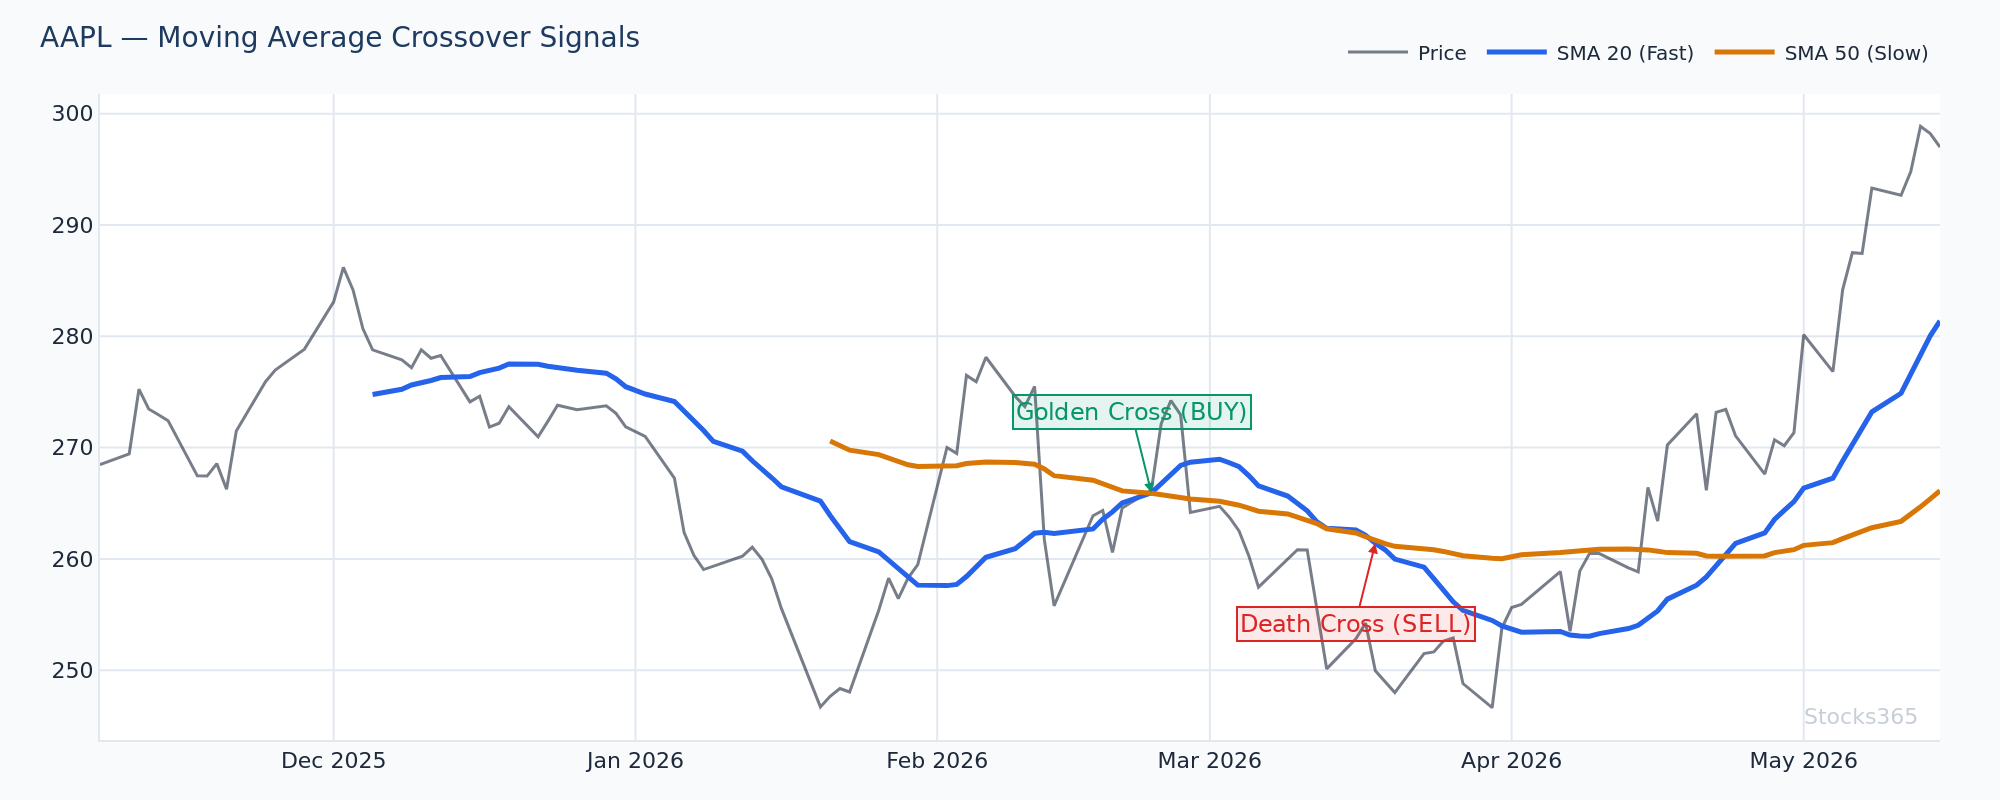
The MA Crossover With Volume Confirmation
When the 20-SMA crosses above the 50-SMA — the classic "golden cross" on short timeframes — the signal only carries weight when volume on the breakout session exceeds the 20-period average volume. Without volume confirmation, the cross is likely to fail. With it, the probability of follow-through increases meaningfully. This is the version of the crossover that actually works.
The Failed Cross Reversal
Price crosses above the 20-SMA, then closes back below within 1–2 sessions. This "failed breakout" pattern is one of the cleanest short setups in technical trading. The trapped longs who bought the cross become forced sellers, which accelerates the move lower. Watch for this especially in weak market regimes and in assets that are already below the 50-SMA and 200-SMA.
For beginners building their first technical framework, the Complete RSI Beginner's Guide and RSI for Beginners: 5 Simple Rules pair naturally with MA-based strategies — RSI provides the momentum context that makes MA signals actionable.
What to Watch For
- 20-SMA slope changes in trending assets: When a rising 20-SMA begins to flatten after a sustained trend, watch for the first close below it on above-average volume — that's often the earliest signal of regime change, not just a pullback opportunity.
- Crypto bearish crosses below the 20-SMA: Our backtested data shows a 66.8% win rate for Price Crosses Below SMA 20 in crypto. When a major crypto asset closes below the 20-SMA with momentum behind it, the 10-day follow-through has historically been the strongest across all asset classes.
- Triple MA compression on daily charts: When the 10, 20, and 50-SMA converge within a narrow range simultaneously, a directional expansion is imminent. The first strong-volume close that separates price from all three MAs in one direction tends to initiate the new trend leg.
- RSI-MA divergence setups: When price makes a new high above the 20-SMA but RSI makes a lower high, the upside cross is weak. This divergence pattern — price structure and momentum disagreeing — is a high-probability warning to avoid chasing the cross long. Check RSI calculation context in our RSI formula explainer.
- Failed crosses in ranging forex pairs: Given the 42.5% win rate for the bearish SMA 20 cross in forex, treat MA crossover signals in major pairs with particular skepticism unless a clear regime break (away from the 200-SMA) is in place. The setup works best when used as a filter, not a trigger, in forex.
📊 Key Takeaways
- Moving averages do work — but as filters and context tools, not as standalone entry triggers
- The bullish SMA 20 crossover shows negative expectancy (48.3% win rate, profit factor 0.88) across 3,289 signals — buying every cross loses money mechanically
- The bearish SMA 20 crossover shows marginal positive expectancy (50.9%, PF 1.06) — strongest in crypto (66.8%), worst in forex (42.5%)
- Asset class selection matters more than MA period optimization
- Volume confirmation transforms a mediocre MA signal into a high-probability setup
- MAs combined with RSI, MACD, or a triple-MA structure produce the cleanest, most consistent edge
- Market regime (trending vs. choppy) is the single biggest determinant of MA strategy performance
⚙️ How Stocks365 Uses Moving Averages
Moving averages aren't a single signal in the Stocks365 trust score system — they're woven through multiple scoring layers. The slope and position of key SMAs contribute to our trend regime classification, which determines whether momentum-based signals get amplified or dampened in the overall score. A bullish RSI signal in an asset trading below a declining 200-SMA carries less weight than the same signal in an asset above a rising 200-SMA. That regime filter alone filters out a significant percentage of low-quality setups before they reach the alert stage.
MA crossover dynamics also feed into our agreement scoring — one of 12+ indicators evaluated per signal. When price, MA slope, volume, and RSI all agree directionally, the trust score rises. When they conflict (price above MA but volume declining, RSI diverging), the score reflects that uncertainty. You can see this in action on the Stocks365 signals dashboard, where each signal displays its full indicator breakdown and composite trust score. Individual stock signals, like the AAPL signal page, show exactly how MA-based inputs contribute to the current reading.