
Double Bollinger Bands Strategy: The Advanced Approach
Most traders know Bollinger Bands. Few use them correctly. Even fewer layer two sets of bands together into a coherent system that actually generates edge. The double Bollinger Bands strategy — DBB — is one of the most powerful momentum and trend frameworks available to retail traders, but only when applied with precision.
This isn't beginner content. This is the advanced approach.
What Is the Double Bollinger Bands Strategy?
The double Bollinger Bands strategy places two sets of Bollinger Bands on the same chart, both using the same 20-period simple moving average as the midline, but with different standard deviation multipliers. The first set uses the standard 2.0 standard deviations. The second set uses 1.0 standard deviation. This creates four bands total — two outer bands and two inner bands — plus the central 20-SMA.
The result is a series of three distinct zones on either side of the midline:
- Buy Zone (Upper): Price between the 1σ and 2σ upper bands — bullish momentum territory
- Sell Zone (Lower): Price between the 1σ and 2σ lower bands — bearish momentum territory
- Neutral Zone: Price between the two 1σ bands — indecision, no high-probability trade
The core logic is clean. When price holds in the upper buy zone, the trend is strong to the upside. When price slips into the lower sell zone and stays there, the trend is strong to the downside. When price hovers in the neutral zone, the smart move is patience — not action.
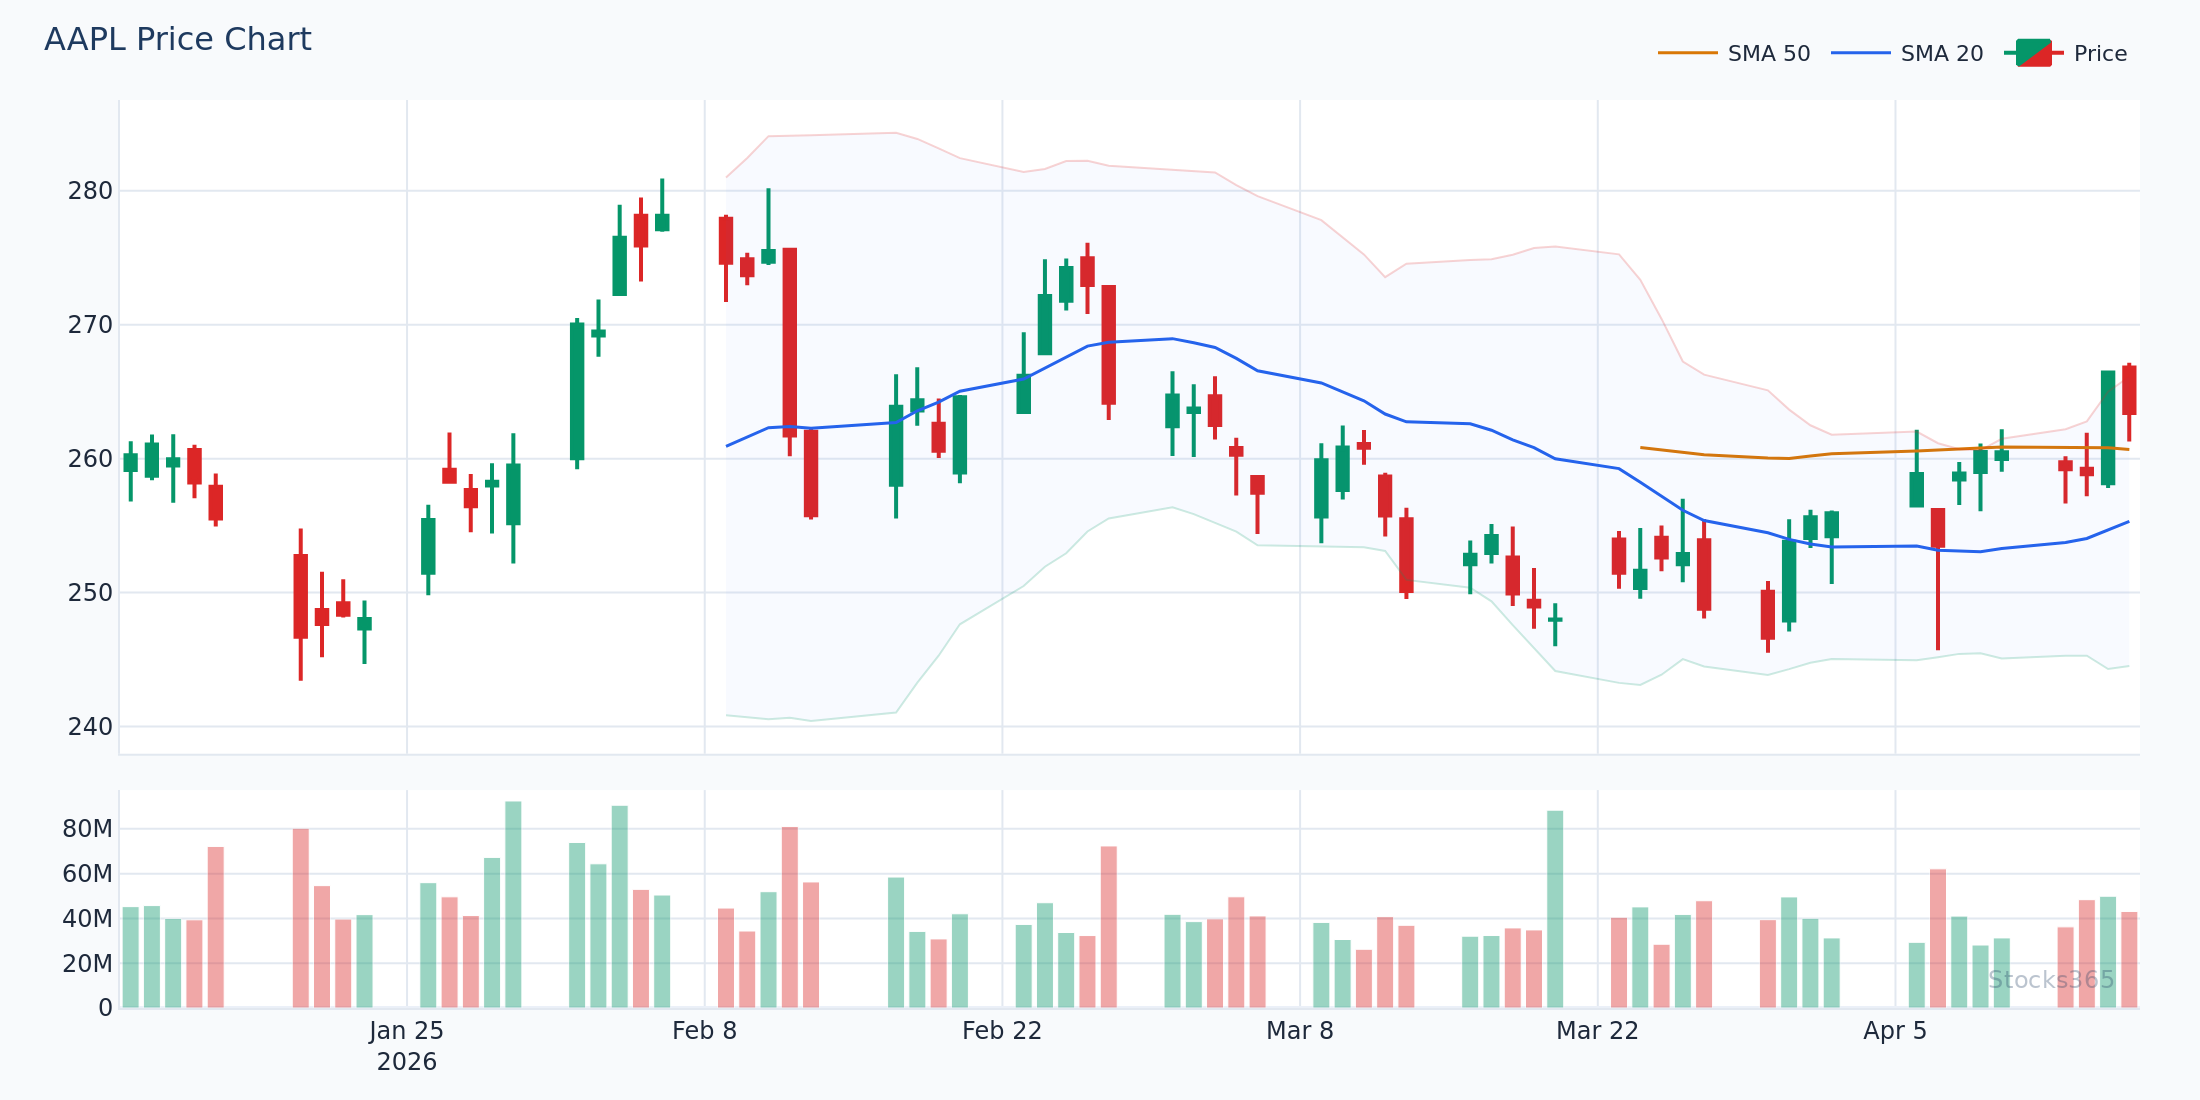
This chart displays the classic DBB configuration across a trending period. Notice how price rides the upper buy zone during strong directional moves — the 20-SMA acts as dynamic support, not resistance. A breach back into the neutral zone signals the trend is stalling. That's the invalidation signal — not a reversal confirmation, but a warning to tighten stops or reduce position size.
How to Set Up Double Bollinger Bands Correctly
The Exact Settings
Get these parameters right. No deviation.
- Band Set 1: 20-period SMA, 2.0 standard deviations (outer bands)
- Band Set 2: 20-period SMA, 1.0 standard deviation (inner bands)
- Source: Close price for both sets
- Timeframe: Works across all timeframes — daily is most reliable for swing traders, 4H for active traders
Both band sets share the same midline. That's critical. The 20-SMA functions as the dividing line between bullish and bearish regimes. Price above it, bias is long. Price below it, bias is short. Simple. Powerful.
Reading the Zones: The Core of the Strategy
Here's where the double Bollinger Bands strategy separates itself from basic band-touch strategies. Instead of reacting to individual band touches, traders read where price lives over multiple candles.
- Three or more candles in the upper buy zone: Strong uptrend — look for long entries on pullbacks to the 1σ upper band
- Three or more candles in the lower sell zone: Strong downtrend — look for short entries on bounces toward the 1σ lower band
- Price crossing from buy zone into neutral zone: Momentum fading — trail stops aggressively
- Price in neutral zone touching opposite 1σ band: Potential trend reversal signal — watch for confirmation
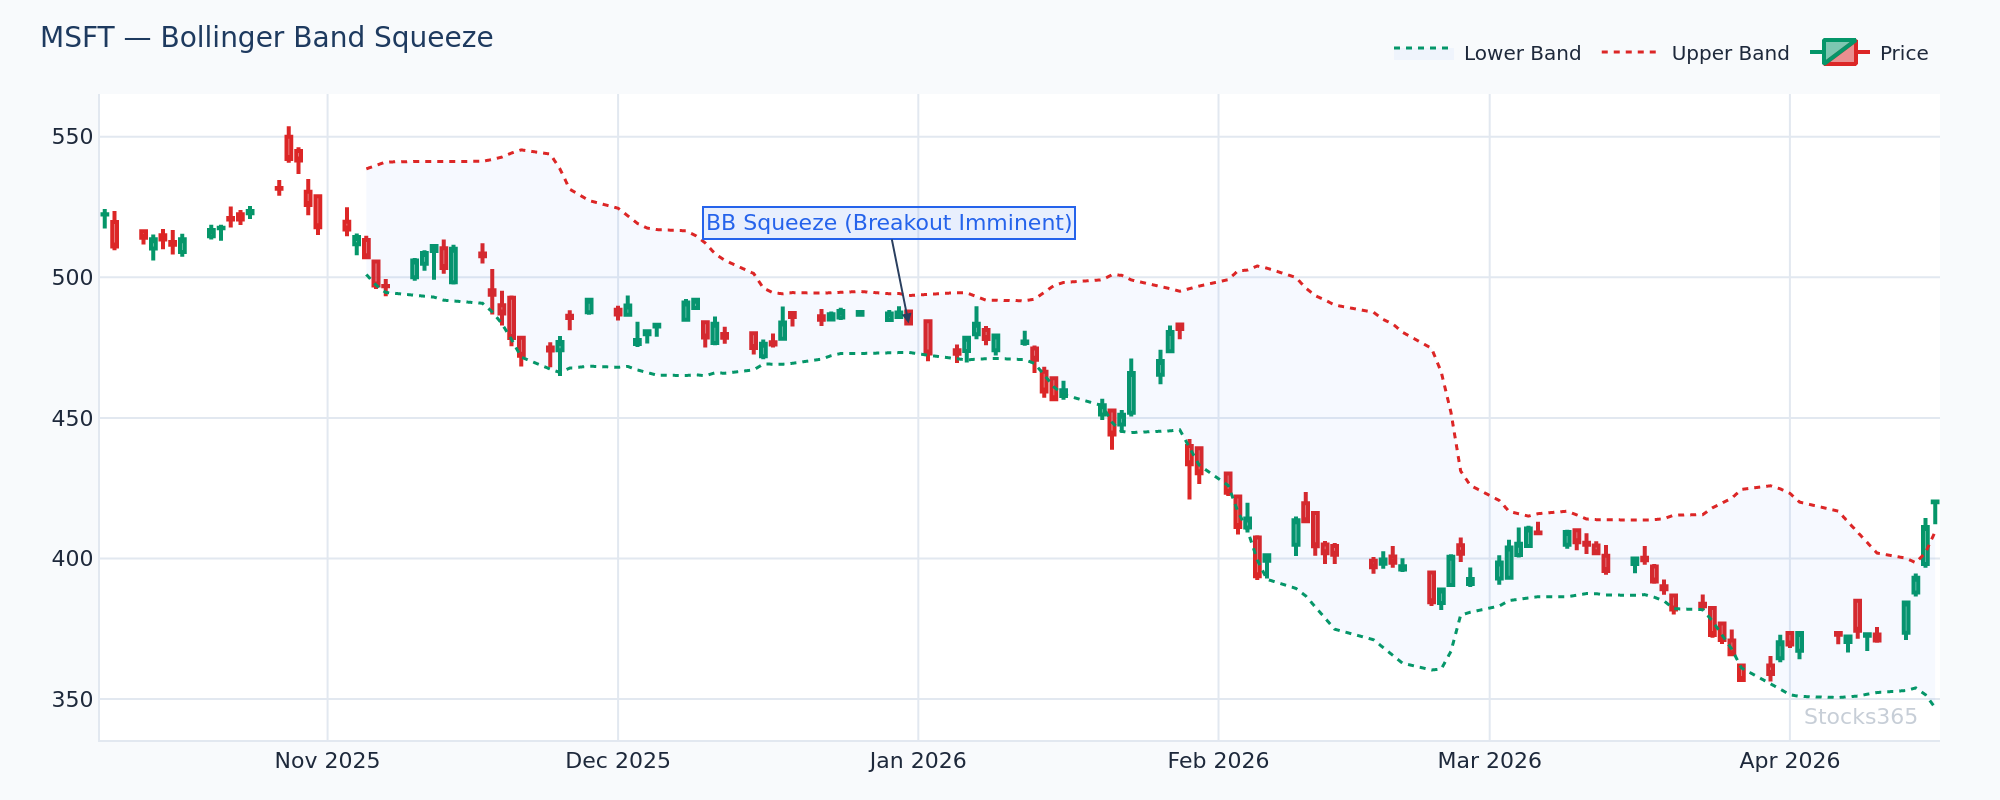
This squeeze setup on MSFT illustrates what precedes the highest-probability DBB trades. When band width compresses dramatically — the outer 2σ bands contracting toward the inner 1σ bands — the next directional move is typically explosive. The direction of the breakout determines which zone price enters first. A clean break into the upper buy zone, held for multiple closes, is the confirmation signal. If price immediately retreats to neutral, the breakout is likely false.
Here's What Most Traders Get Wrong
Most traders treat any band touch as a signal. They see price tag the upper 2σ band and immediately think "overbought, time to sell." In a strong trend, that's consistently wrong. Price can ride the upper band for weeks during powerful momentum moves — touching and re-touching the outer band as the trend accelerates, not reverses.
The edge in the double Bollinger Bands strategy isn't reacting to band touches. The edge is identifying which zone price inhabits and trading in alignment with that zone. A touch of the outer 2σ band while price remains in the upper buy zone is a continuation signal, not a reversal. The reversal signal comes when price drops through the 1σ band and enters neutral territory. Watch for the zone transition — not the band touch.
Double Bollinger Bands Trading Signals: The Four Core Setups
Setup 1: The Zone Entry — Trend Continuation
This is the bread-and-butter DBB trade. Price breaks from neutral into the buy or sell zone, holds for two or more candles, then pulls back slightly toward the 1σ band without re-entering neutral. That pullback is the entry.
Confirmation checklist:
- Price closes in the buy zone (above 1σ upper band) for at least two consecutive candles
- Volume on the initial breakout exceeds the 20-period average
- The 20-SMA is sloping in the direction of the trade
- RSI holds above 50 for long entries (or below 50 for shorts)
For a deeper understanding of RSI confirmation signals alongside Bollinger setups, the ultimate step-by-step guide to using RSI in trading covers the integration in detail.
Setup 2: The Squeeze Breakout
Bollinger squeezes are volatility compressions. When the outer bands narrow significantly — band width drops to its lowest reading in 20+ bars — the market is coiling for a major move. The double band structure makes this even clearer: when all four bands converge toward the 20-SMA, the subsequent expansion is typically large.
Entry logic: Wait for the first candle that closes decisively in either the buy zone or sell zone after the squeeze. Don't anticipate. Let price confirm the direction first.
Setup 3: The Failed Breakout Reversal
Price spikes into the buy zone, triggering long entries, then immediately reverses back through the 1σ band into neutral — or worse, all the way into the sell zone. This failed breakout is itself a high-probability trade in the opposite direction.
The key: the reversal candle needs to be decisive. A long wick back below the 1σ band with a close in neutral signals trapped buyers. A full candle close in the sell zone signals institutional selling into retail long stops.
Setup 4: The Midline Reclaim
During downtrends, price lives in the sell zone. The 20-SMA acts as overhead resistance. When price rallies back toward the 20-SMA from the sell zone, watch for rejection. A bounce off the 20-SMA that sends price back into the sell zone is a short entry — the midline rejection confirms the bear trend intact.
Conversely, when price in a sell zone punches cleanly through the 20-SMA and closes above it, entering neutral territory, the downtrend is breaking down. That's a cover signal for shorts, not a new long entry — wait for confirmation of the upper zone before going long.
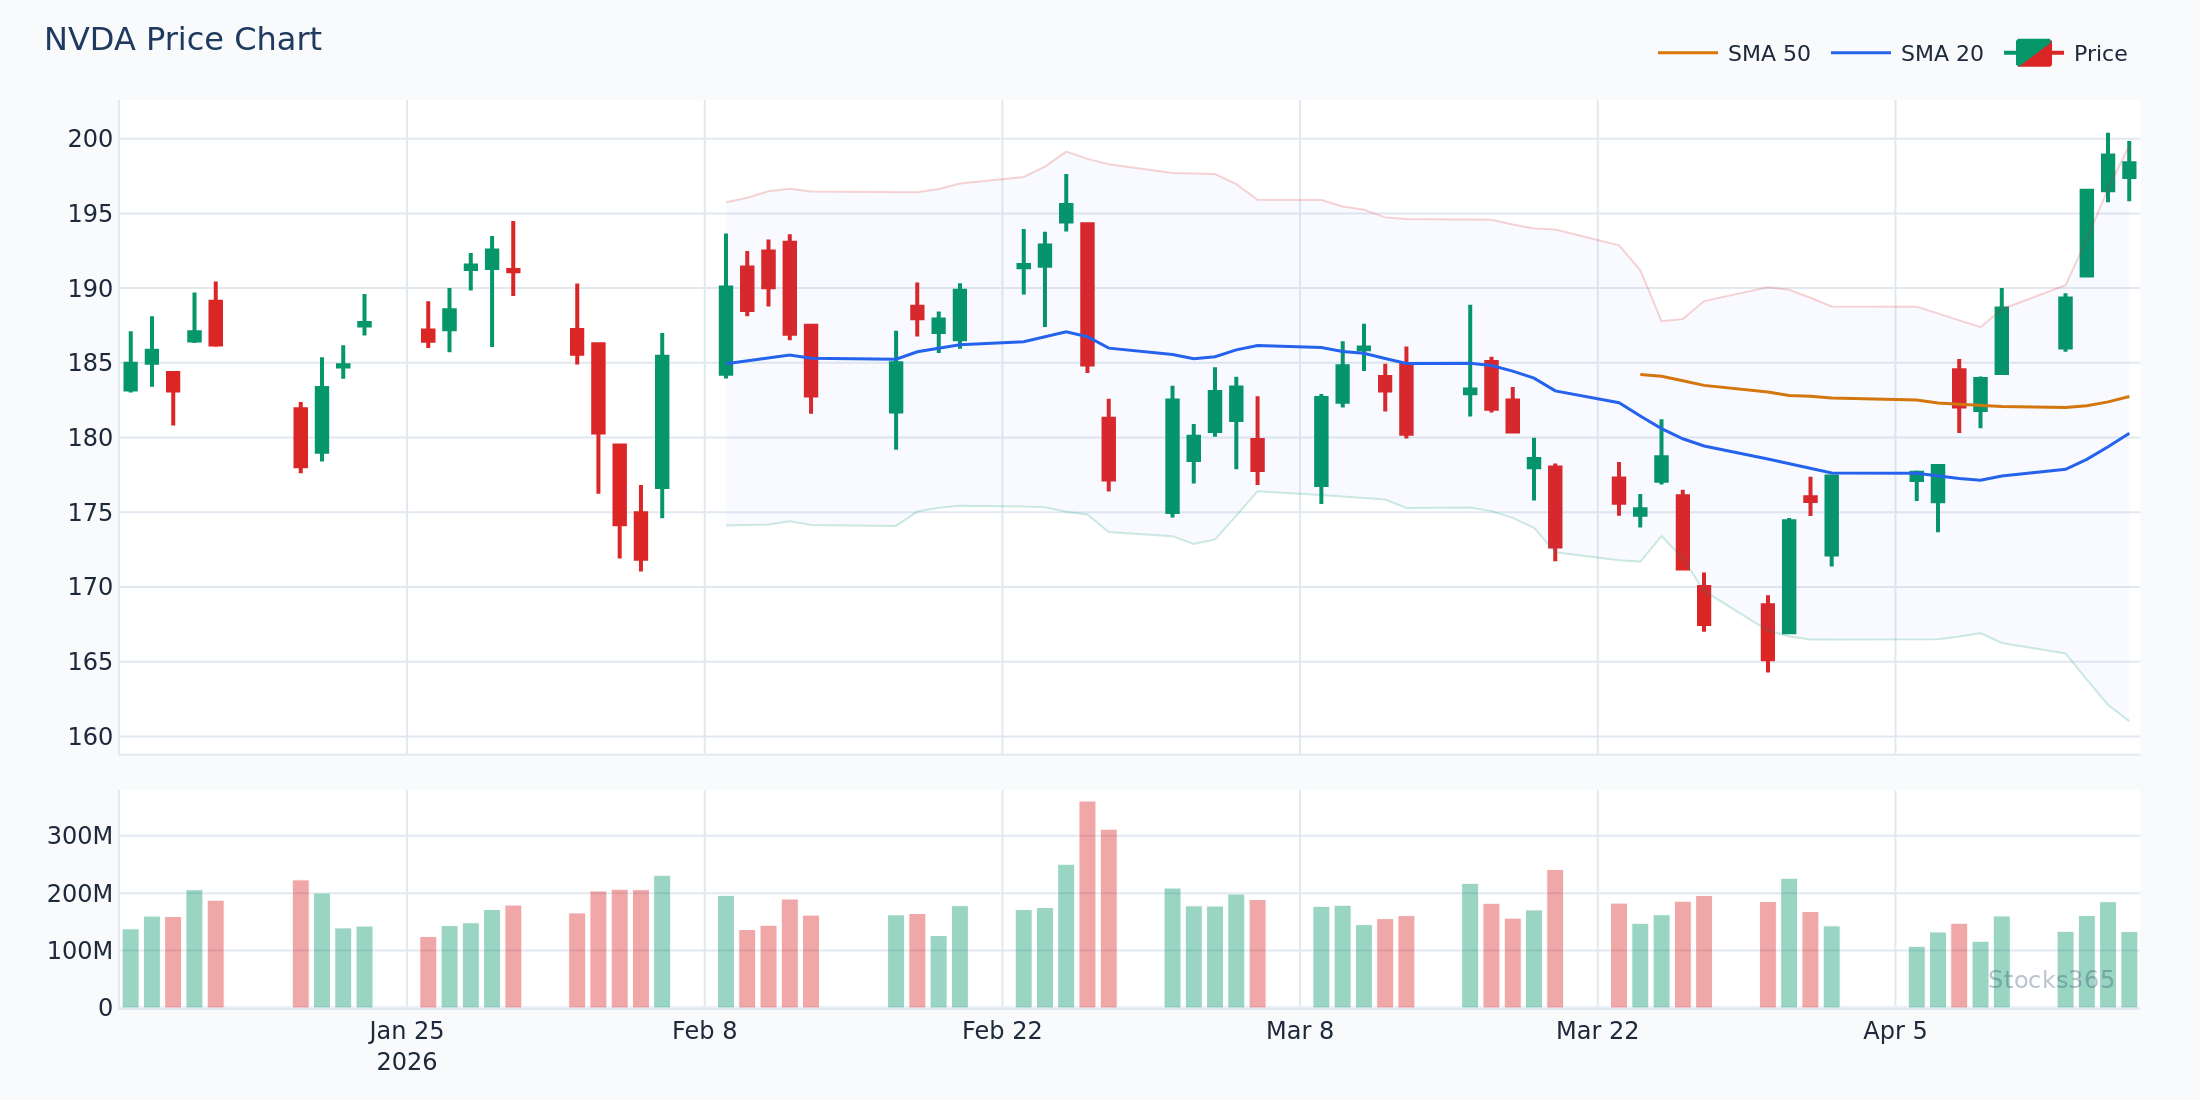
This NVDA example shows the 20-SMA functioning as a magnet during a trending phase. Each rally attempt into the midline from the sell zone creates a lower-risk short entry with a clear invalidation level — a close above the 20-SMA. The pattern repeats until price finally breaks the midline with conviction and volume, signaling the end of the sell zone domination.
Combining Double Bollinger Bands With Other Indicators
RSI Integration
RSI pairs naturally with the DBB strategy. The combination filters low-quality signals and confirms high-quality ones. The framework is straightforward:
- Long signal confirmation: Price enters upper buy zone + RSI above 50 and rising
- Short signal confirmation: Price enters lower sell zone + RSI below 50 and falling
- Divergence warning: Price in buy zone but RSI making lower highs — trend losing momentum, reduce position or stand aside
RSI divergence is particularly valuable here. When price rides the upper buy zone but RSI prints a hidden divergence pattern, the trend often has more runway than most traders expect. That hidden divergence — higher RSI lows during a pullback — is the advanced signal that separates profitable DBB traders from average ones.
For traders choosing between RSI and other oscillators as their secondary filter, the RSI vs Stochastic comparison guide breaks down which works better in trending versus ranging conditions — directly relevant to DBB zone trading.
Volume Confirmation
Volume is the truth serum of the DBB strategy. Zone entries on above-average volume hold. Zone entries on thin volume fail. The rule: if volume on the breakout candle is less than the 20-period average, treat the signal as unconfirmed. Wait for the next candle with conviction before entering.
Timeframe Alignment
Use multiple timeframes with the DBB system. Check the higher timeframe for zone context, execute on the lower timeframe. If the daily chart shows price in the upper buy zone, look for 4H pullbacks to the 1σ band for precise entries. Timeframe alignment dramatically improves the win rate of individual setups.
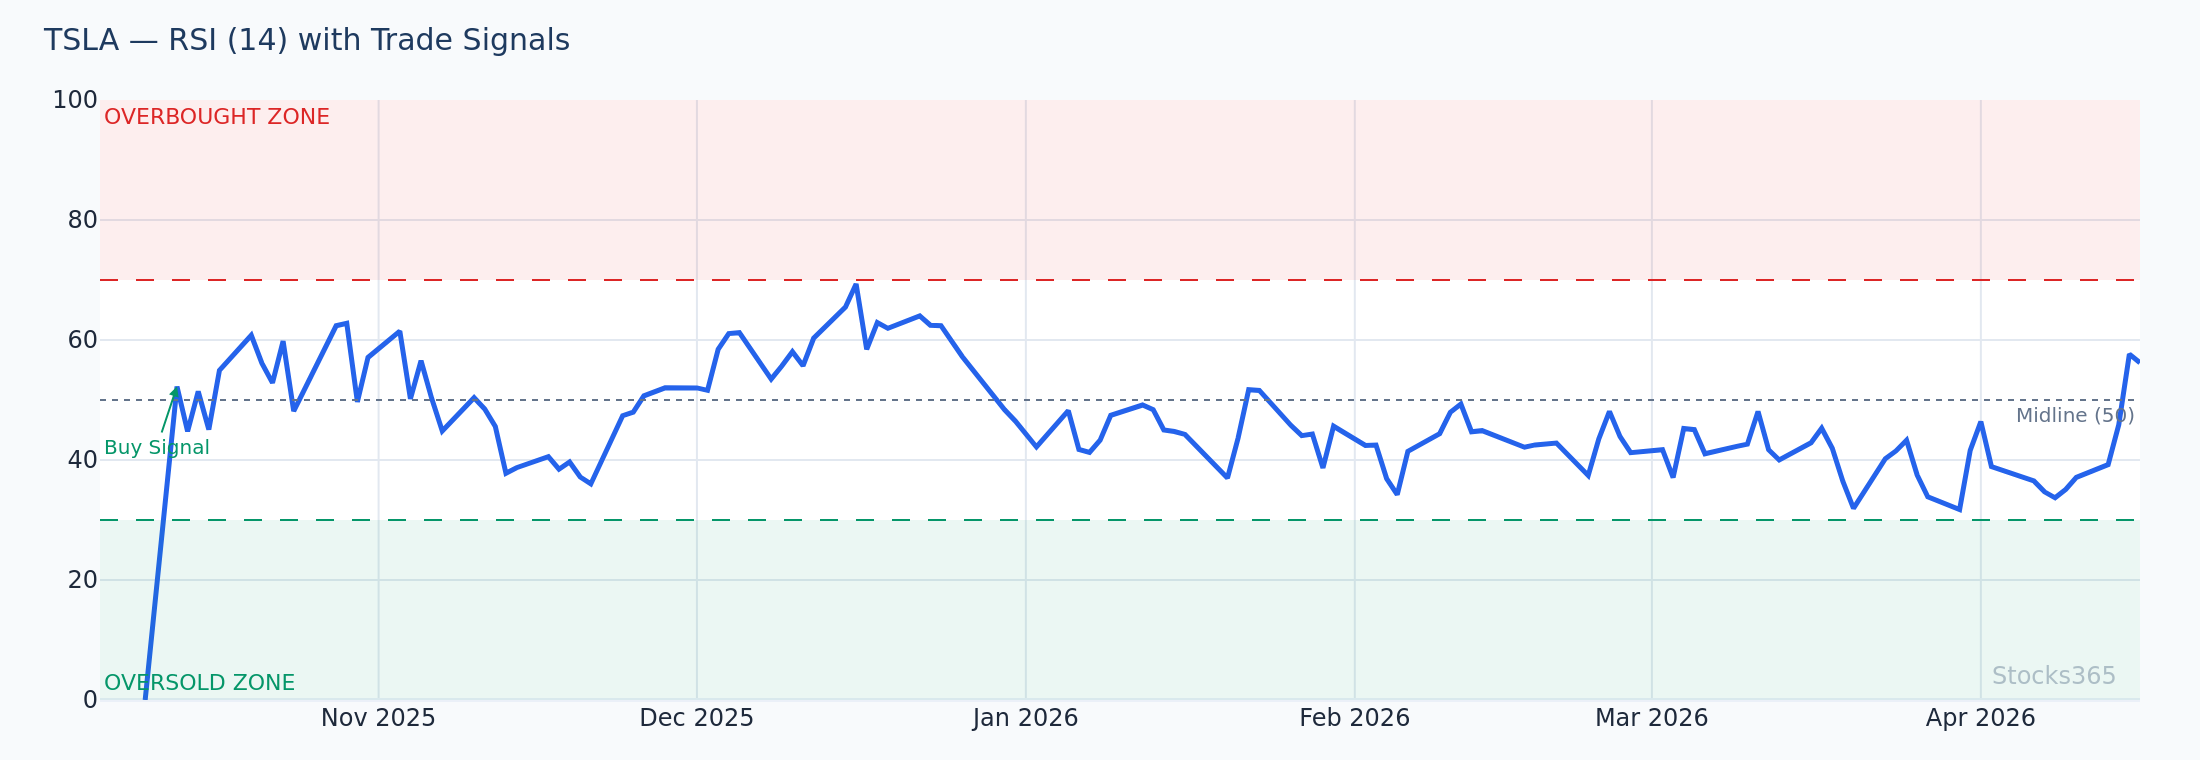
This RSI overlay on a TSLA DBB trade demonstrates the confirmation in action. RSI holds consistently above 55 while price remains in the upper buy zone — a reinforcing signal that momentum is genuine, not exhausted. The warning shot comes when RSI dips below 50 while price is still technically in the buy zone: that divergence often precedes the zone transition by one to three candles, giving prepared traders a head start on the exit.
Risk Management Within the Double Bollinger Bands Framework
The DBB strategy has natural stop placement built into its structure. That's one of its underrated advantages.
- Buy zone trades: Initial stop below the 20-SMA (midline); trail to the 1σ upper band once price extends toward the 2σ band
- Sell zone trades: Initial stop above the 20-SMA; trail to the 1σ lower band as price extends downward
- Squeeze breakout trades: Stop on the opposite side of the squeeze — if breaking up, stop below the pre-squeeze low; if breaking down, stop above the pre-squeeze high
Position sizing matters more than entry precision. A perfectly timed entry with a 5% position will underperform a good entry with a properly sized 2% position that allows you to stay in the trade through normal volatility. Match size to the distance of the stop.
What the Data Shows About Bollinger Band Signals
Our analysis of 14,266 Bollinger squeeze breakout signals across Stocks365's tracked instruments shows a profit factor of 1.03 over a 10-day holding period — with crypto leading at a 51.8% win rate and forex lagging at 47.1%. That modest but consistent edge confirms the squeeze breakout as the most statistically reliable of the Bollinger-based setups. See the full dataset at Stocks365 Insights.
Edge in this strategy comes from setup selection, not volume of trades. Fewer, cleaner setups with proper zone confirmation beat high-frequency band touches every time.
Common Mistakes to Eliminate
Avoid these. They kill the strategy.
- Trading the neutral zone: No edge here. Price in the neutral zone means the market is deciding. Wait.
- Ignoring the trend of the 20-SMA: A rising 20-SMA with price in the buy zone is high-probability long. A rising 20-SMA with price in the sell zone is a complex countertrend situation — trade it only with additional confirmation.
- Using DBB as a standalone system without confirmation: RSI, volume, or timeframe alignment must confirm zone entries. The DBB strategy without filters is a 50/50 proposition.
- Chasing late-stage zone trades: If price has been in the buy zone for 10+ candles and is now touching the 2σ band repeatedly, the optimal entry has passed. Wait for a reset.
Patience is the real edge. Most traders lose it within three to five candles.
What to Watch For
- Bollinger squeeze setups where band width drops to a multi-month low — when all four bands in the DBB setup converge tightly around the 20-SMA, the subsequent expansion often produces moves of 2-4 ATR within 5-10 candles. The direction of the first decisive close determines the trade bias.
- Zone entry trades on tech and crypto after high-volume breakouts — when price breaks into the upper buy zone on volume exceeding 1.5x the 20-period average, the probability of holding the zone for three or more candles is materially higher than low-volume zone breaks.
- Midline rejection setups during established downtrends — when price in the sell zone rallies to test the 20-SMA and is rejected with a bearish engulfing or pin bar candle on above-average volume, the continuation short has a clean invalidation level (a close above the 20-SMA) and strong directional bias.
- DBB zone transitions during earnings-adjacent periods — a zone transition from buy to neutral in the two to five days before an earnings event signals accumulating uncertainty. Reducing exposure before the event and re-entering based on post-event zone placement is a lower-risk approach than holding through binary catalysts.
- RSI divergence inside DBB zones — when price makes a higher high within the buy zone but RSI makes a lower high simultaneously, the trend is losing internal momentum. This divergence inside the zone — rather than at a band extreme — is the bullish and bearish divergence signal that most DBB traders miss entirely.
📊 Key Takeaways: Double Bollinger Bands Strategy
- Two sets of bands, one midline: 20-SMA with 1σ and 2σ bands creates three tradeable zones on each side
- Zone residence beats band touches: Where price lives over multiple candles matters more than any individual band touch
- Upper buy zone = long bias; Lower sell zone = short bias; Neutral zone = no trade
- Squeeze breakouts are the highest-probability setups — confirmed by Stocks365 signal data across 14,000+ signals
- RSI above/below 50 is the primary confirmation filter — combine with volume for highest conviction entries
- Natural stop placement is built in: Buy zone stops go below the 20-SMA; sell zone stops go above it
- Multiple timeframe alignment dramatically improves results — use higher timeframe for zone context, lower timeframe for entry precision
⚡ How Stocks365 Uses This
Stocks365 integrates Bollinger Band analysis directly into its Trust Score system, one of 12+ technical indicators that contribute to each instrument's signal strength rating. Bollinger Band positioning — specifically whether price is in the buy zone, sell zone, or neutral zone — feeds into the volatility and regime scoring components of the Trust Score.
When price enters a buy or sell zone and the Trust Score rises above a threshold, Stocks365 flags the signal for active monitoring on the signals dashboard. Squeeze setups, where band width compression triggers a volatility contraction flag, receive elevated weighting because the subsequent breakout tends to produce the cleanest directional moves.
The system also cross-references Bollinger zone signals with RSI readings, volume profile, and trend regime classification — meaning a high Trust Score DBB signal requires agreement across multiple indicator dimensions, not just a single zone touch. This multi-indicator agreement framework is what separates Stocks365 signals from simple screener alerts. Check individual stock signals like AAPL's current signal to see the Trust Score system in action.