
EMA Ribbon Strategy: How to Trade Trending Markets Like a Pro
Most traders overcomplicate trend trading. They layer on indicators, second-guess every candle, and miss the move entirely. The EMA ribbon strategy cuts through the noise. It gives you a visual, structured way to identify trend strength, time entries, and stay in winning trades longer.
Our analysis of 4,786 trend-plus-momentum signals at Stocks365 shows a 53.1% win rate with a profit factor of 1.35 — meaning that when you combine trend structure with momentum confirmation, the edge is real and measurable. That's not luck. That's the ribbon doing its job.
This guide covers exactly how the EMA ribbon works, how to build entries and exits around it, and how to avoid the mistakes that wipe out beginners before they ever see a clean trend setup.
What Is the EMA Ribbon Strategy?
The EMA ribbon is a collection of multiple Exponential Moving Averages plotted on the same chart — typically ranging from a fast EMA (like the 8-period) to a slow EMA (like the 55 or 200-period). Instead of relying on one moving average, the ribbon shows you the structure of trend momentum across multiple timeframes simultaneously.
Common EMA ribbon configurations include:
- Short-term ribbon: EMA 8, 13, 21, 34 — ideal for intraday and swing entries
- Medium-term ribbon: EMA 21, 34, 55, 89 — best for swing and position trading
- Full Fibonacci ribbon: EMA 8, 13, 21, 34, 55, 89 — the most popular configuration among trend traders
When the EMAs stack in perfect order — fastest on top, slowest on bottom in an uptrend — you have a clean, healthy trend. When they tangle or cross chaotically, the market is in consolidation or transition. The ribbon doesn't just tell you direction. It tells you conviction.
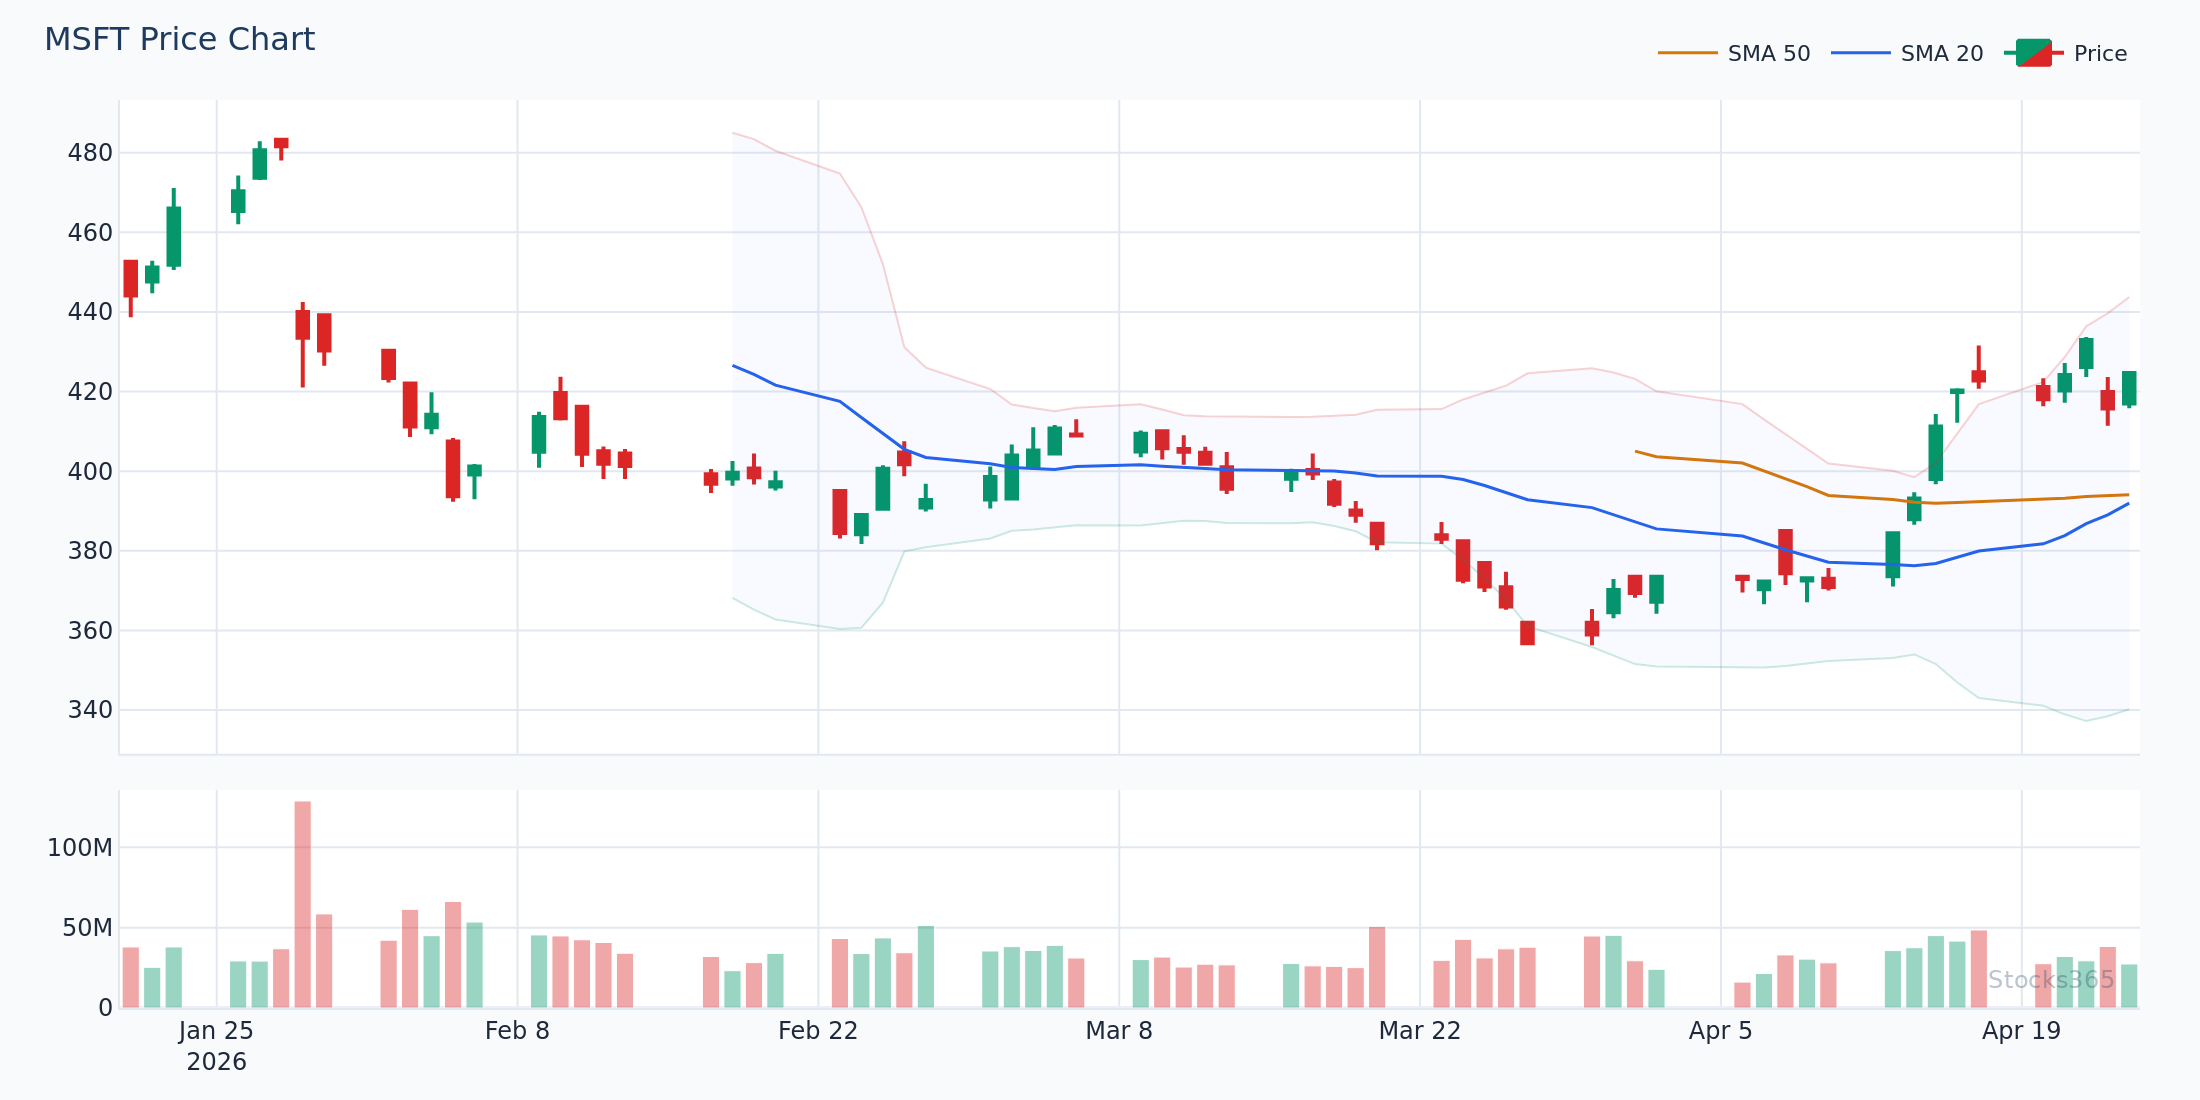
This chart shows a stacked EMA ribbon with clear separation between each line — the hallmark of a strong trending environment. When all EMAs slope upward and price holds above the fastest EMA, that's the zone where trend-following setups carry the highest probability. A close back below the 21 EMA begins to question the structure; a collapse through the 55 EMA often signals the trend is done.
How to Read the EMA Ribbon: Expansion, Compression, and Flip
1. Ribbon Expansion (Strong Trend Signal)
When the EMAs fan out and increase their separation, the trend is accelerating. This is the phase where momentum traders add to positions. Pullbacks to the fastest EMA (8 or 13) often represent the highest-quality re-entry points during expansion phases.
2. Ribbon Compression (Consolidation Warning)
When the EMAs converge and begin to flatten, trend momentum is fading. This is not a trading zone — it's a waiting zone. Fighting a compressed ribbon in either direction is where most losing trades are born.
3. Ribbon Flip (Trend Reversal Signal)
A ribbon flip occurs when the EMAs cross in sequence — fast lines crossing slow lines in the opposite direction. A bearish flip means the 8 crosses below the 21, then the 21 below the 34, and so on. A bullish flip works in reverse. Full ribbon flips are high-conviction reversal signals, especially when confirmed by volume expansion.
The ribbon doesn't predict the future. It describes the present trend structure with more nuance than any single moving average can.
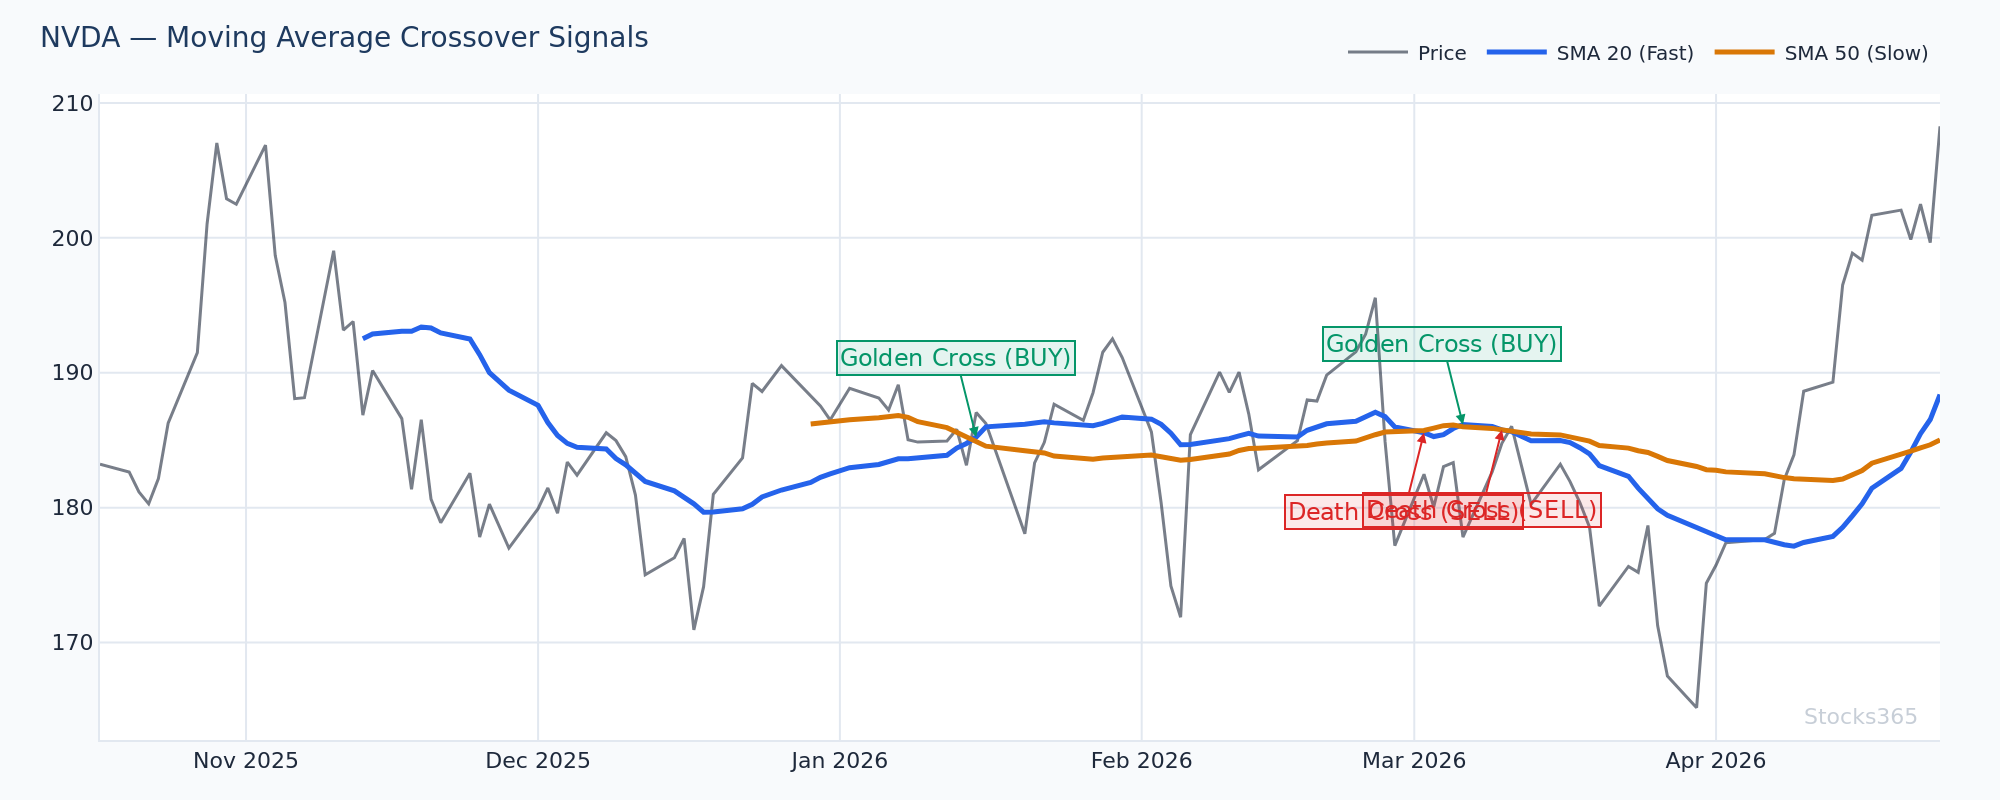
In this setup, the ribbon compresses as momentum stalls — the EMAs converge into a tight band before the next directional move. When the faster EMAs begin to separate again and angle upward, that's the signal the trend is resuming. Confirmation comes when price holds above the 21 EMA on a retest. If price instead slices back through the ribbon without holding, the setup is invalid and the original bias must be reconsidered.
Building an EMA Ribbon Entry Strategy
The Pullback-to-Ribbon Entry
This is the core EMA ribbon trade. During a confirmed uptrend — ribbon fully stacked, EMAs sloping up — price will periodically pull back into the ribbon. That zone of EMA support becomes your entry area.
The setup checklist:
- Ribbon is stacked and expanding (all EMAs slope in trend direction)
- Price pulls back from a swing high into the EMA cluster zone
- A reversal candle forms at or near the fastest EMA (hammer, engulfing, pin bar)
- Volume on the pullback is below average — sellers aren't committed
- Volume on the entry candle is equal to or above average — buyers stepping in
Stop goes below the lowest EMA in the ribbon. Target is the next swing high or a 2:1 risk/reward minimum. Simple. Repeatable.
The Ribbon Breakout Entry
After a period of compression — when all EMAs are tangled together — a breakout above or below the ribbon represents a fresh trend beginning. This setup is most powerful when the breakout candle closes with conviction (not a wick, a full-bodied close) and volume surges above average.
The trigger: price closes above the highest EMA in a compressed ribbon on 1.5x or greater average volume. Enter on the next candle open. Stop below the ribbon. Trail as the ribbon fans out.
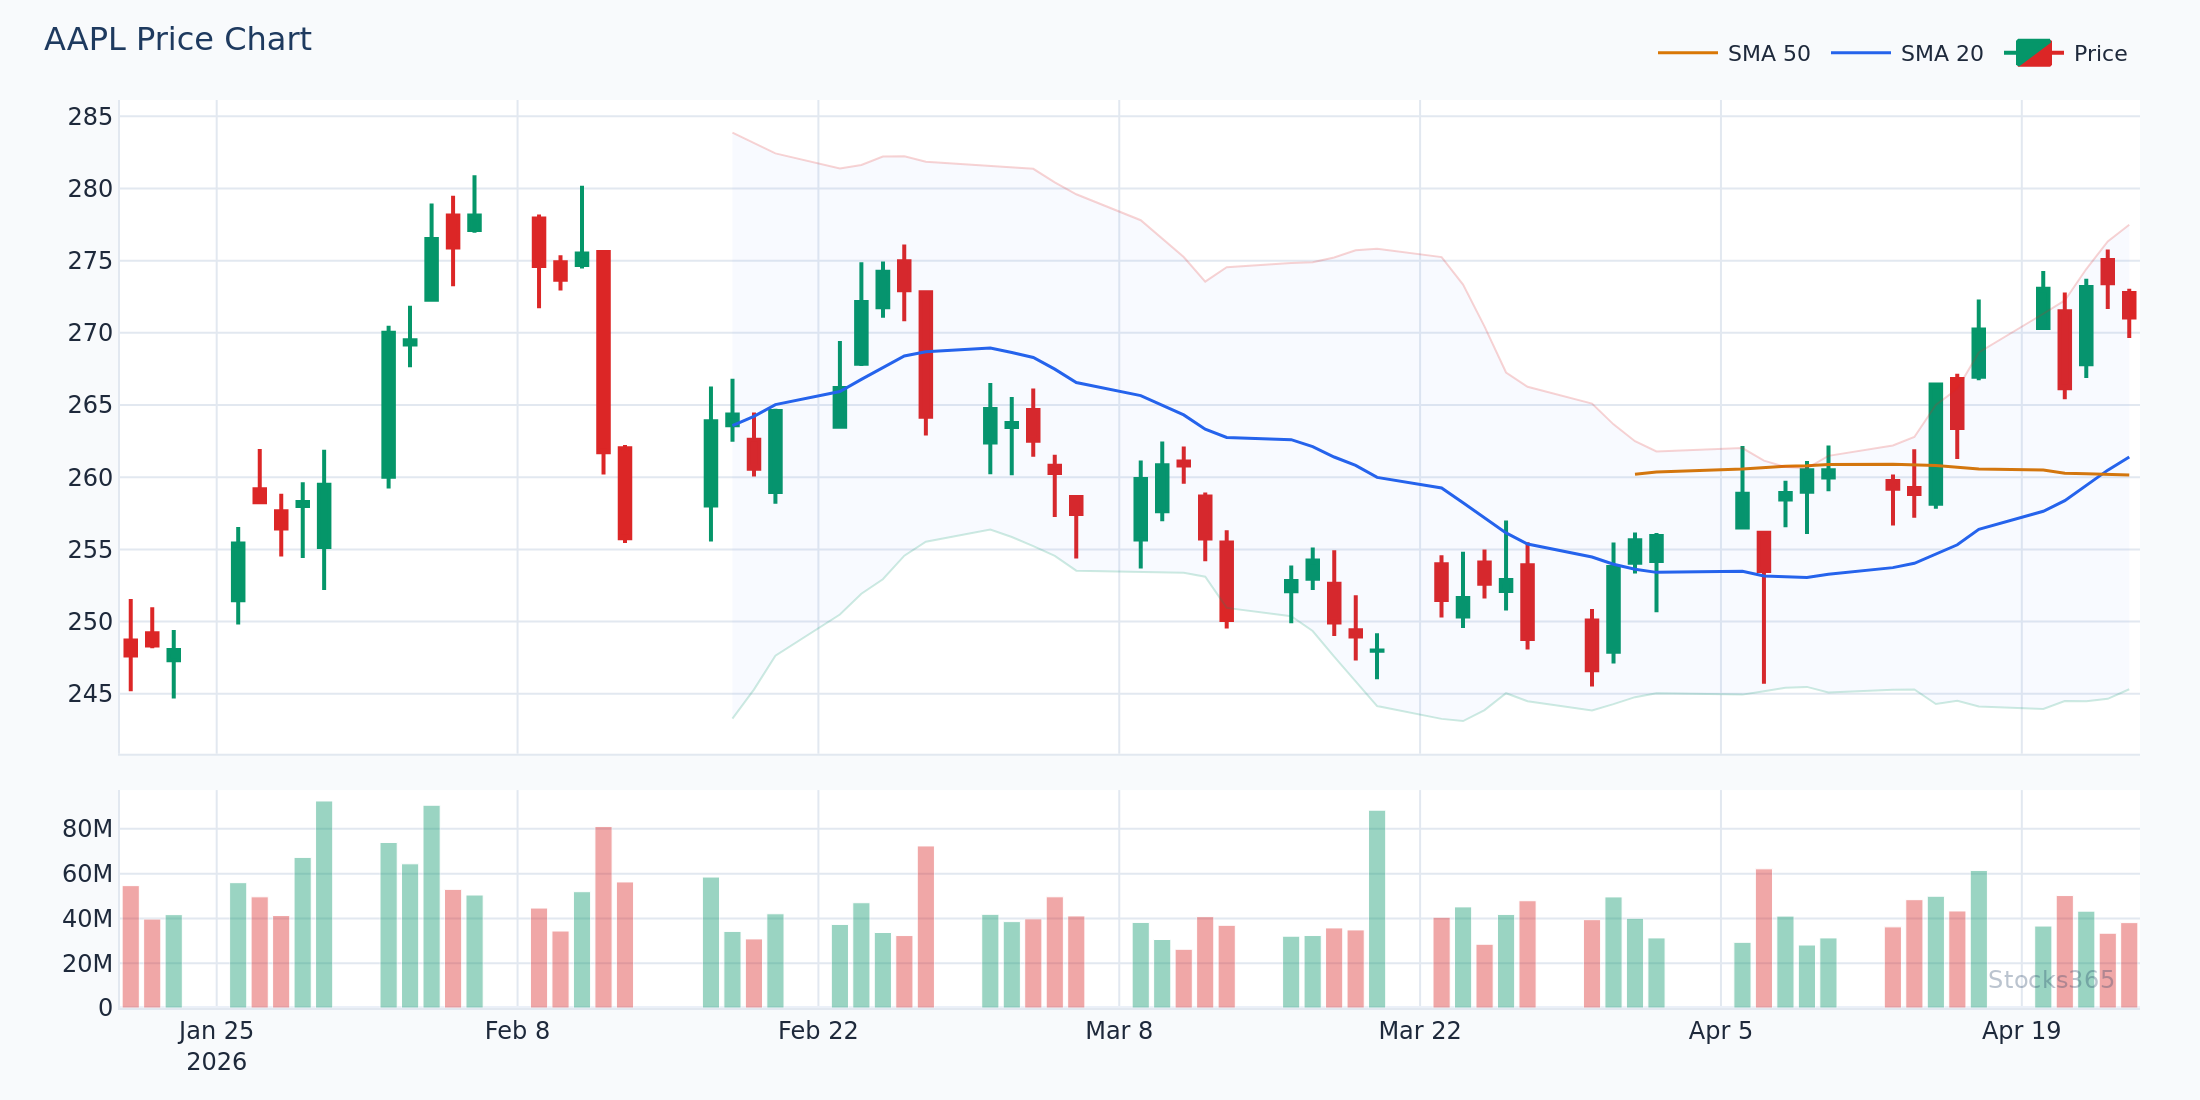
This compression breakout shows how a tight EMA cluster resolves directionally when a catalyst or sufficient buying pressure arrives. The breakout candle's close above all ribbon EMAs signals momentum shift. What confirms the trade is the next candle holding above the ribbon without a full reversal back through — that retest-and-hold is often the cleanest, lowest-risk entry in the sequence.
Here's What Most Traders Get Wrong About the EMA Ribbon
Most traders see a ribbon flip and immediately enter a reversal trade. That's backwards. A ribbon flip signals that a trend change is possible, not confirmed. The EMA ribbon is a lagging construct by design — it describes what has happened, not what will happen next. Entering on the first cross of the 8 EMA over the 13 EMA, without waiting for ribbon structure to build, means buying noise, not trend.
The real edge is waiting for the ribbon to stack. One cross means nothing. A fully ordered ribbon with separation and a pullback-to-ribbon entry is where the statistical edge lives. Impatient traders take every cross. Disciplined traders take the setup — and there's a massive difference in outcomes between those two approaches.
Combining the EMA Ribbon With Momentum Indicators
The ribbon shows trend structure. Momentum indicators show trend energy. Together, they form a layered confirmation system that filters out false signals significantly.
EMA Ribbon + RSI
RSI is the natural companion to the EMA ribbon. In a stacked bull ribbon, RSI should hold above 50 on pullbacks — that's trend-mode behavior. If RSI drops below 40 while the ribbon is still bullish, the trend is losing internal strength even if price hasn't broken down yet. That divergence is a warning.
For a deeper understanding of how RSI works alongside trend tools, read our complete guide on how to use RSI in trading. And if you're seeing price make new highs while RSI fails to follow, that's a divergence signal worth knowing — covered in detail in our article on RSI divergence and what it means for trend traders.
EMA Ribbon + Volume
Volume is the ribbon's truth test. A beautiful stacked ribbon on declining volume is a warning, not an invitation. Healthy trends see volume expand on impulse legs and contract on pullbacks. When a pullback-to-ribbon setup triggers on above-average volume without a reversal candle, that's a ribbon breakdown in progress — skip the trade.
EMA Ribbon + ADX
ADX above 25 confirms the trend is strong enough to trade with the ribbon. ADX below 20 means the market is ranging — the ribbon will chop and give false signals. Stocks365's analysis across 11,597 ADX trend signals found a 49.0% win rate overall, but commodities outperformed at 54.8% while crypto underperformed dramatically at 36.1%. The data makes it clear: trend strategies, including EMA ribbon setups, work best in asset classes with genuine directional persistence. Our research dashboard breaks this down by asset class and timeframe if you want to dig deeper.
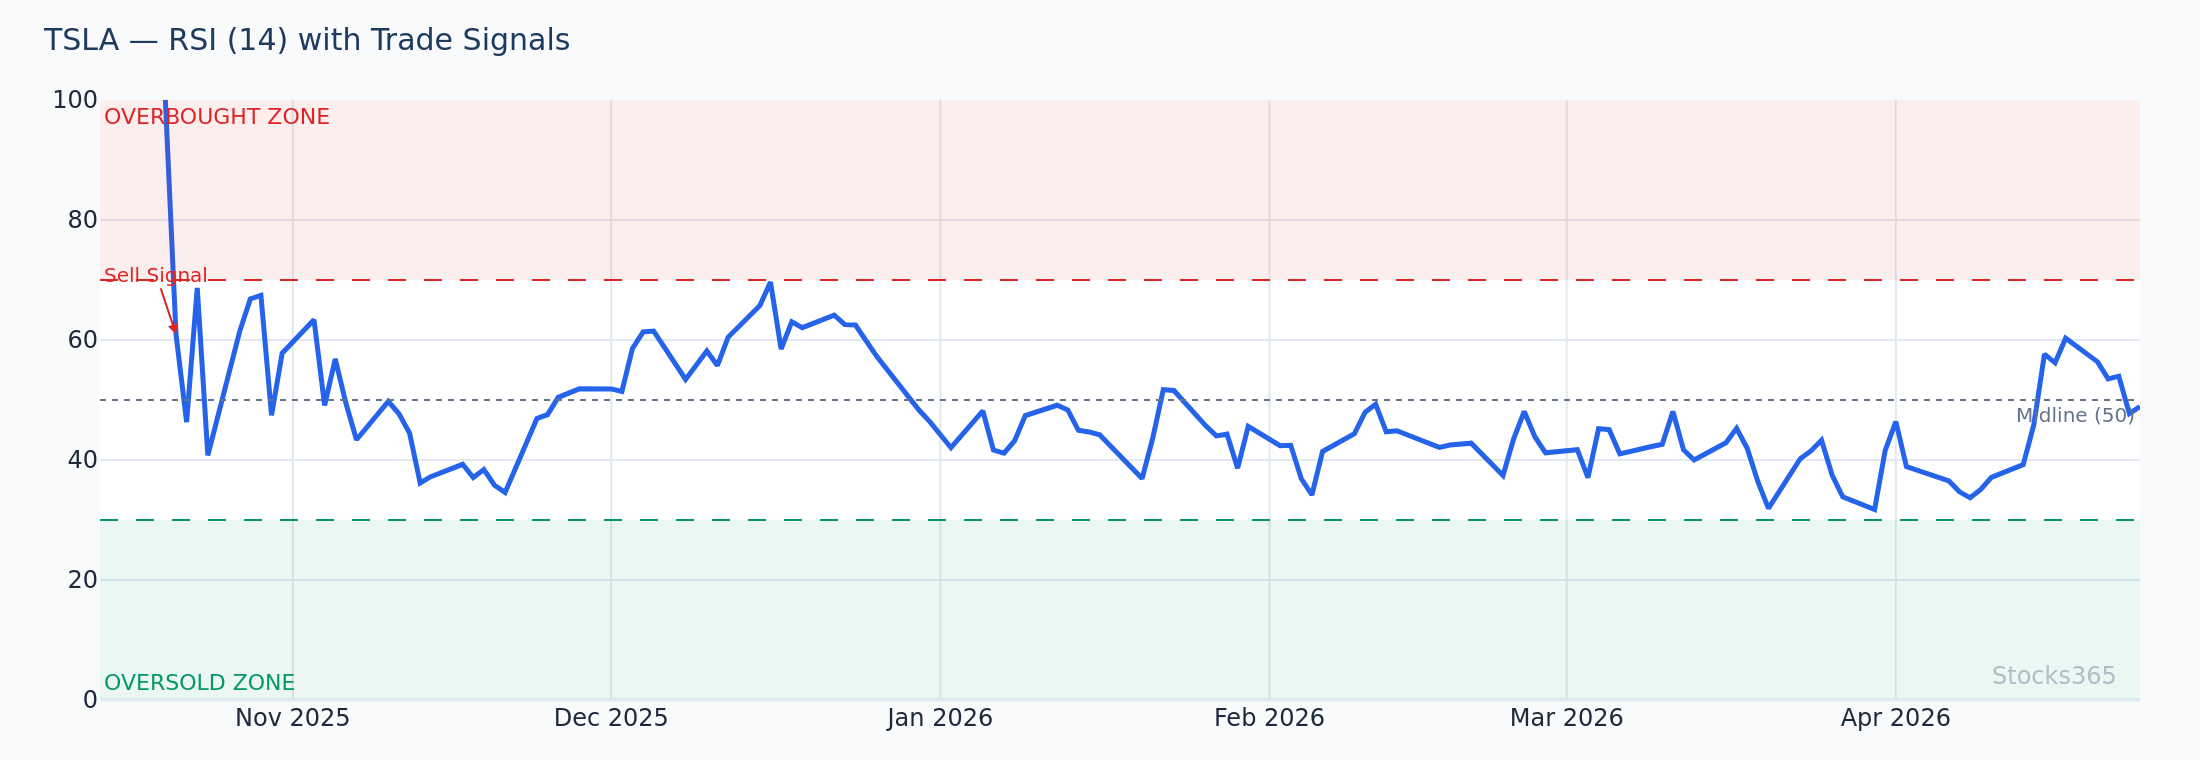
This chart overlays RSI with a stacked EMA ribbon to show momentum health during a pullback phase. When price dips into the ribbon but RSI holds above 50 and begins curling upward, that's the dual confirmation a high-probability entry requires. If RSI instead breaks below 40 on this same pullback, the ribbon's bullish structure is called into question and the trade should be passed. Confirmation from both systems is what separates a setup from a guess.
When the EMA Ribbon Strategy Fails
No strategy works in all conditions. The EMA ribbon fails in ranging, choppy markets — and that's not a flaw, it's a feature. The ribbon literally shows you when not to trade it: when the EMAs are tangled and flat, you stay out.
Specific failure conditions:
- News-driven reversals: Earnings, macro shocks, and geopolitical events can violate ribbon structure in a single candle. The ribbon has no predictive edge in these moments.
- Low-liquidity assets: Thinly traded stocks produce ribbon setups that look perfect but have no follow-through due to lack of genuine buying or selling interest.
- Crypto in low-trend regimes: As the data shows, crypto underperforms trend strategies materially. An EMA ribbon setup on a small-cap crypto in a sideways market is a low-conviction trade at best.
- Overextended trends: A ribbon that has been stacked and expanding for weeks without a meaningful pullback often produces the worst entry timing. The setup quality degrades when price is too far from the ribbon cluster.
The fix for most of these failure modes: add a regime filter. Only trade ribbon setups when ADX is above 25 and the broader index ribbon is also aligned in the same direction. When multiple timeframes and multiple instruments agree, the setup carries real weight.
EMA Ribbon Strategy Across Asset Classes
The EMA ribbon doesn't perform equally across all markets. Stocks365's trend-plus-momentum research across 4,786 signals makes this concrete: commodities delivered a 57.4% win rate, equities fell in the middle of the distribution, and crypto came in at 47.1%. Commodities trend more cleanly because supply/demand cycles persist for months or years. Crypto markets, while volatile, are prone to sudden reversals that chew through lagging indicators like moving averages.
For equity traders, the sweet spot is large-cap stocks in confirmed sector uptrends. When a stock like MSFT or GOOGL is in a stacked ribbon on the weekly while the broader sector ribbon is also bullish, the probability of a successful pullback entry rises meaningfully compared to a stock trending in isolation against its peers.
Want to track which large-cap stocks are currently showing clean ribbon setups? The Stocks365 signals dashboard screens for trend-aligned setups in real time, and individual signal pages like AAPL's signal page show how multiple indicators including trend structure currently align.
Timeframe Selection for EMA Ribbon Trades
The ribbon works on every timeframe, but the most reliable setups come from trading with the higher timeframe trend.
- Weekly ribbon for bias: Is the big-picture trend up or down? Only trade in that direction on lower timeframes.
- Daily ribbon for entry structure: Is the ribbon stacked? Is price in a pullback or continuation setup?
- 4H ribbon for entry timing: Look for the pullback-to-ribbon reversal candle on the 4H when the daily and weekly ribbons align bullish.
Multi-timeframe alignment is the difference between a good-looking setup and a high-probability trade. One timeframe can mislead. Three aligned timeframes rarely do.
Managing Trades Using the EMA Ribbon
Entry is only half the game. The ribbon also tells you when to stay in and when to get out.
Trailing Stops With the Ribbon
In a strong trend, use the fastest ribbon EMA as a dynamic trailing stop. Price closes below the 8 EMA? Still in the trend zone. Price closes below the 21 EMA with a full-bodied candle? Tighten the stop or take partial profits. Price closes below the 55 EMA? The trend structure is compromised — exit or flip bearish.
Partial Profit-Taking
When price extends significantly above the ribbon cluster (measured as a multiple of ATR), take partial profits. Extended price means mean-reversion risk rises. Book some gains, hold a runner, trail with the ribbon. This approach captures the bulk of trend moves without giving back profits on the inevitable pullback.
For additional momentum-based exit tools, RSI overbought signals are a natural complement — when price is extended above the ribbon AND RSI enters overbought territory, that dual signal has historically preceded the most meaningful pullbacks in trending markets.
What to Watch For
- Ribbon breakout after multi-week compression on large-cap equities: When the daily EMA ribbon compresses to its tightest band width in 30+ sessions and then price closes above all ribbon lines on above-average volume, the subsequent expansion move typically runs 2–4 ATR before the first meaningful pullback.
- Pullback-to-ribbon setups in trending commodity markets: During confirmed commodity uptrends (ADX above 25, weekly ribbon stacked), pullbacks that reach the 21 EMA and form a reversal candle have historically produced the cleanest ribbon continuation trades — the best-performing asset class for this setup by a significant margin.
- Ribbon compression ahead of scheduled macro events: When a stock's EMA ribbon compresses in the 3–5 sessions before a major catalyst, the post-event ribbon breakout often carries stronger follow-through than normal breakouts because compressed energy releases directionally.
- Multi-timeframe ribbon alignment setups: Watch for setups where the weekly, daily, and 4H ribbon all stack bullish simultaneously — these alignment windows are relatively rare but carry the highest conviction, particularly in large-cap tech and industrial names.
- Ribbon flip confirmation with hidden RSI divergence: When the EMA ribbon begins a bearish flip AND hidden bearish RSI divergence is present on the same timeframe, the reversal tends to be more sustained than a ribbon flip without momentum confirmation.
How Stocks365 Uses the EMA Ribbon
The EMA ribbon is one of 12+ indicators built into the Stocks365 Trust Score system. Specifically, ribbon structure contributes to the regime scoring component — which evaluates whether a given asset is in a trending, ranging, or transitional market state. A fully stacked, expanding ribbon increases the regime score, signaling trend-mode conditions where momentum and breakout signals carry higher reliability. A compressed or tangled ribbon suppresses the regime score, flagging the asset as being in a low-conviction environment where many signal types should be filtered out.
This regime-aware approach is why Stocks365 doesn't just surface raw buy/sell signals — it surfaces signals in context. A pullback-to-ribbon entry in a high-regime-score environment is treated differently than the same price pattern in a low-score, choppy environment. The ribbon is the backbone of that distinction. You can see which assets currently carry high regime scores on the Stocks365 signals dashboard.
Key Takeaways
- The EMA ribbon uses multiple EMAs to show trend structure, momentum, and conviction simultaneously — more nuanced than any single moving average.
- The two core setups are the pullback-to-ribbon entry (in established trends) and the ribbon breakout entry (after compression phases).
- Stocks365's trend-plus-momentum research across 4,786 signals shows a 53.1% win rate with a 1.35 profit factor — commodities lead at 57.4%, crypto lags at 47.1%.
- Combine the ribbon with RSI and volume for confirmation. The ribbon shows structure; momentum indicators show energy.
- Only trade ribbon setups when ADX confirms the trend is active (above 25). In ranging markets, the ribbon will produce false signals consistently.
- Use the ribbon for trade management: trail stops with the fastest EMA, exit on closes below the 55 EMA with conviction.
- Multi-timeframe alignment — weekly, daily, and 4H ribbon all stacked in the same direction — produces the highest-quality setups.