
MACD Divergence vs Price Action: Understanding the Core Debate
Every serious trader eventually faces the same crossroads: should you trust what the MACD divergence is telling you, or should you follow raw price action signals? This isn't a trivial question. Get it wrong, and you'll be entering trades too early, too late, or in entirely the wrong direction. Get it right, and you'll have a meaningful edge in almost every market condition.
In 2026, with algorithmic trading accounting for an estimated 70–75% of daily volume on major U.S. exchanges, understanding the relationship between MACD divergence vs price action has never been more critical. Algos exploit lagging indicators constantly — which means traders who understand when MACD divergence leads price and when price action is the more reliable guide can position themselves ahead of the crowd.
This guide breaks down both approaches in detail, compares their strengths and weaknesses with real chart examples, and gives you a practical framework for combining them into a high-conviction trading strategy.
What Is MACD Divergence? A Quick Refresher
The Moving Average Convergence Divergence (MACD) indicator, developed by Gerald Appel in the late 1970s, measures the relationship between two exponential moving averages — typically the 12-period EMA and the 26-period EMA — and plots a signal line (9-period EMA of the MACD line) alongside a histogram.
MACD divergence occurs when the price chart and the MACD indicator move in opposite directions:
- Bullish MACD Divergence: Price makes a lower low, but MACD makes a higher low — suggesting weakening bearish momentum and a potential reversal upward.
- Bearish MACD Divergence: Price makes a higher high, but MACD makes a lower high — suggesting weakening bullish momentum and a potential reversal downward.
- Hidden Bullish Divergence: Price makes a higher low while MACD makes a lower low — a continuation signal in an uptrend.
- Hidden Bearish Divergence: Price makes a lower high while MACD makes a higher high — a continuation signal in a downtrend.
The key appeal of divergence signals is their anticipatory nature. They often form before price actually reverses, giving traders a potential heads-up. But that anticipatory quality is also their greatest risk — divergence can persist for many candles before price responds, or it can simply fail altogether.
What Is Price Action Trading?
Price action trading is the practice of making all trading decisions based purely on the movement of price itself — no lagging indicators, no oscillators, no moving averages (or minimal use of them as dynamic support/resistance levels only). Price action traders read candlestick patterns, chart formations, support and resistance levels, trend structure, and volume to make their decisions.
Core price action concepts include:
- Higher highs and higher lows (uptrend structure) vs. lower highs and lower lows (downtrend structure)
- Break of structure (BOS) — when price violates a key swing high or low, signaling a potential trend change
- Candlestick patterns — pin bars, engulfing candles, doji, inside bars at key levels
- Support and resistance zones — areas where price has previously reversed or consolidated
- Liquidity grabs — sharp moves that sweep stop-loss clusters before reversing (increasingly relevant in algo-driven markets)
Price action is, by definition, real-time. Price is not a derivative of anything — it is the market. This gives it a fundamental advantage: you're reading the primary data, not a mathematical transformation of it.
MACD Divergence vs Price Action: The Core Differences
Speed of Signal
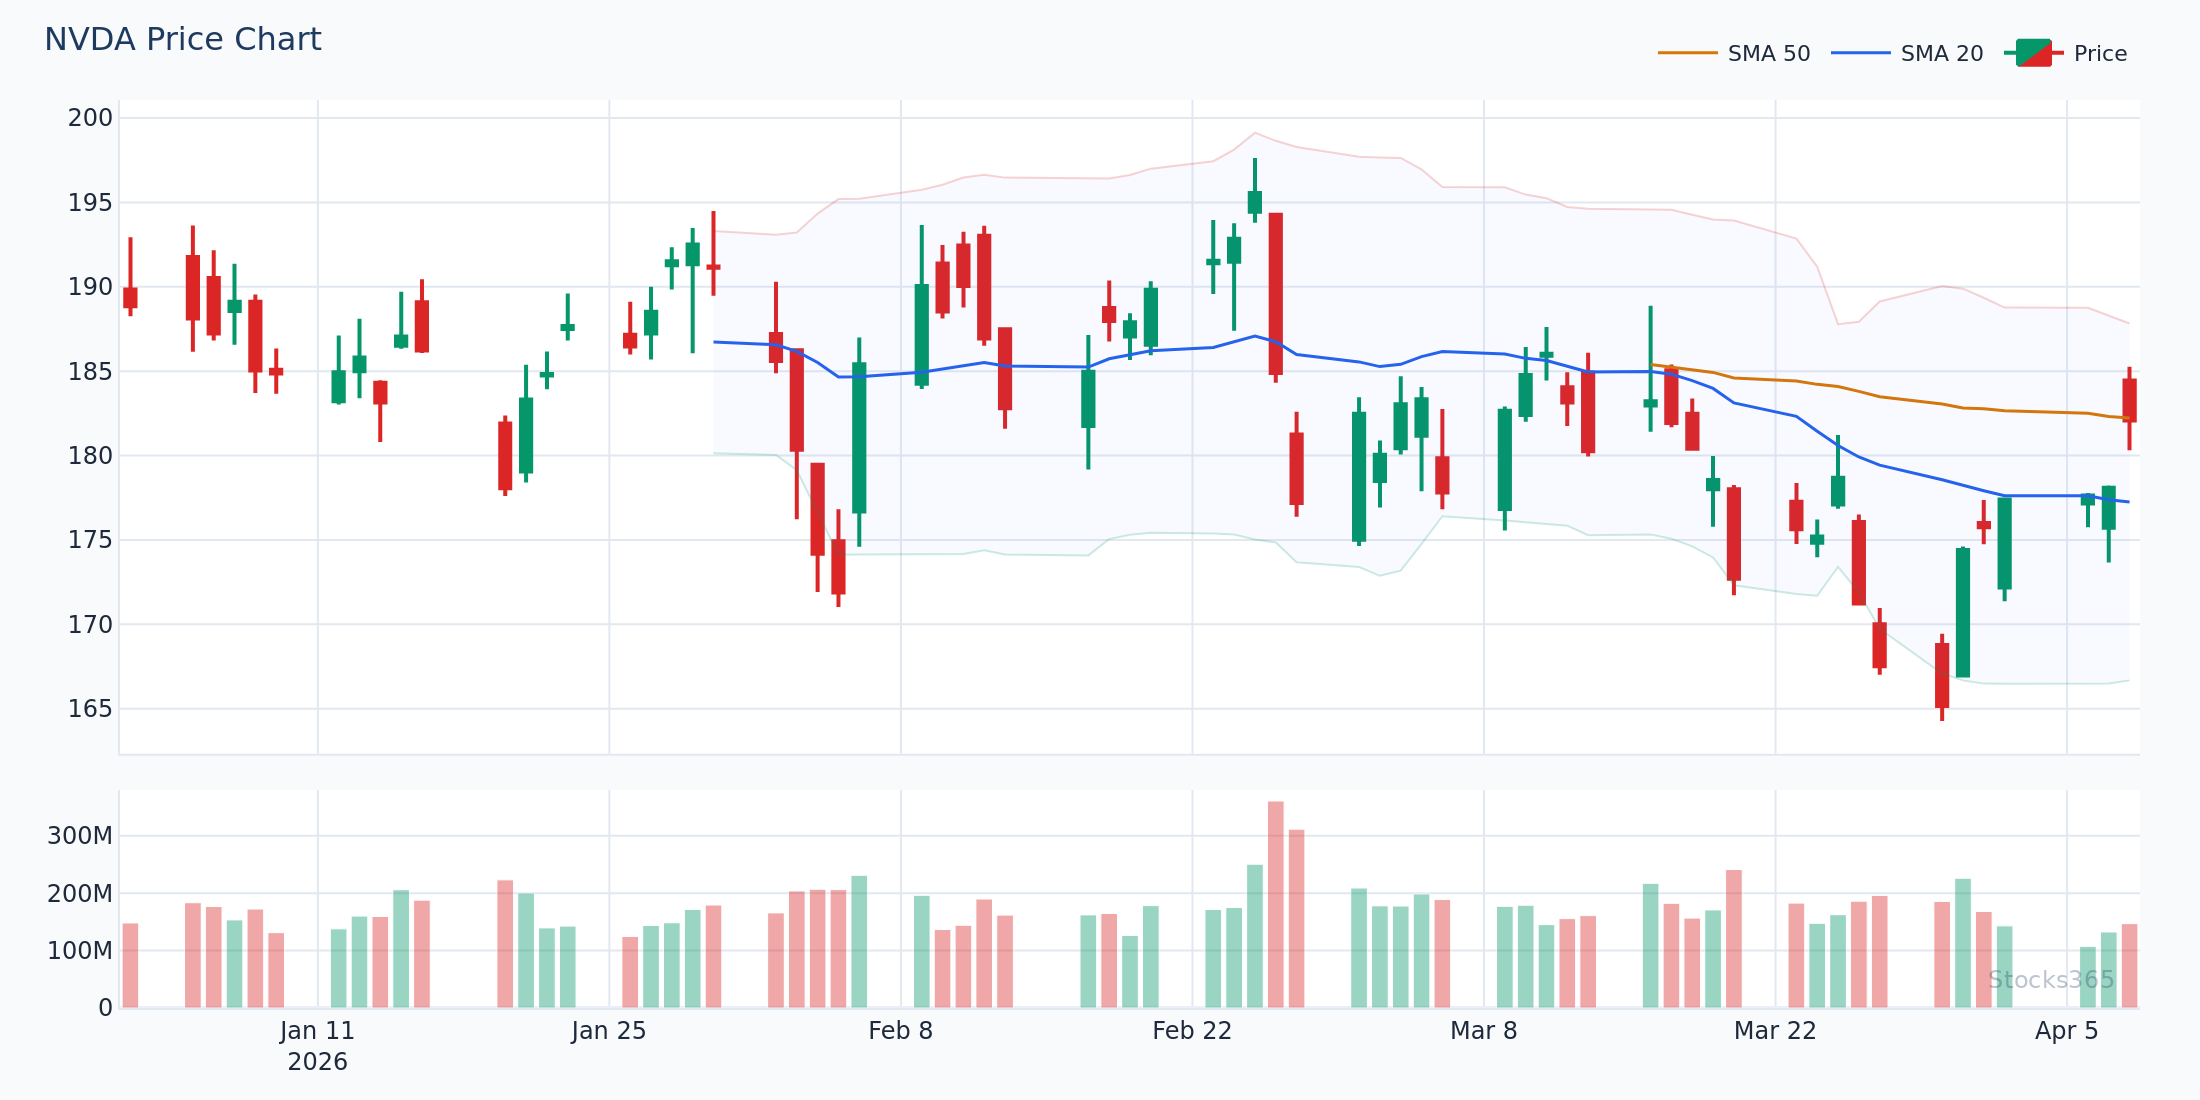
Price action signals are immediate. The moment a pin bar closes at support or a break of structure occurs, you have a signal. MACD divergence, by contrast, requires you to identify at least two swing points on both the price chart and the MACD — which means you're always looking at historical data relative to current price. In fast-moving markets — think NVDA during an earnings gap or a macro shock event — price action will always give you the earlier, cleaner signal.
Reliability in Trending vs. Ranging Markets
This is where most traders get into trouble. MACD divergence performs best in ranging or transitioning markets, where momentum shifts are meaningful. In a strong, sustained trend — like the AI infrastructure rally that dominated large-cap tech in early 2026 — bearish MACD divergence can form repeatedly without price ever reversing significantly. Traders who acted on every bearish divergence in a strong uptrend got chopped apart.
Price action, on the other hand, adapts naturally to both trending and ranging environments. A trending price action trader simply waits for pullbacks to structure and enters in the direction of the trend — no divergence hunting required.
Key Insight: MACD divergence signals against the trend have a significantly lower win rate than divergence signals that align with higher-timeframe price action structure. Always check the bigger picture first.
Subjectivity vs. Objectivity
Both methods have subjective elements, but in different ways. MACD divergence requires you to identify valid swing highs and lows on the indicator — and traders often disagree on what constitutes a valid divergence. Price action requires interpretation of patterns and context, which also varies by trader. However, price action's subjectivity tends to be more intuitive and less prone to over-fitting: a well-defined support level is a support level regardless of what any indicator says.
When MACD Divergence Leads Price: Real-World Scenarios
Scenario 1: Topping Formation After Extended Rally
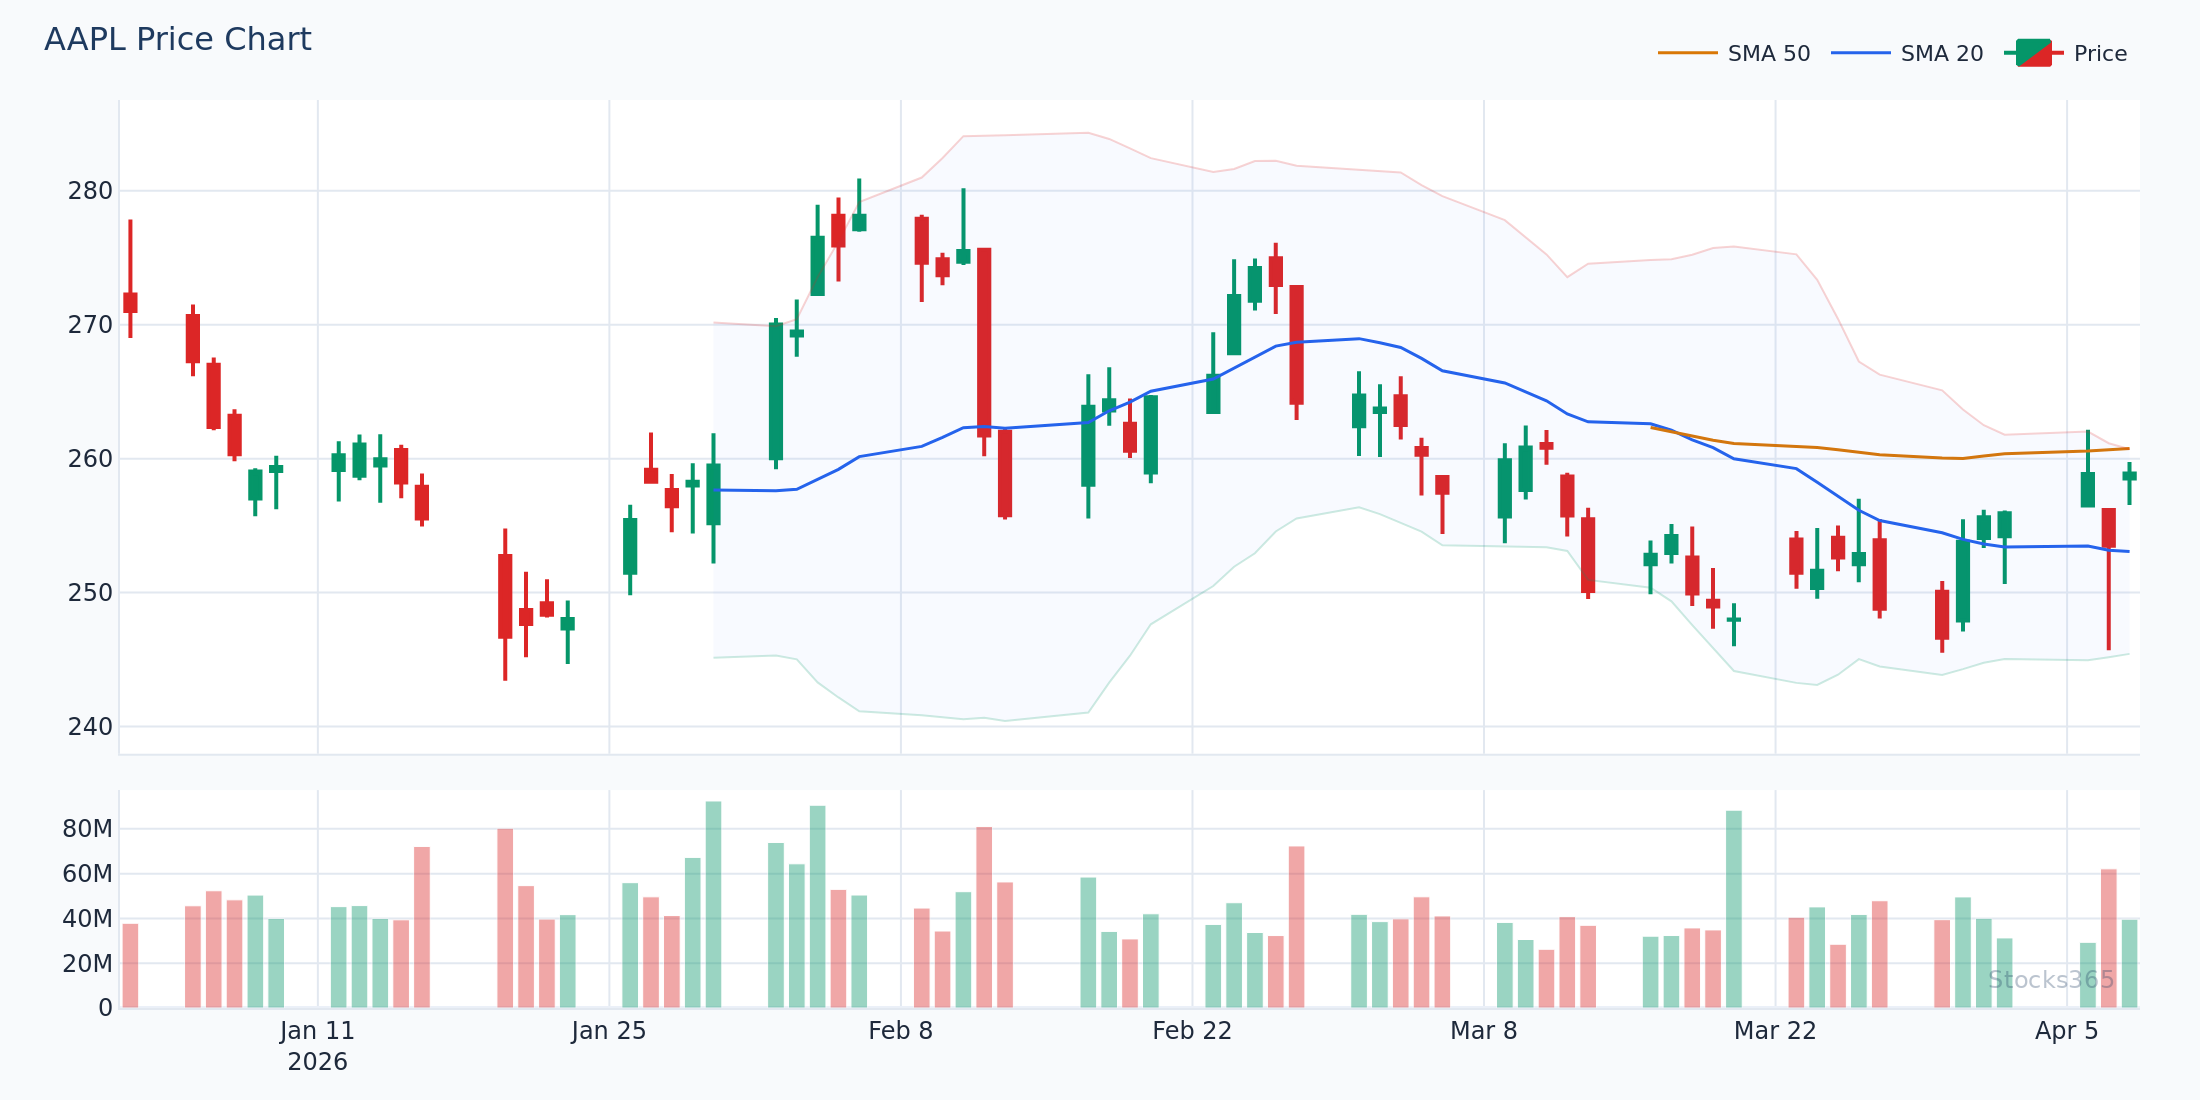
Imagine AAPL trading at $245 after a 14-week uptrend. Price grinds to a marginal new high at $247.80, but the MACD histogram is printing at +0.42, well below the +1.10 peak it made when price was at $238. This bearish MACD divergence — combined with a shooting star candlestick at known resistance — creates a high-probability setup. Price subsequently pulls back to $228 over the following three weeks.
In this scenario, MACD divergence was the leading signal. It told you that buying pressure was exhausted before price confirmed the reversal with a break of structure. A pure price action trader might have waited for the lower low confirmation at, say, $241 — entering later and giving up some of the move.
Scenario 2: Bullish Divergence at Major Support
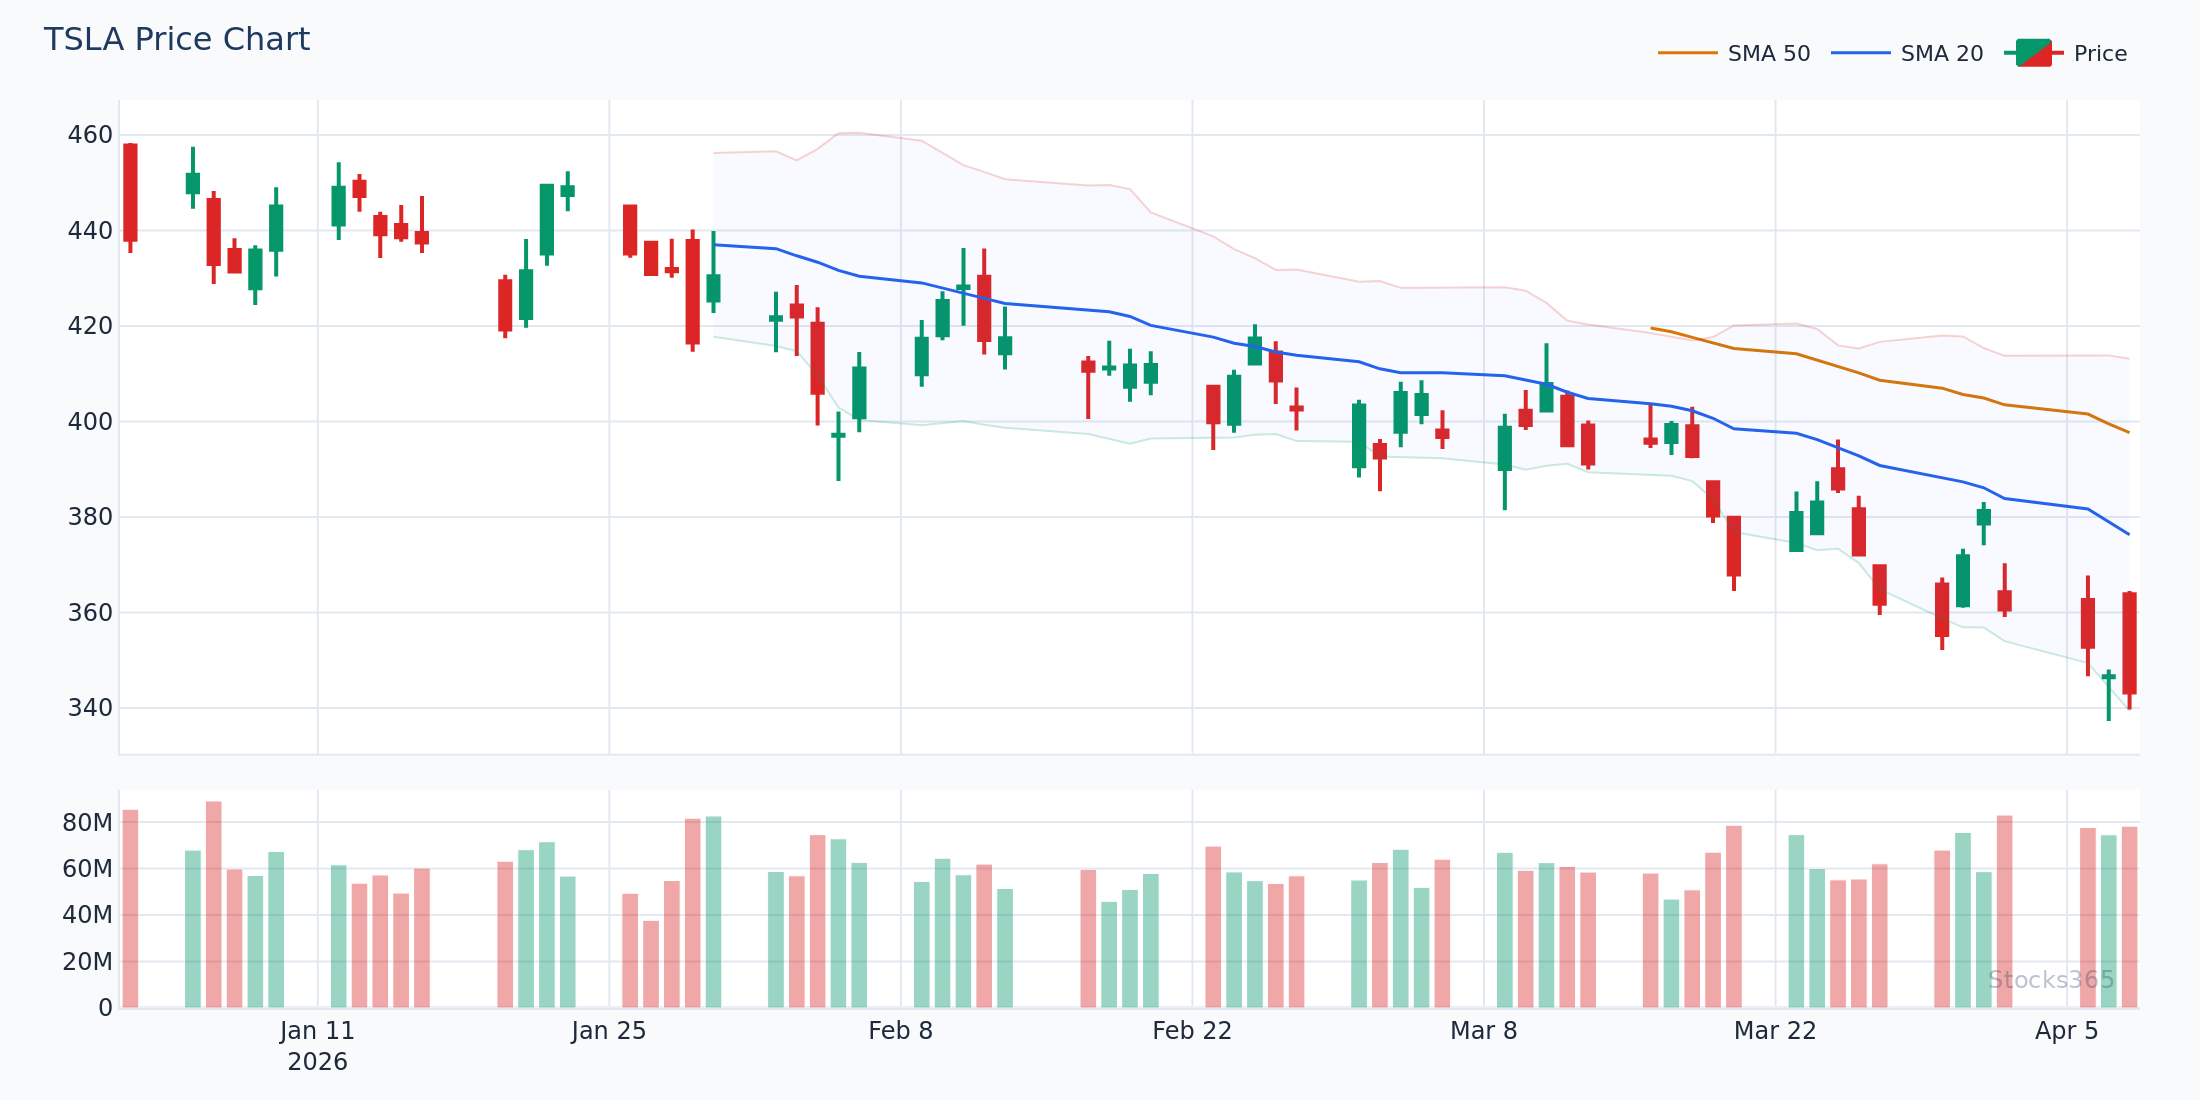
TSLA is in a multi-week downtrend. Price tests a major support zone at $195 and makes a new low at $192.50. But MACD makes a higher low at -0.85 compared to its previous low of -1.42. This bullish divergence at a known support level, combined with a bullish engulfing candle on the daily chart, signals a high-probability bounce. Price rallies to $218 over the next two weeks.
Here again, the MACD divergence — when aligned with price action context — provided an early warning of the reversal before a new higher high confirmed the structural trend change.
The pattern is clear: MACD divergence is most reliable as a leading signal when it occurs at significant price action levels — support/resistance zones, trendline touches, or after extended momentum moves. In isolation, it's far less dependable.
When Price Action Leads and MACD Divergence Lags
Breakout Scenarios
In breakout trading, MACD divergence is essentially useless as a leading tool. When MSFT breaks above a months-long consolidation range at, say, $430 on high volume, that price action signal is immediate and actionable. The MACD won't show meaningful divergence in this scenario because the breakout is a momentum acceleration, not a momentum divergence. A price action trader is already in the trade while a divergence-focused trader is still waiting for a signal that may never come.
Strong Trend Continuation
During strong trending phases, MACD will frequently show what appear to be bearish divergences on lower timeframes — but these are simply the natural rhythm of an impulse-correction cycle within a larger uptrend. Price action analysis of the higher timeframe (daily or weekly structure remaining bullish, price holding above key EMAs) immediately tells you these divergences are noise. The price action context overrides the oscillator signal.
This is conceptually similar to what happens with RSI divergence. If you've studied RSI divergence, you'll recognize the same principle: oscillator divergence against the dominant trend has a much lower success rate than divergence signals that align with trend structure. The same logic applies directly to MACD.
Combining MACD Divergence with Price Action: The Optimal Framework
The most effective traders don't choose between MACD divergence and price action — they use price action as their primary framework and MACD divergence as a confirmation or timing tool. Here's a practical structure:
Step 1: Establish Higher-Timeframe Price Action Context
Start on the weekly or daily chart. Identify the dominant trend structure. Are you seeing higher highs and higher lows, or the opposite? Identify key support and resistance levels. This is your map — everything else is just navigation tools.
Step 2: Identify Key Price Action Levels on the Trading Timeframe
Drop to your trading timeframe (4-hour or daily for swing traders, 15-minute or 1-hour for intraday). Mark the nearest significant support and resistance levels, previous swing highs/lows, and any active supply/demand zones.
Step 3: Watch for MACD Divergence at These Levels
Now activate MACD divergence as your timing signal. You're not looking for divergence anywhere on the chart — you're specifically watching for divergence signals at the key price action levels you've already identified. This dramatically filters out false signals.
Step 4: Confirm with Candlestick Pattern
Before entering, wait for a confirming candlestick pattern — a pin bar, engulfing candle, or inside bar — at the level. This ensures price is actually responding to the zone and not just passing through it.
Step 5: Define Risk Around Price Action, Not the Indicator
Place your stop-loss based on price structure — just beyond the swing high/low that defines the setup — not based on any MACD level. Your risk management should always be rooted in price.
MACD Divergence vs RSI Divergence: A Brief Comparison
Many traders who study divergence setups naturally compare MACD divergence with RSI divergence. Both are valuable, but they measure momentum differently. RSI is a bounded oscillator (0–100) that measures the speed and magnitude of price changes, while MACD is an unbounded trend-following momentum indicator that shows the relationship between two EMAs.
In practice, RSI divergence tends to be more visible and easier to identify for most traders, particularly beginners. If you're new to divergence trading, the RSI divergence guide is an excellent foundation before layering in MACD analysis. For more advanced applications, including hidden divergence patterns that indicate trend continuation rather than reversal, hidden RSI divergence shares the same conceptual framework as hidden MACD divergence.
When both MACD divergence and RSI divergence align at the same price action level, that confluence significantly increases the probability of the setup. Think of it as multiple independent witnesses testifying to the same event. To understand how RSI compares to other oscillators in terms of signal quality, the RSI vs Stochastic Oscillator guide provides useful context for oscillator selection.
Common Mistakes Traders Make with MACD Divergence
- Trading divergence against a strong trend: This is the single most common and costly mistake. Bearish divergence in a strong uptrend is often just a pause before continuation, not a reversal signal.
- Using only one timeframe: A divergence on the 15-minute chart means very little without checking the hourly and daily chart context.
- Ignoring the MACD zero line: Divergence signals that form above the zero line (for bearish) or below it (for bullish) carry different weight than those that cross it. Zero-line positioning adds important context.
- Not waiting for price action confirmation: Entering purely on MACD divergence without any price action confirmation — a key candlestick pattern or a minor break of structure — dramatically increases false-signal exposure.
- Choosing arbitrary swing points: Only connect clearly defined, significant swing highs and lows when drawing divergence. Connecting minor pivots creates false divergence patterns that don't reflect genuine momentum shifts.
Using Stocks365 Intelligence to Validate Divergence Setups
Identifying MACD divergence and price action setups manually is powerful, but validating them against broader market intelligence adds another layer of confidence. The Stocks365 signals dashboard aggregates multi-timeframe technical analysis, momentum scoring, and trend strength metrics — giving you a rapid way to cross-reference whether a divergence setup you've identified aligns with broader signal quality on that instrument.
For example, if you've spotted a bullish MACD divergence on AAPL at a key price action level, checking the AAPL signal page on Stocks365 lets you see the trust score — a composite measure of signal alignment across multiple indicators and timeframes. A high trust score alongside your divergence setup is a meaningful confluence signal. A low trust score should prompt you to exercise caution or reduce position size until the setup clarifies.
This kind of multi-source validation is what separates disciplined, systematic trading from gut-feel decision-making — and it's particularly valuable in the fast-moving, algorithm-dominated markets of 2026.
Key Takeaways
Summary: MACD Divergence vs Price Action
- Price action is the primary signal — it reflects the raw reality of market supply and demand without mathematical transformation or lag.
- MACD divergence is a powerful timing and confirmation tool, but it should never be traded in isolation.
- The highest-probability setups occur when MACD divergence forms at significant price action levels — support/resistance zones, trendline touches, or post-extended-momentum situations.
- Bearish MACD divergence against a strong trend has a low success rate — always check higher-timeframe trend structure first.
- Combining MACD divergence with RSI divergence at the same level creates powerful confluence — multiple oscillators confirming the same momentum shift.
- Risk management must always be based on price structure (stop beyond the relevant swing high/low), not on indicator levels.
- Use the Stocks365 trust score system to validate the overall signal quality of setups before committing capital.
Frequently Asked Questions
Does MACD divergence always predict a price reversal?
No — MACD divergence does not guarantee a price reversal. It signals that momentum is weakening, but price can continue in the same direction, especially in strong trends. Divergence is most reliable when it appears at significant price action levels (key support/resistance zones) and is confirmed by a candlestick pattern. Standalone divergence, particularly against a strong trend, has a much lower success rate.
Which is more reliable: MACD divergence or RSI divergence?
Both have comparable reliability when applied correctly, but RSI divergence is often easier for traders to identify due to RSI's bounded nature (0–100), which makes swing points more visually clear. MACD divergence provides additional context through histogram height and zero-line positioning. Many traders use both together as a confluence strategy — when MACD and RSI divergence align at the same level, signal quality is significantly enhanced. See the RSI divergence guide for a detailed breakdown of RSI-based divergence trading.
What timeframe works best for MACD divergence trading?
Higher timeframes (daily and weekly) produce the most reliable MACD divergence signals because they filter out the noise inherent in lower timeframes. For swing traders, daily chart divergence is typically the sweet spot. Intraday traders can use 1-hour or 4-hour MACD divergence, but should always validate against the daily chart structure. The lower the timeframe, the more false signals you'll encounter.
Can you trade MACD divergence without knowing price action?
Technically yes, but it's not recommended. Traders who rely solely on MACD divergence without price action context are essentially trading momentum signals without understanding the structural environment — similar to navigating without a map. The majority of failed divergence trades occur because the trader didn't recognize they were trading against the dominant trend or at a non-significant price level. Learning price action first makes every indicator-based strategy significantly more effective.
How do I avoid false MACD divergence signals?
The most effective filters are: (1) Only act on divergence that aligns with the higher-timeframe trend direction or forms at a major structural level, (2) Require a candlestick confirmation pattern before entry, (3) Use a second oscillator like RSI to confirm the divergence, (4) Avoid trading divergence immediately ahead of major news events or earnings releases, and (5) Check the Stocks365 trust score for the instrument to ensure broader signal alignment. Applying multiple filters simultaneously reduces false signals dramatically, though it also reduces trade frequency — a worthwhile trade-off for improved accuracy.