
Advanced MACD Strategies: Beyond the Basic Crossover
The Moving Average Convergence Divergence indicator — better known as MACD — is one of the most widely used tools in technical analysis. But here's the uncomfortable truth: most traders use it wrong. They wait for a simple line crossover, enter a trade, and wonder why they keep getting whipsawed out of positions.
Professional traders treat MACD as a multi-dimensional tool, not a one-trick signal generator. In 2026, with algorithmic trading dominating short-term price action and volatility regimes shifting rapidly across equity and crypto markets, mastering an advanced MACD strategy is more critical than ever. This guide breaks down the exact techniques institutional traders and seasoned retail professionals use to extract consistent, high-probability setups from this powerful momentum oscillator.
"The MACD doesn't tell you where price is going — it tells you how fast momentum is changing direction. That's a completely different, and far more powerful, piece of information."
Understanding MACD at a Deeper Level
Before diving into advanced strategies, it's worth rebuilding your mental model of what MACD actually measures. The standard MACD is constructed from three components:
- MACD Line: The difference between the 12-period and 26-period Exponential Moving Averages (EMAs)
- Signal Line: A 9-period EMA of the MACD line itself
- Histogram: The visual representation of the difference between the MACD line and Signal line
What separates novice from professional traders is recognizing that the histogram is the most powerful component — not the crossovers. The histogram's rate of change, its peaks and troughs, and its relationship to price action tell you far more than a simple line cross ever will.
Understanding momentum oscillators in depth will also sharpen your edge. Many professional traders pair MACD with RSI to build confirmation layers. If you're newer to oscillator-based trading, our guide on how to use RSI in trading provides an excellent foundation for understanding momentum-based signals.
Advanced MACD Strategy #1: MACD Histogram Divergence
MACD divergence is arguably the most powerful signal the indicator generates — and it's consistently underused. Divergence occurs when price makes a new high (or low) that is not confirmed by the MACD histogram or MACD line. This discrepancy signals weakening momentum before a reversal becomes obvious on the price chart.
Bullish MACD Divergence Setup
A classic bullish divergence occurs when:
- Price prints a lower low on the chart
- But MACD histogram prints a higher low (less negative)
- This signals that bearish momentum is exhausting itself
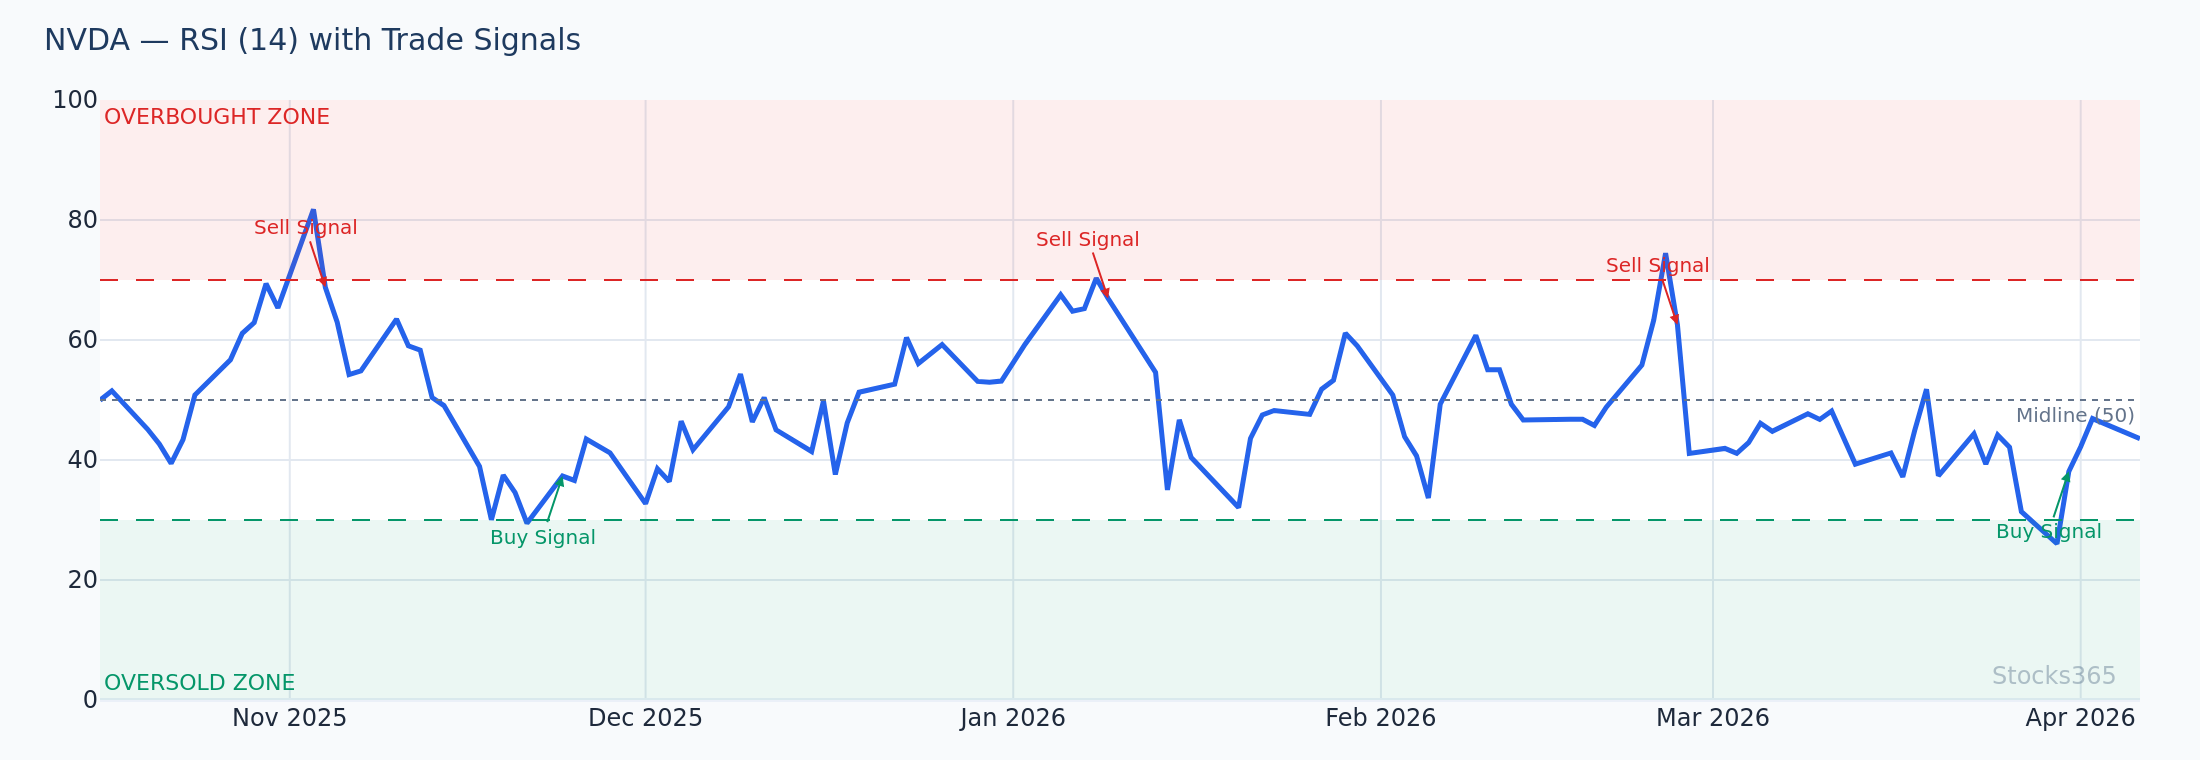
Practical example: In early 2026, NVDA pulled back from its AI-driven highs to the $890 support zone. While price printed a new swing low at $887, the MACD histogram's trough was significantly shallower than the previous low — a textbook bullish divergence. Traders who identified this setup caught the subsequent rally to $960+ within two weeks.
Bearish MACD Divergence Setup
Bearish divergence works in reverse:
- Price makes a higher high
- MACD histogram makes a lower high (less positive)
- Momentum is decelerating even as price climbs — a warning sign for bulls
This divergence concept is closely related to RSI divergence mechanics. For a deeper comparative study, explore our article on RSI divergence: mastering bullish and bearish signals. The conceptual overlap between MACD and RSI divergence is significant, and traders who understand both indicators have a substantial analytical edge.
Advanced MACD Strategy #2: Hidden Divergence for Trend Continuation
While regular divergence signals potential reversals, hidden divergence is used by professional traders to identify high-probability trend continuation setups. This is one of the most overlooked concepts in momentum trading.
What Is Hidden MACD Divergence?
Hidden divergence occurs in the opposite direction to regular divergence:
- Bullish hidden divergence: Price makes a higher low, but MACD makes a lower low — signals continuation of the uptrend
- Bearish hidden divergence: Price makes a lower high, but MACD makes a higher high — signals continuation of the downtrend
Professional traders love hidden divergence because it allows them to enter pullbacks within strong trends with confidence. Rather than fighting the trend at an inflection point, hidden divergence tells you the trend is still intact and the pullback is likely over.
Interestingly, this same concept applies to RSI. Our article on hidden RSI divergence covers the mirror application of this technique and is essential reading for traders building a multi-indicator confirmation framework.
Hidden Divergence Trade Example
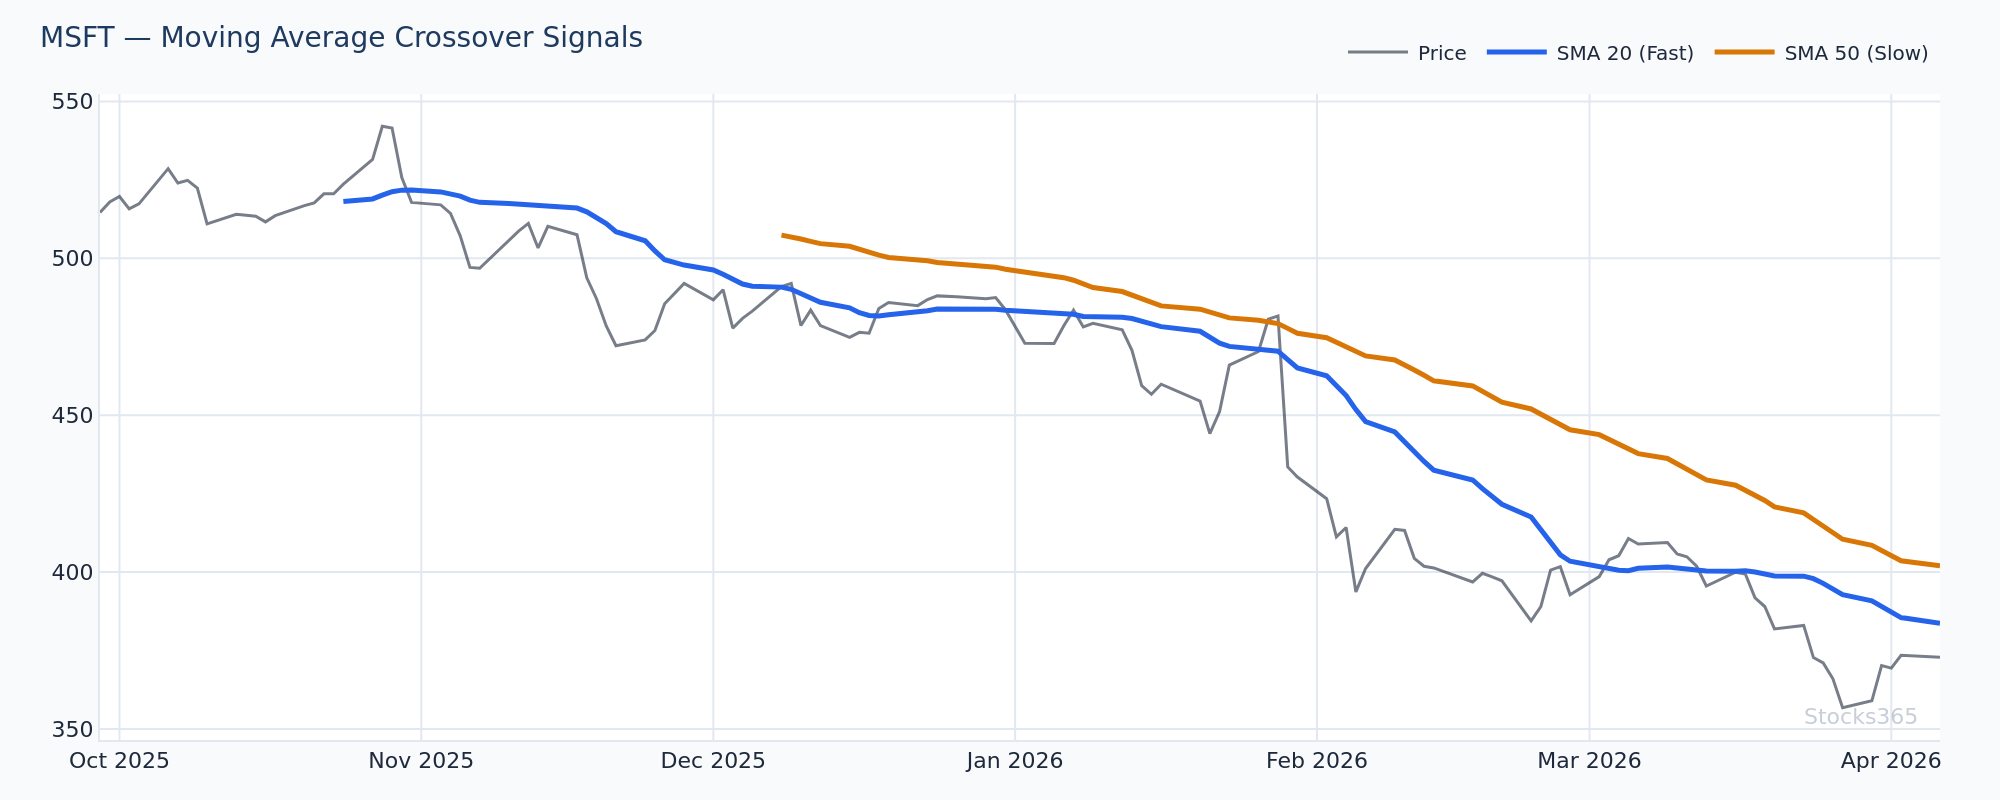
MSFT pullback setup (2026): During Microsoft's Q1 2026 uptrend, price pulled back from $450 to $421, printing a higher low compared to the December 2025 low of $398. However, the MACD histogram printed a slightly lower low during this correction. This hidden bullish divergence confirmed the pullback was temporary — traders who entered near $423 rode the subsequent push to $468 within six weeks.
Advanced MACD Strategy #3: Multi-Timeframe MACD Analysis
Single-timeframe MACD analysis is a beginner's approach. Professional traders always contextualize signals within a higher timeframe trend. This technique dramatically reduces false signals and dramatically improves win rates.
The Three-Timeframe Framework
Here's how professional traders layer timeframes:
- Weekly MACD: Defines the dominant trend bias (bullish or bearish). Only trade in the direction of the weekly MACD signal.
- Daily MACD: Identifies the intermediate-term momentum and potential setup zones
- 4-Hour or 1-Hour MACD: Provides precise entry and exit timing within the daily setup
The rule is straightforward but powerful: only take long trades when the weekly MACD is bullish, the daily MACD is turning bullish from below the zero line, and the 4-hour MACD histogram is expanding positively. This triple confirmation approach filters out the majority of noise-driven false signals.
Zero-Line Crosses in Multi-Timeframe Context
The MACD zero line represents the boundary between bullish and bearish momentum. A MACD line crossing above zero on the daily chart while the weekly MACD is already positive is a powerful institutional signal — it tells you that short-term momentum has re-aligned with the dominant trend. Professional swing traders specifically hunt this setup.
Advanced MACD Strategy #4: MACD with Volume Confirmation
Volume is the one input most MACD traders completely ignore — and it's the one that separates genuine momentum from manufactured moves. Every advanced MACD setup gains significantly higher conviction when confirmed by volume behavior.
Volume Rules for MACD Setups
- Bullish crossover + rising volume: Strong confirmation — institutional money is entering the move
- Bullish crossover + declining volume: Weak signal — the move may fade quickly
- Bearish divergence + volume spike: Distribution is occurring — high-probability reversal signal
- Bullish divergence + volume expansion on the lows: Capitulation selling followed by absorption — powerful reversal setup
Practical tip: On the Stocks365 signals dashboard, you can cross-reference MACD-based signals with volume metrics in real time. The platform's trust score system weights signal quality based on multiple confirmation factors including volume alignment — giving you an immediate read on whether a MACD setup has genuine institutional backing or is likely to be a false breakout.
Advanced MACD Strategy #5: MACD + RSI Confluence Trading
Professional traders rarely rely on a single indicator. The most robust advanced MACD strategy setups involve confluence — multiple independent indicators pointing to the same conclusion simultaneously. MACD and RSI are the two most powerful momentum oscillators, and their signals are most compelling when they align.
The MACD-RSI Confluence Setup
Here's the professional framework for MACD + RSI confluence trading:
- Step 1: Identify MACD bullish divergence on the daily chart
- Step 2: Confirm RSI is simultaneously showing bullish divergence or emerging from oversold territory (below 30)
- Step 3: Wait for the MACD histogram to turn positive (first green bar after red sequence)
- Step 4: Enter on the next candle's open with a stop below the recent swing low
- Step 5: Target the next resistance level, using MACD histogram peak as a partial exit signal
When both MACD and RSI confirm the same setup, win rates on swing trades historically improve by 15-25% compared to using either indicator alone. To understand optimal RSI configuration for this strategy, our guide on RSI settings and period optimization covers exactly how to tune the oscillator for different market conditions and timeframes.
For traders who want to understand the comparative strengths of RSI versus other oscillators used alongside MACD, our comprehensive RSI vs Stochastic Oscillator guide provides valuable context on which tools work best in trending versus range-bound markets.
Advanced MACD Strategy #6: MACD Histogram Slope Analysis
This is a technique used almost exclusively by professional and algorithmic traders — and it gives you a significant edge over basic crossover followers. Instead of waiting for the MACD line to cross the signal line, experienced traders monitor the rate of change of the histogram.
How Histogram Slope Trading Works
The MACD histogram's slope tells you whether momentum is accelerating or decelerating. Here's how to use it:
- Histogram bars growing taller (same direction): Momentum is accelerating — add to existing positions or hold with confidence
- Histogram bars shrinking (same direction): Momentum is decelerating — consider taking partial profits or tightening stops
- First reversal bar: The single most important early warning signal — the first histogram bar that moves counter to the trend often precedes a crossover by 2-4 bars
By acting on the first reversal histogram bar rather than waiting for the full crossover, professional traders enter and exit positions 3-5 candles earlier than the crowd — a significant edge, particularly on shorter timeframes where every bar counts.
MACD Settings Optimization for Different Markets
The default 12-26-9 MACD settings are a starting point, not a final answer. Professional traders optimize settings based on the instrument and market condition:
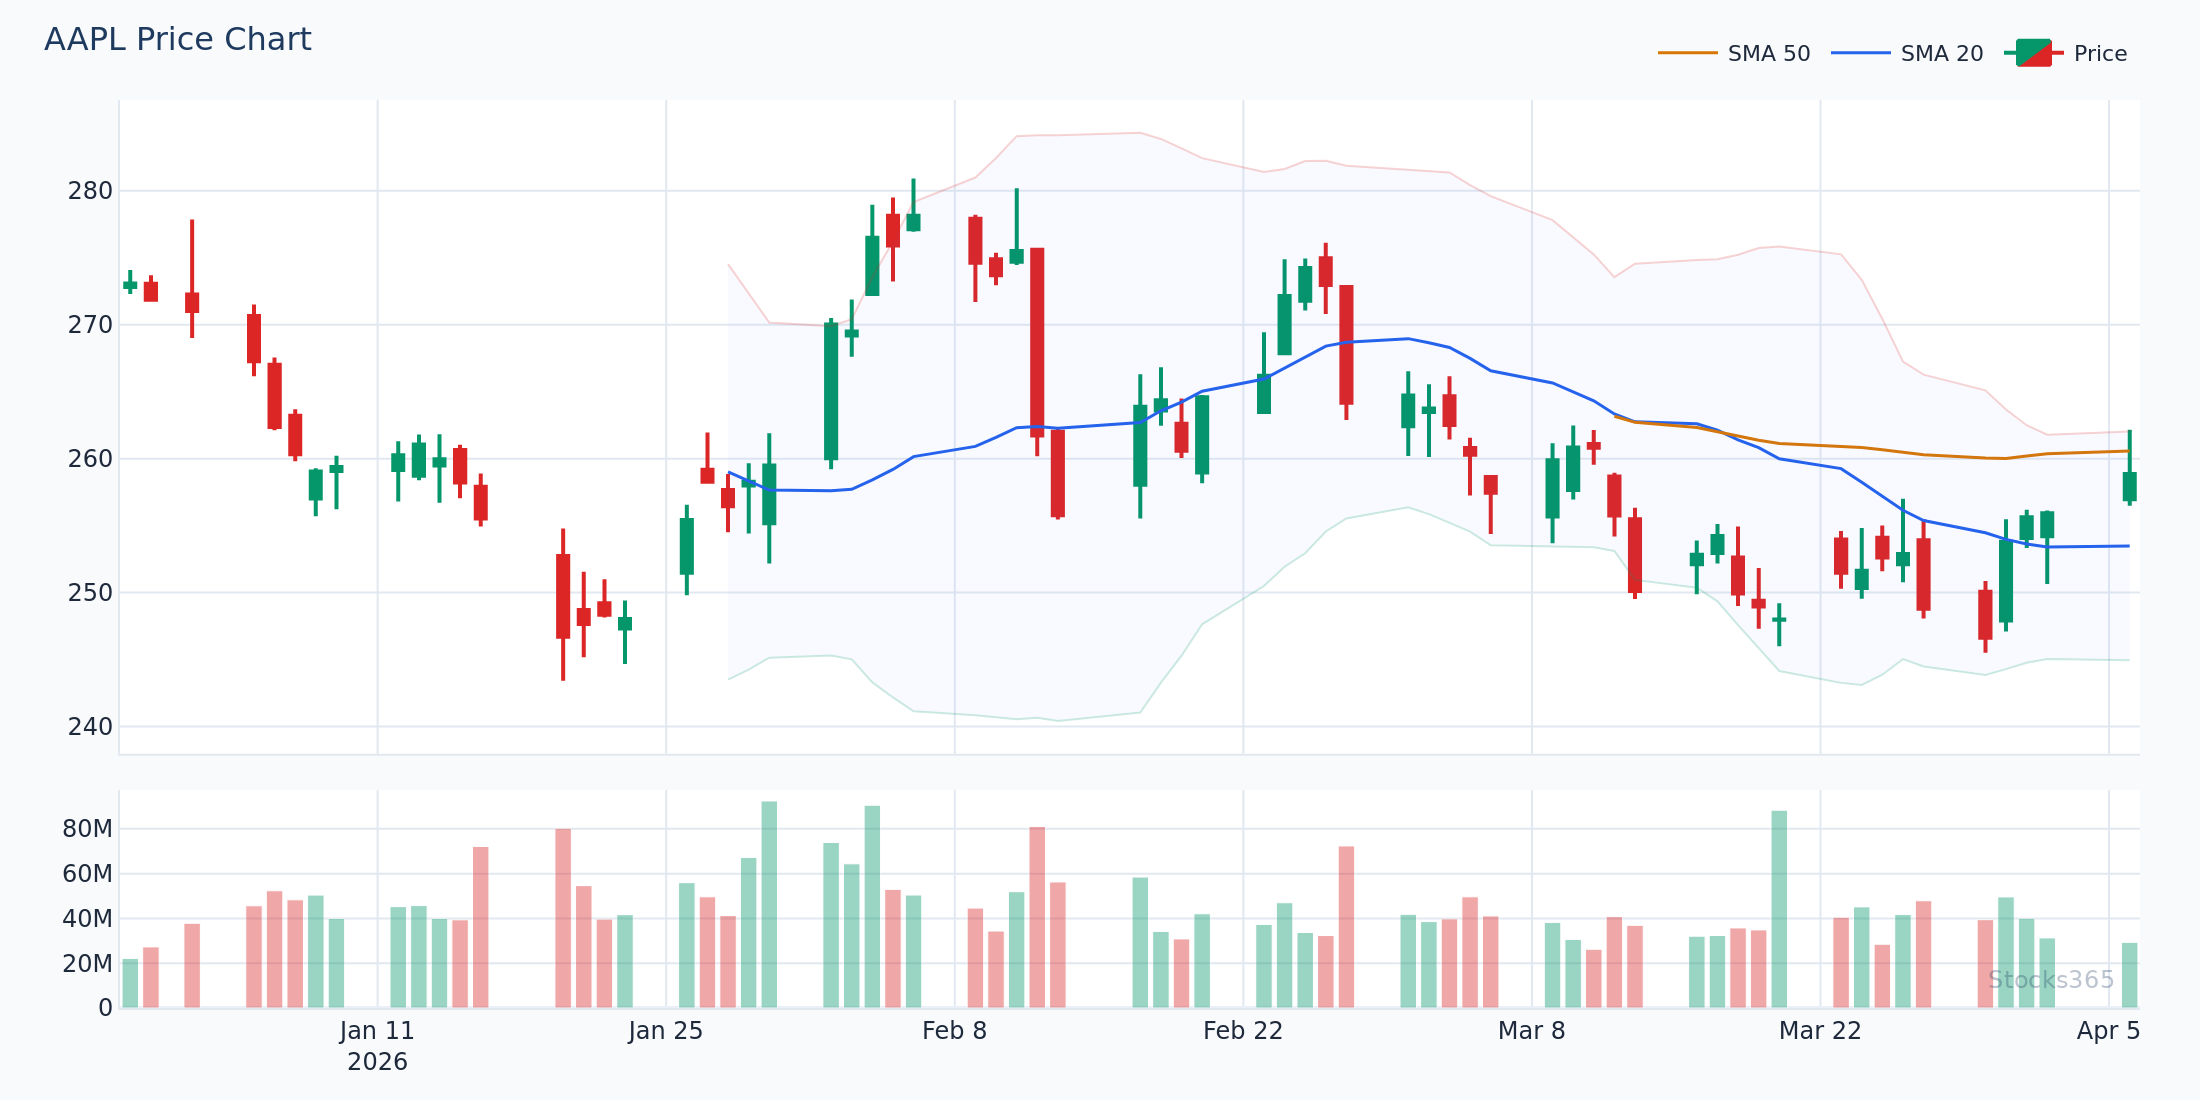
- Trending equities (e.g., AAPL, MSFT): Default 12-26-9 works well for daily swing trades
- Volatile growth stocks (e.g., TSLA, NVDA): Faster settings like 8-17-9 reduce lag and capture faster momentum shifts
- Macro/index ETFs: Slower settings like 19-39-9 reduce noise and focus on dominant institutional momentum
- Intraday trading (15-min charts): 5-13-4 settings provide responsive signals without excessive whipsaws
The philosophy of adapting indicator parameters to market conditions parallels the RSI period optimization framework. Just as RSI period selection profoundly impacts signal quality — as detailed in our RSI settings guide — MACD parameter tuning is equally important for extracting reliable momentum signals.
Putting It All Together: A Professional MACD Trading Checklist
Before executing any MACD-based trade, professional traders run through a structured checklist. Here's a framework you can implement immediately:
- ✅ Trend alignment: Is the weekly MACD supportive of the trade direction?
- ✅ Divergence check: Is MACD showing regular or hidden divergence consistent with the setup?
- ✅ Zero-line context: Is the MACD line above or below zero, and is this consistent with the trade bias?
- ✅ Histogram slope: Is momentum accelerating in the trade direction?
- ✅ Volume confirmation: Is volume supporting the MACD signal?
- ✅ RSI confluence: Does RSI confirm the momentum reading independently?
- ✅ Risk/reward ratio: Is there at least a 1:2 risk/reward to the nearest logical target?
You can apply this checklist directly to live market opportunities using the Stocks365 AAPL signal page and equivalent pages for other instruments. The platform's trust score system automatically evaluates multiple confirmation layers, making it easier to identify which MACD setups have the highest institutional-grade signal quality at any given moment.
Common Mistakes Advanced MACD Traders Avoid
Even experienced traders fall into these MACD traps. Here's what to consciously avoid:
- Trading every crossover: The majority of crossovers in sideways markets are noise. Only act on crossovers supported by divergence and multi-timeframe alignment.
- Ignoring the zero line: A bullish crossover below zero is weaker than one above zero. Context matters enormously.
- Using MACD alone: MACD without volume, RSI, or price structure confirmation is a 50/50 coin flip dressed up as analysis.
- Misidentifying divergence: True divergence requires clear, significant swing points — not minor intraday wiggles. When in doubt, zoom out to a higher timeframe.
- Fixed settings for all markets: Applying 12-26-9 to a hyper-volatile biotech stock and a slow-moving blue chip index fund with equal confidence is a systematic error.
📊 Key Takeaways: Advanced MACD Strategy
- MACD histogram divergence is the most powerful MACD signal — prioritize it over simple crossovers
- Hidden divergence identifies high-probability trend continuation entries — not just reversals
- Multi-timeframe analysis dramatically reduces false signals by ensuring trade direction aligns with the dominant trend
- Volume confirmation separates genuine institutional momentum from retail-driven noise
- MACD + RSI confluence provides the highest-probability setups — two independent indicators confirming the same signal
- Histogram slope analysis gives 3-5 bar early warning before official crossovers — a significant timing edge
- Settings optimization by instrument type is essential for consistent signal quality
- The Stocks365 dashboard trust score system helps validate multi-factor MACD setups in real time
Frequently Asked Questions
What is the most reliable advanced MACD strategy for swing trading?
The most reliable advanced MACD strategy for swing trading is MACD histogram divergence combined with multi-timeframe confirmation. When the daily chart shows bullish MACD divergence while the weekly MACD trend is positive, and RSI simultaneously confirms the setup, you have one of the highest-probability swing trade configurations available in technical analysis. This combination reduces false signals dramatically compared to using MACD crossovers alone.
How do professional traders use MACD differently from beginners?
Professional traders focus primarily on histogram behavior, divergence signals, and multi-timeframe alignment rather than simple line crossovers. They also optimize MACD settings for specific instruments, use volume as a confirmation filter, and pair MACD with complementary indicators like RSI to build confluence-based setups. Beginners typically react to every crossover mechanically, while professionals use MACD as one layer within a structured, multi-factor analysis framework.
What are the best MACD settings for day trading vs. swing trading?
For day trading on 15-minute charts, faster settings like 5-13-4 provide more responsive signals without excessive lag. For standard swing trading on daily charts, the default 12-26-9 settings work well for most liquid equities. For macro/index ETF swing trading, consider slower settings like 19-39-9 to filter out short-term noise and focus on dominant institutional trend momentum. Always backtest settings adjustments against your specific target instruments before deploying them with real capital.
Can MACD be used effectively in both trending and ranging markets?
MACD performs best in trending markets where it can track genuine momentum shifts. In sideways, low-volatility range-bound conditions, MACD generates frequent false crossovers and unreliable divergence signals. Professional traders assess market structure first — using tools like Bollinger Band width or ADX to determine whether a trend exists — before applying MACD analysis. If the market is ranging, MACD signals should be treated with significant skepticism or avoided altogether until a trend re-establishes.
How does MACD divergence differ from RSI divergence, and should I use both?
MACD divergence measures momentum shifts through the relationship between two moving averages, while RSI divergence measures the speed and magnitude of price changes through relative strength calculations. They are mathematically independent, which means when both show divergence simultaneously, it represents two separate analytical frameworks reaching the same conclusion — a genuinely powerful confluence signal. Using both is strongly recommended for high-conviction setups. Our detailed guide on RSI divergence signals covers the RSI side of this confluence framework comprehensively.