
Why Moving Averages Are More Than Just Trend Lines
Most traders learn moving averages as trend-following tools. They overlay a 50-day or 200-day MA on a chart, see where price sits relative to it, and call it a day. That's leaving money on the table.
Moving averages function as dynamic support and resistance — living, breathing levels that shift with the market. Unlike horizontal lines drawn at fixed prices, moving average support and resistance adapts. It rises in uptrends. It falls in downtrends. It tells you where the crowd expects price to stabilize or reverse, and it updates every single session.
This guide covers how to use that dynamic quality as a genuine trading edge.
How Moving Averages Create Support and Resistance
Price doesn't bounce off a moving average by accident. The mechanism is psychology at scale.
When millions of market participants watch the same MA — say, the 200-day simple moving average — they anchor decisions to it. Institutional buyers set limit orders near it. Algorithmic strategies trigger entries when price touches it. Retail traders see it holding and pile in. That collective behavior turns an arbitrary line into a self-fulfilling level.
The more widely followed the moving average, the stronger the support or resistance it creates. This is why the 20, 50, 100, and 200-period MAs matter far more than obscure settings. Millions of traders watching the same number means millions of potential orders clustering near it.
Dynamic vs. Static Support and Resistance
Static support sits at a fixed price — a prior swing low, a round number, a gap fill. Dynamic support moves. A rising 50-day MA might be sitting at a completely different level this week than it was six weeks ago, but it still attracts price like a magnet.
The practical difference? In a strong uptrend, price rarely revisits old static levels. But it constantly tests the rising MA. Trading that test — rather than hunting for stale horizontal lines — keeps you in the right part of the chart at the right time.
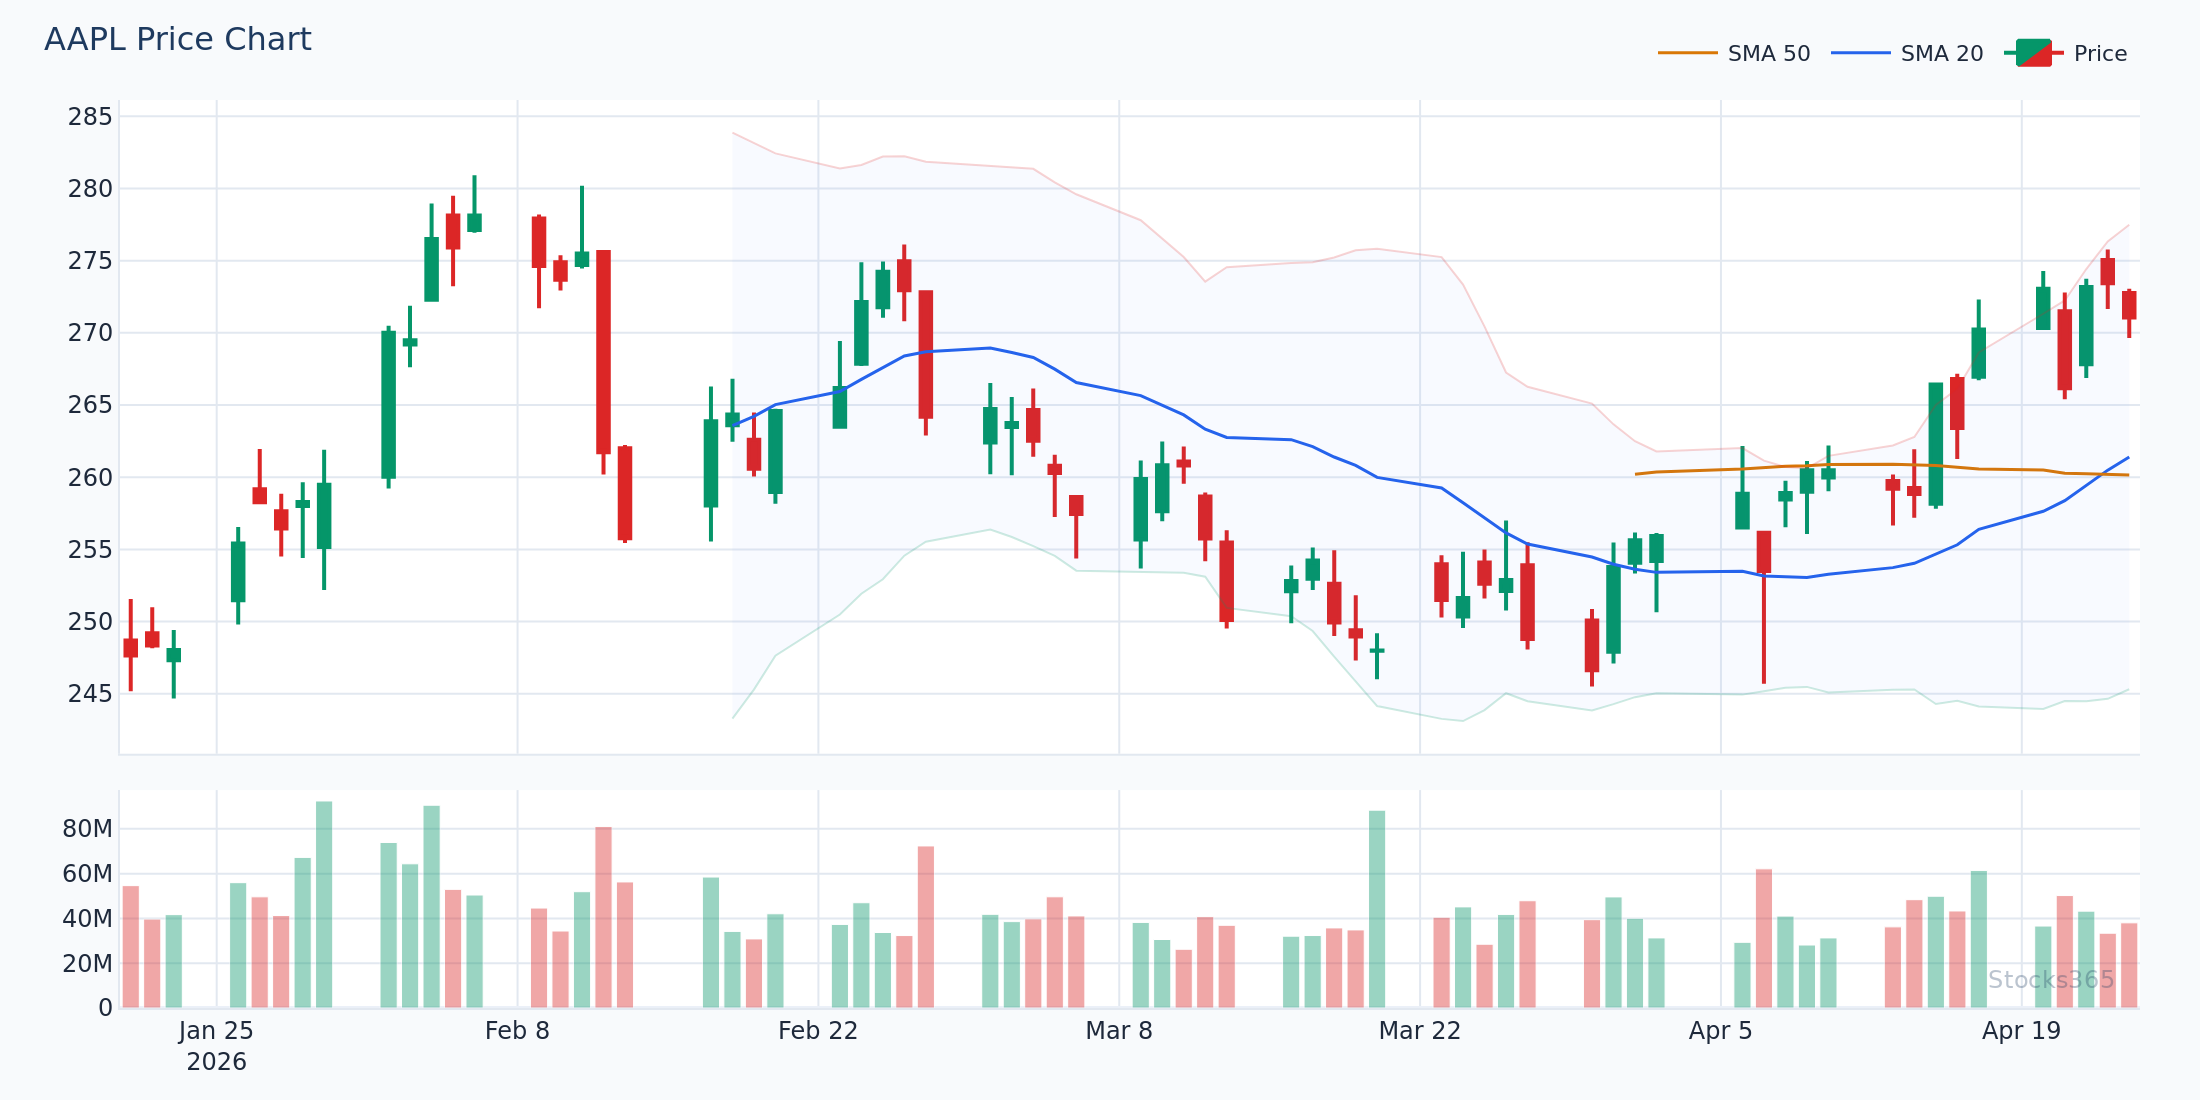
This chart shows price pulling back into a rising 50-day SMA after a strong advance. When the candles close back above the MA after testing it, the setup suggests the uptrend is resuming. A close below the MA — especially on elevated volume — invalidates the bounce thesis and signals a potential trend change.
The Key Moving Averages for Support and Resistance
Not all MAs carry equal weight. Here's how traders use each one.
The 20-Period MA: Momentum's Pulse
The 20-period moving average (daily or weekly) tracks the short-term trend. In strong momentum moves, it acts as first-line support. Price tags it and bounces. Momentum traders use it as a trailing guide — staying long above it, exiting when it breaks.
It's also useful in reverse. In downtrends, the 20-period MA becomes overhead resistance. Every rally attempt fails as price approaches it from below. That pattern of lower highs forming near a declining 20-period MA is one of the cleaner short-selling setups in practice.
The 50-Period MA: The Institutional Benchmark
Professional money managers watch the 50-day MA closely. It separates intermediate uptrends from corrections. A stock holding above its 50-day after a pullback signals institutional support. A breakdown below it — especially on high volume — often precedes more significant selling.
The 50-day is also where breakdowns get retested. Price breaks below it, sells off, then rallies back to retest it from below. That retest — where the 50-day switches from support to resistance — is one of the most reliable short entries in technical analysis.
The 200-Period MA: The Market's Long Memory
The 200-day simple moving average is the institutional standard for defining bull and bear markets. Price above the 200-day: bullish regime. Price below: bearish.
Its support and resistance qualities are strongest precisely because everyone watches it. When a major index or large-cap stock drops to its 200-day for the first time in months, expect fireworks — either a strong bounce as buyers defend it, or a decisive break that triggers a wave of sell orders from algorithms and risk managers alike.
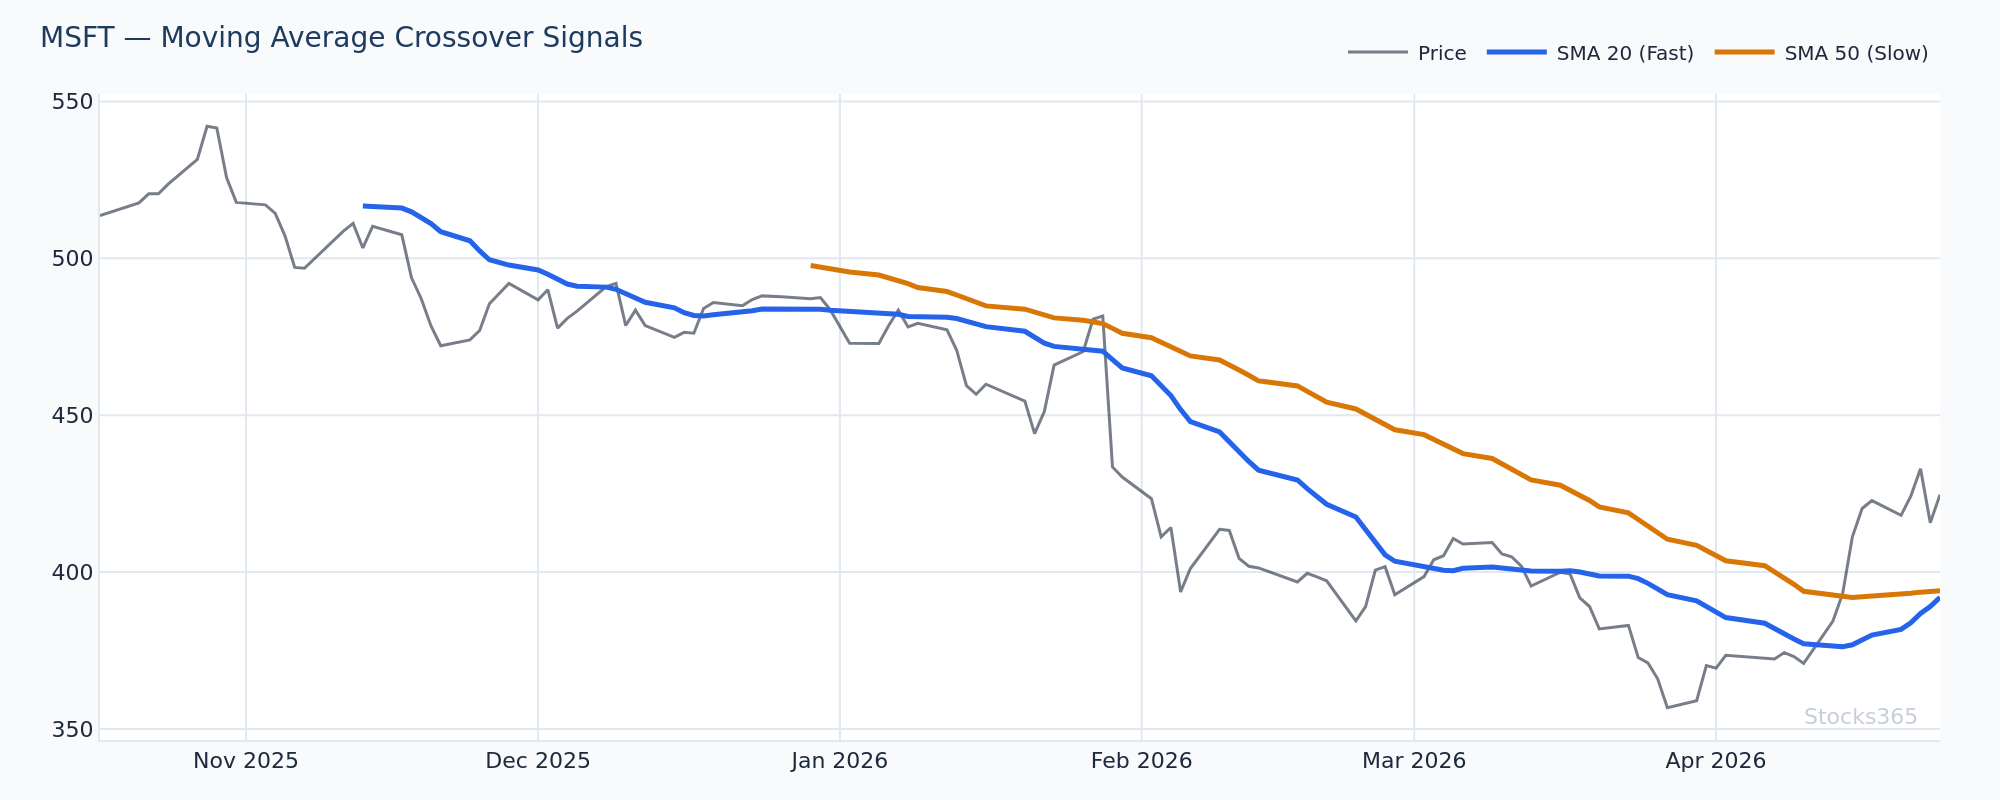
This chart captures how price approached the 200-day SMA during a correction phase. A decisive close below would have signaled a regime shift for many institutional models. Instead, the bounce confirms buyer conviction at this level. The follow-through candles — closing above the MA with expanding volume — are the confirmation that the support held.
Types of Moving Average Support and Resistance Setups
The Pullback to MA (Trend Continuation)
This is the bread-and-butter setup. Price breaks out, runs higher, then pulls back to test a key MA. The MA catches it. Price bounces and resumes the prior trend.
What makes it work: the MA acts as a technical reference point for traders who missed the initial breakout. They wait for the retest and enter there, which creates buying pressure exactly where the MA sits.
Entry trigger: a bullish reversal candle (engulfing, hammer, or pin bar) forming on or just above the MA on elevated volume.
Invalidation: a daily close below the MA with conviction.
The MA as Resistance (Breakdown Retest)
The inverse of the pullback setup. Price breaks below a key MA, sells off, then rallies back to test it from below. The former support becomes resistance.
Watch for price to stall, form a bearish candle pattern, and roll over near the MA. Volume contraction on the rally into resistance — followed by expanding volume on the rejection — confirms the setup.
The MA Cluster (Confluence)
When multiple moving averages align at the same area — say the 50-day, 100-day, and a key prior swing high all converge — that zone carries significantly more weight. The more levels pointing to the same area, the more likely price reacts to it.
Stocks365 research across 3,332 signals found that price crossing below the 20 SMA produces a 50.9% win rate over a 10-day holding period. That may sound modest, but context matters: the edge concentrates sharply in crypto markets (66.8% win rate) and weakens in forex (42.5%). Asset class selection is as important as the setup itself. Explore the full dataset at Stocks365 Insights.
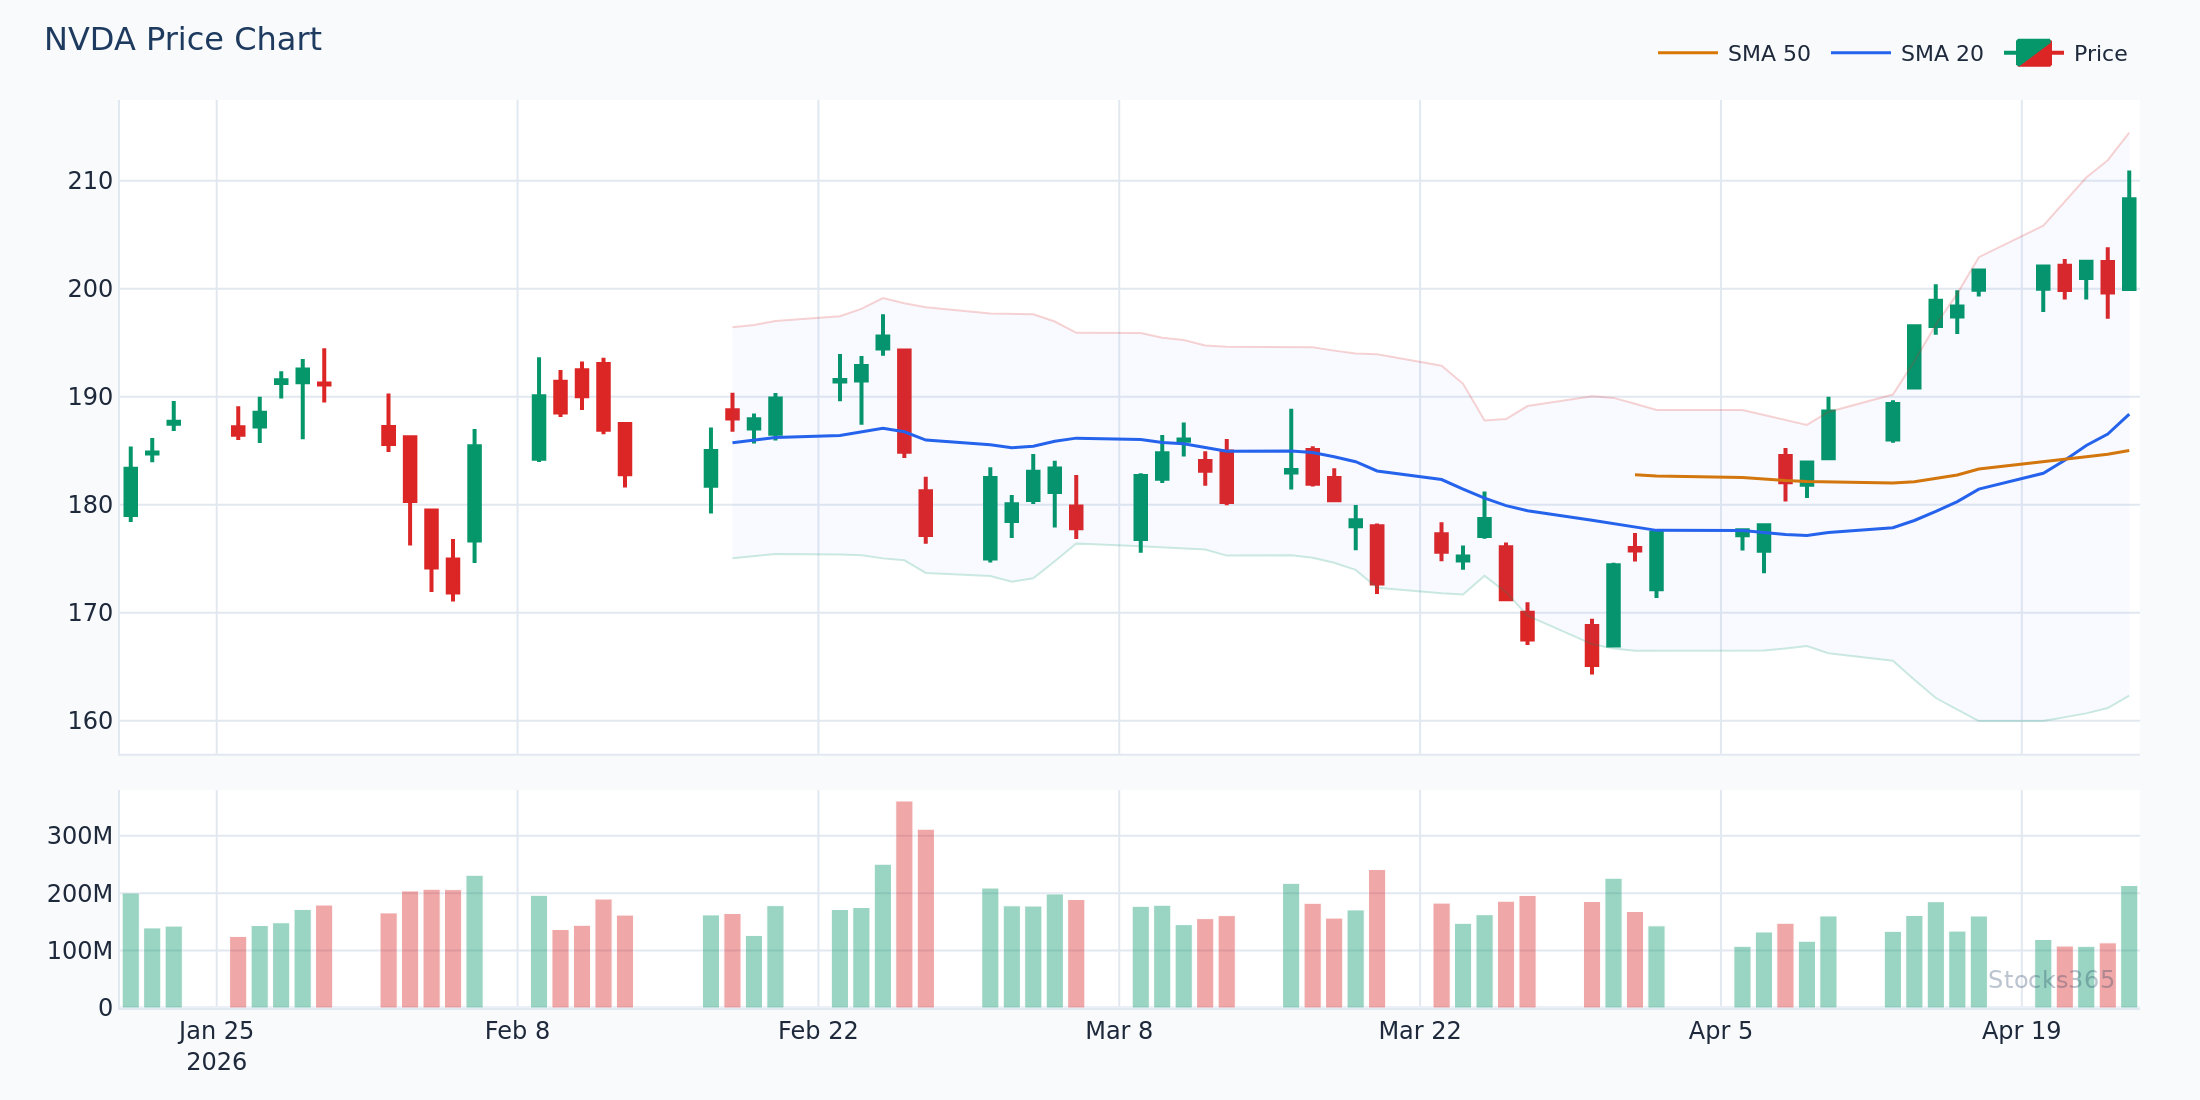
When multiple moving averages compress into a narrow zone like this, the cluster acts as a wall of resistance. Price approaching from below typically needs a significant catalyst — strong earnings, broad market strength — to push through. Without it, the most common outcome is a failed breakout and reversal.
Here's What Most Traders Get Wrong
Most traders treat a touch of the moving average as an automatic trade signal. They see price tag the 50-day MA and immediately buy, assuming a bounce is guaranteed. It isn't.
Moving averages are not brick walls. Price regularly slices through them intraday and closes on the other side. A touch is not a signal. A reaction to the touch is the signal. You need confirmation — a reversal candle, a volume spike showing buyers stepping in, or a secondary indicator (like RSI showing oversold conditions) aligning with the MA test before committing capital.
The discipline to wait for confirmation separates traders who use MAs profitably from those who lose money buying every single touch. The setup isn't the candle that hits the MA. The setup is what happens next.
For traders who want to layer in additional confirmation, RSI overbought and oversold levels pair naturally with MA tests — an oversold RSI reading at a rising 50-day support is a much stronger signal than either indicator alone.
Combining Moving Average Support with RSI Confirmation
Price hitting a key MA is the map. RSI is the compass.
When price pulls back to the 50-day MA in an uptrend and RSI simultaneously drops near or below the 40 level, the confluence of technical evidence strengthens the case for a bounce. Neither signal alone is definitive. Together, they reduce noise significantly.
The pattern to watch: price tags the 20 or 50-day MA, RSI shows a bullish divergence (price makes a lower low, RSI makes a higher low), and a reversal candle forms. That three-part setup — MA support, RSI divergence, candlestick confirmation — is among the highest-probability combinations available to discretionary traders.
For a deeper dive into how hidden divergences signal reversals before they happen, see our guide on hidden RSI divergence.
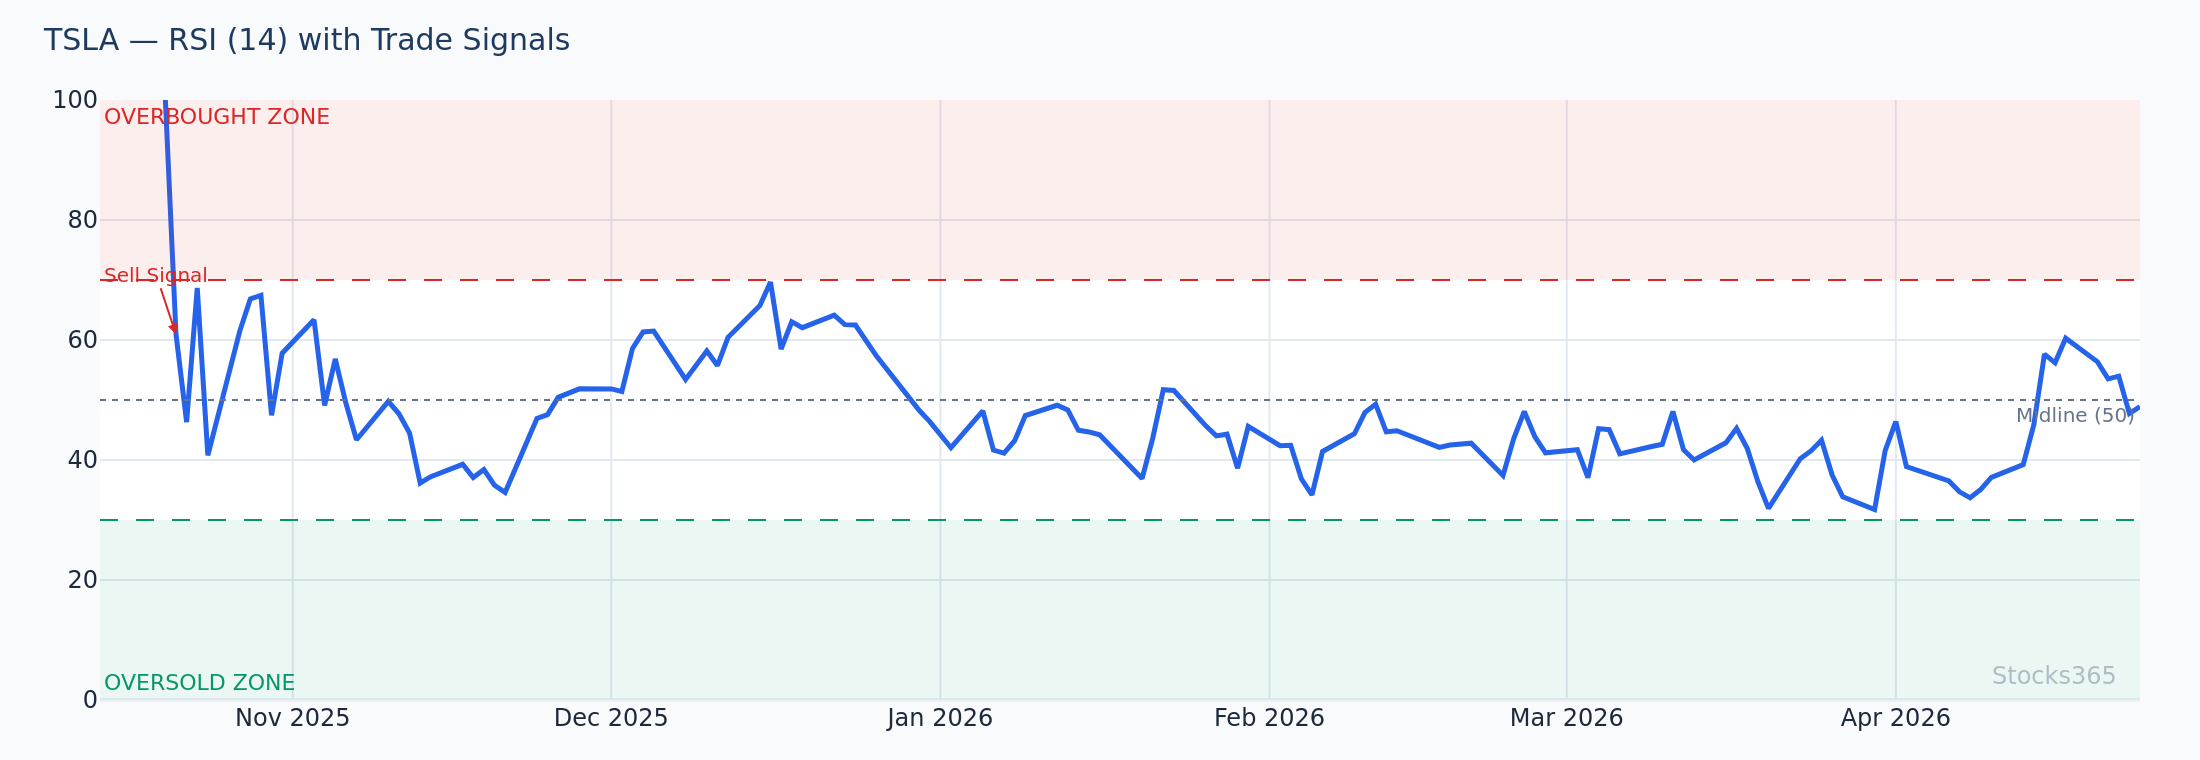
This chart shows RSI making a higher low as price retests the 50-day SMA at a lower point — classic bullish divergence at a key support level. The RSI pattern suggests selling momentum is fading even as price tests support. The trade thesis is confirmed when both price closes back above the MA and RSI crosses back above its midline.
Exponential vs. Simple Moving Average: Which Catches Support Better?
The debate is endless. Here's the practical answer.
Simple Moving Averages (SMA) are what institutions reference most. The 50-day SMA and 200-day SMA are the standard benchmarks in professional analysis. When you're trading support and resistance based on where institutions cluster orders, SMA is the right tool.
Exponential Moving Averages (EMA) weight recent prices more heavily. They respond faster to price changes, which means they catch short-term support and resistance levels earlier — useful for active traders and shorter timeframes.
Practical rule: use SMAs for the 50 and 200-period levels where institutional behavior matters most. Use EMAs for the 20 and shorter-term levels where price responsiveness is more valuable than smoothness.
Our analysis of 3,289 price-crosses-above-SMA-20 signals shows a 48.3% win rate over 10 days, with stocks performing best at 52.3%. The modest edge underscores the importance of not trading every MA cross in isolation — context, confluence, and confirmation matter more than the signal alone. See the full breakdown at Stocks365 Insights.
Timeframe Matters: Aligning MAs Across Timeframes
A 200-day MA on the daily chart carries far more weight than a 200-period MA on a 5-minute chart. The principle is the same, but the significance scales with the timeframe.
Multi-timeframe alignment is powerful. When the weekly chart shows price bouncing off the 50-week MA, and the daily chart simultaneously shows price holding above its 20-day MA, and the 4-hour chart is forming a base — all three timeframes pointing in the same direction provides an edge that no single-timeframe analysis can match.
The practical workflow: identify the key MA levels on the higher timeframe first. Then drop to the lower timeframe to find the precise entry setup. Higher-timeframe support defines the trade thesis. Lower-timeframe confirmation defines the entry.
What to Watch For
- First touch of a rising 200-day SMA after a prolonged uptrend: When a stock or index tests its 200-day SMA for the first time after an extended advance — without breaking below it — and forms a reversal candle on above-average volume, the probability of a multi-session bounce is significantly elevated.
- Failed breakout above a declining MA followed by close below: Watch for price that spikes above a declining 50-day or 200-day MA intraday but closes back below it. That failed breakout pattern — especially with an RSI reading above 60 rolling over — often precedes accelerated selling.
- MA cluster compression on weekly charts: When the 20, 50, and 100-week MAs converge within a tight band, the resulting explosion move — when price resolves out of that zone — tends to be larger than average. The compression acts as a coiled spring. Direction is confirmed by the first weekly close decisively outside the cluster.
- Crypto bounces off the 20-day SMA in established uptrends: Given the elevated win rate for crypto across short-term MA signals, pullbacks to the 20-day SMA during confirmed uptrends in major crypto assets represent higher-probability long setups than the same pattern in forex.
- RSI near 40 at a rising 50-day MA: In bull market conditions, RSI dipping to the 35–45 zone simultaneously with a price test of the 50-day SMA is a high-confluence setup. Learn how to integrate RSI with price structure for complete setups.
How Stocks365 Uses This
Stocks365 Trust Score Integration
Moving average position and price behavior relative to key MAs is one of 12+ technical factors that feed into the Stocks365 Trust Score. When price holds above a rising 50-day or 200-day SMA, it contributes positively to the regime scoring component — helping classify whether a given instrument is in a bullish, bearish, or transitional phase.
The Trust Score also weighs MA alignment across timeframes. A stock where the price sits above its 20, 50, and 200-day MAs receives stronger regime confirmation than one where the MAs are conflicting. This multi-layer assessment means the signals delivered on the Stocks365 signals dashboard aren't based on a single indicator — they reflect a consensus of technical evidence, with MA structure as one of the foundation inputs.
You can see this in action by reviewing live signal cards for individual stocks. For example, the AAPL signal page shows current MA positioning alongside the full Trust Score breakdown, giving you an immediate read on where moving average support and resistance sits relative to current price action.
Key Takeaways
- Moving averages create dynamic support and resistance because of collective market behavior — millions of traders and algorithms anchor decisions to the same levels.
- The 20, 50, and 200-period MAs carry the most weight because they're the most widely watched. Volume and close price relative to these levels define meaningful signals.
- A touch of the MA is not the signal — the reaction to the touch is. Wait for a reversal candle, volume confirmation, or secondary indicator alignment before entering.
- Former support becomes resistance after a breakdown. The retest of a broken MA from below is one of the cleanest short-selling setups available.
- Multi-timeframe confluence multiplies edge. Higher-timeframe MA support defines the thesis; lower-timeframe confirmation defines the entry.
- Combining MA tests with RSI readings — especially divergence signals — significantly improves setup quality over using either indicator in isolation.
- Asset class matters. MA-based signals perform differently across stocks, crypto, and forex — knowing where each setup has the highest historical edge is part of the strategy.