
Moving Average Bounce Strategy: How to Trade It With Precision
The moving average bounce strategy is one of the oldest setups in technical trading. It's also one of the most misunderstood. Price pulls back to a key moving average, taps it, and launches in the direction of the trend. Clean. Repeatable. Profitable — when you execute it correctly.
But here's the problem: most traders enter too early, exit too late, and confuse a bounce with a breakdown.
Stocks365 backtested 3,332 signals across multiple asset classes using the SMA 20 as the core bounce level, and found a 50.9% win rate with a profit factor of 1.06 over a 10-day holding period. That edge gets dramatically sharper — hitting 66.8% in crypto — when you layer in the right filters. Context is everything.
This guide covers the exact entry rules, exit rules, confirmation tools, and common mistakes that separate profitable bounce traders from the majority who give their gains back.
What Is the Moving Average Bounce Strategy?
A moving average bounce occurs when price approaches a moving average from above (in an uptrend) or from below (in a downtrend), makes contact, and then reverses in the prior direction. The moving average acts as dynamic support or resistance — not a fixed line on a chart, but a living level that adjusts with price action.
The most commonly used moving averages for this strategy:
- 20-period SMA (Simple Moving Average) — Ideal for short-term swings and momentum plays
- 50-period SMA — Preferred for intermediate trend trades
- 200-period SMA — The defining line for long-term institutional interest
- 21-period EMA (Exponential Moving Average) — Responds faster to recent price, popular with growth stock traders
The strategy works across timeframes. Day traders use 5-minute and 15-minute charts. Swing traders focus on daily and weekly. The rules don't change — only the holding period does.
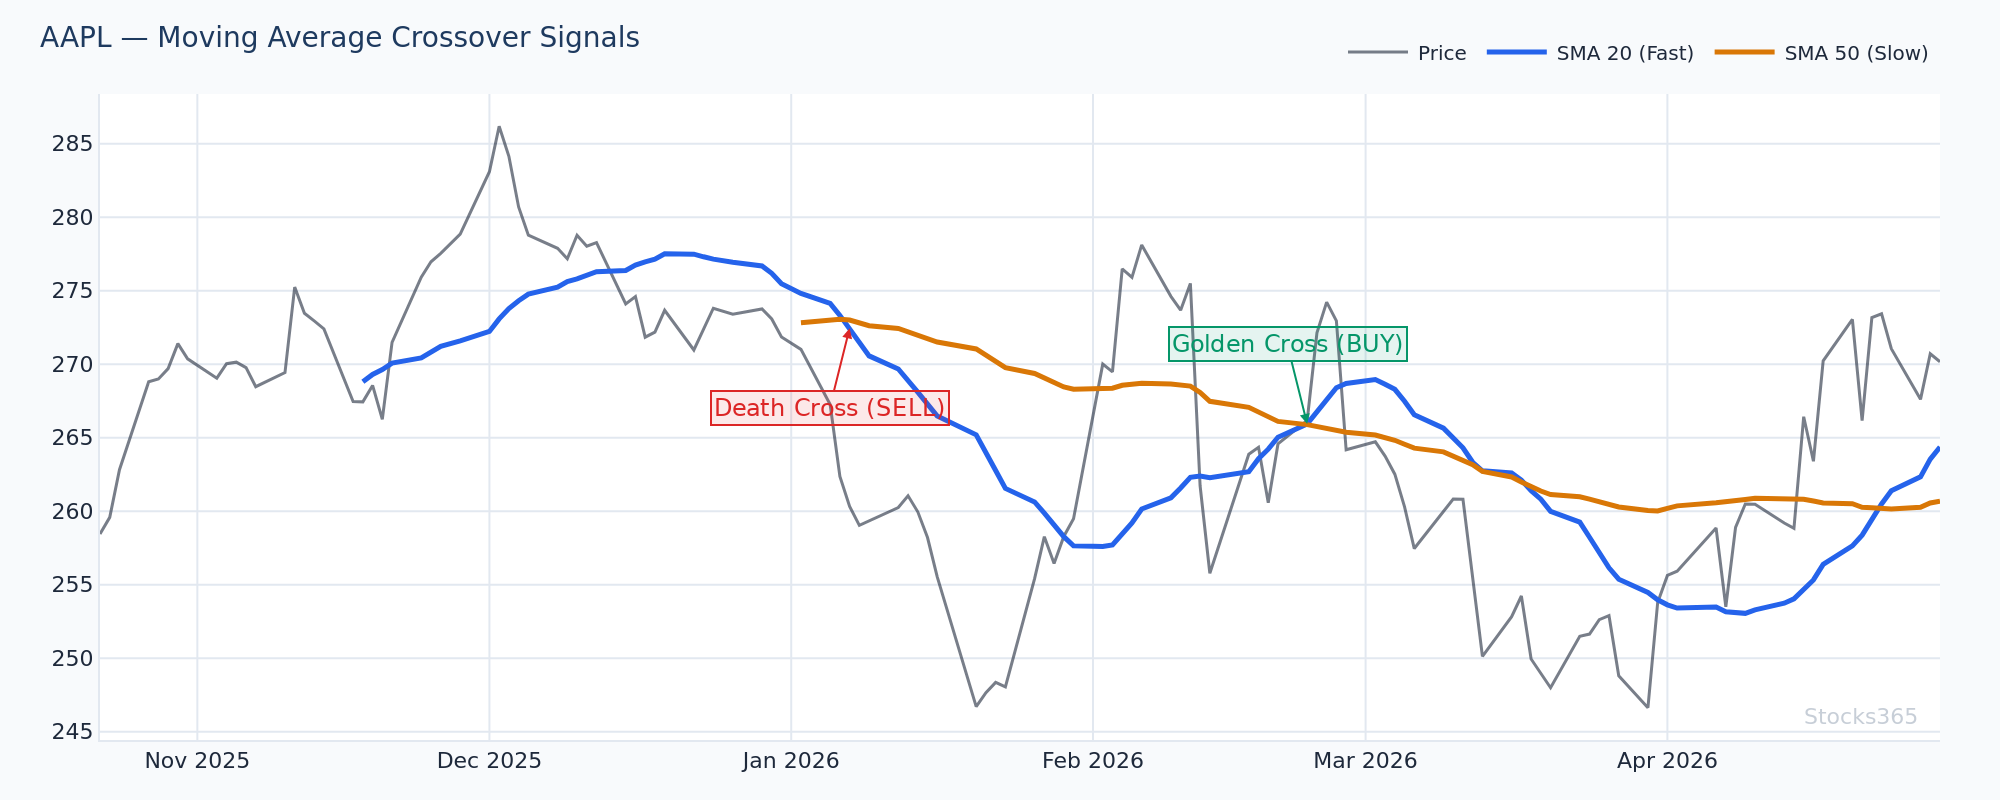
This chart shows price pulling back to touch the 20-SMA after a sustained move higher. When the next candle closes back above the moving average with increased volume, the bounce pattern is confirmed. Watch for a failed bounce — where price closes below the MA — as an early warning that the trend may be reversing rather than pausing.
Why Moving Average Bounces Work
Moving averages work because the market believes they work. Institutions, algorithms, and retail traders all watch the same levels. When price approaches the 50-SMA on high volume, buyers cluster there. That clustering creates the bounce. It's a self-fulfilling mechanism — and that's not a weakness, it's the edge.
Beyond psychology, moving averages smooth out noise and reflect the underlying trend. A stock consistently bouncing off the 20-SMA is telling you buyers are stepping in early and aggressively. That persistence matters.
Entry Rules: How to Enter a Moving Average Bounce
Step 1 — Confirm the Trend First
Never trade a bounce against the trend. If price is in a clear downtrend — lower highs, lower lows, trading below the 200-SMA — bounces off the 20-SMA are short-covering rallies, not true bounces. You want to enter bounces in the direction of the dominant trend.
Confirm trend direction by checking:
- Price position relative to the 200-SMA (above = bullish, below = bearish)
- Moving average slope — a flat or declining MA weakens the bounce signal
- Higher highs and higher lows on the weekly chart (for daily setups)
Step 2 — Wait for Price to Touch the Moving Average
The setup only exists when price actually tags the MA. Don't anticipate. Don't enter three candles before the touch because you think price is heading there. Wait for the tap.
What counts as a touch? Price moves within one ATR (Average True Range) of the moving average level. A wick that pokes below but closes above the MA is actually a stronger signal than a clean tag — it shows sellers tried and failed.
Step 3 — Look for a Confirmation Candle
This is where most traders get it wrong. They buy the exact moment price touches the moving average. Don't. Wait for a confirming candle that shows buyers are actually defending the level.
Strong confirmation signals include:
- Hammer or pin bar candle — Long lower wick rejecting the MA, closing near the high
- Engulfing candle — Bullish engulf on the second candle after the touch
- Volume surge — Volume 1.5x to 2x average during the bounce candle
- Candle close above the MA — For aggressive entries, wait for the close
Enter on the open of the next candle after confirmation closes, or use a limit order just above the high of the confirmation candle.
This chart illustrates a classic hammer formation at the 50-SMA, with a wick extending below the average and a close near the session high. The pattern signals aggressive buyer defense. The invalidation is straightforward: if the next session opens below the hammer low, the bounce has failed and the setup is off the table.
Step 4 — Layer in RSI Confirmation
The moving average tells you where price is. RSI tells you the momentum behind it. For bounce entries, look for RSI pulling back into the 40–50 zone (not oversold yet) during the MA touch. This sweet spot often produces the highest-quality bounces because momentum hasn't fully exhausted — it's a healthy reset.
If RSI has dropped below 30 during the touch, the pullback is more severe. You can still trade it, but reduce position size. Learn more about reading RSI setups in the RSI overbought and oversold levels guide.
Exit Rules: When to Take Profit and Cut Losses
Profit Targets
The moving average bounce is a momentum trade, not a position trade. Set realistic targets based on recent swing highs, not arbitrary percentages.
Three proven target approaches:
- Prior swing high — The most logical target; price often tests the last high before pausing
- 2:1 reward-to-risk ratio — If your stop is 1 ATR below the MA, target 2 ATR above entry
- Trailing stop — Once price moves 1 ATR in your favor, trail the stop to breakeven and follow price with a 20-period MA on a lower timeframe
Stop Loss Placement
Place your stop below the moving average by at least 0.5–1 ATR. This filters out noise — normal volatility that dips below the MA briefly before reversing. A stop placed exactly at the MA line gets hunted constantly.
The rule is simple: if price closes below the MA (not just wicks through), exit. A close below the level changes the structure of the trade.
Here's what most traders get wrong:
Most traders assume that when price breaks a moving average, the trade is immediately over. In trending markets, price routinely slices through a moving average intraday and closes back above it — especially on volatile days. The edge isn't the moving average itself. It's the daily close relative to the MA. Intraday whipsaws are noise. Candle closes below the MA on above-average volume? That's a real signal. Don't exit on the wick — wait for the close.
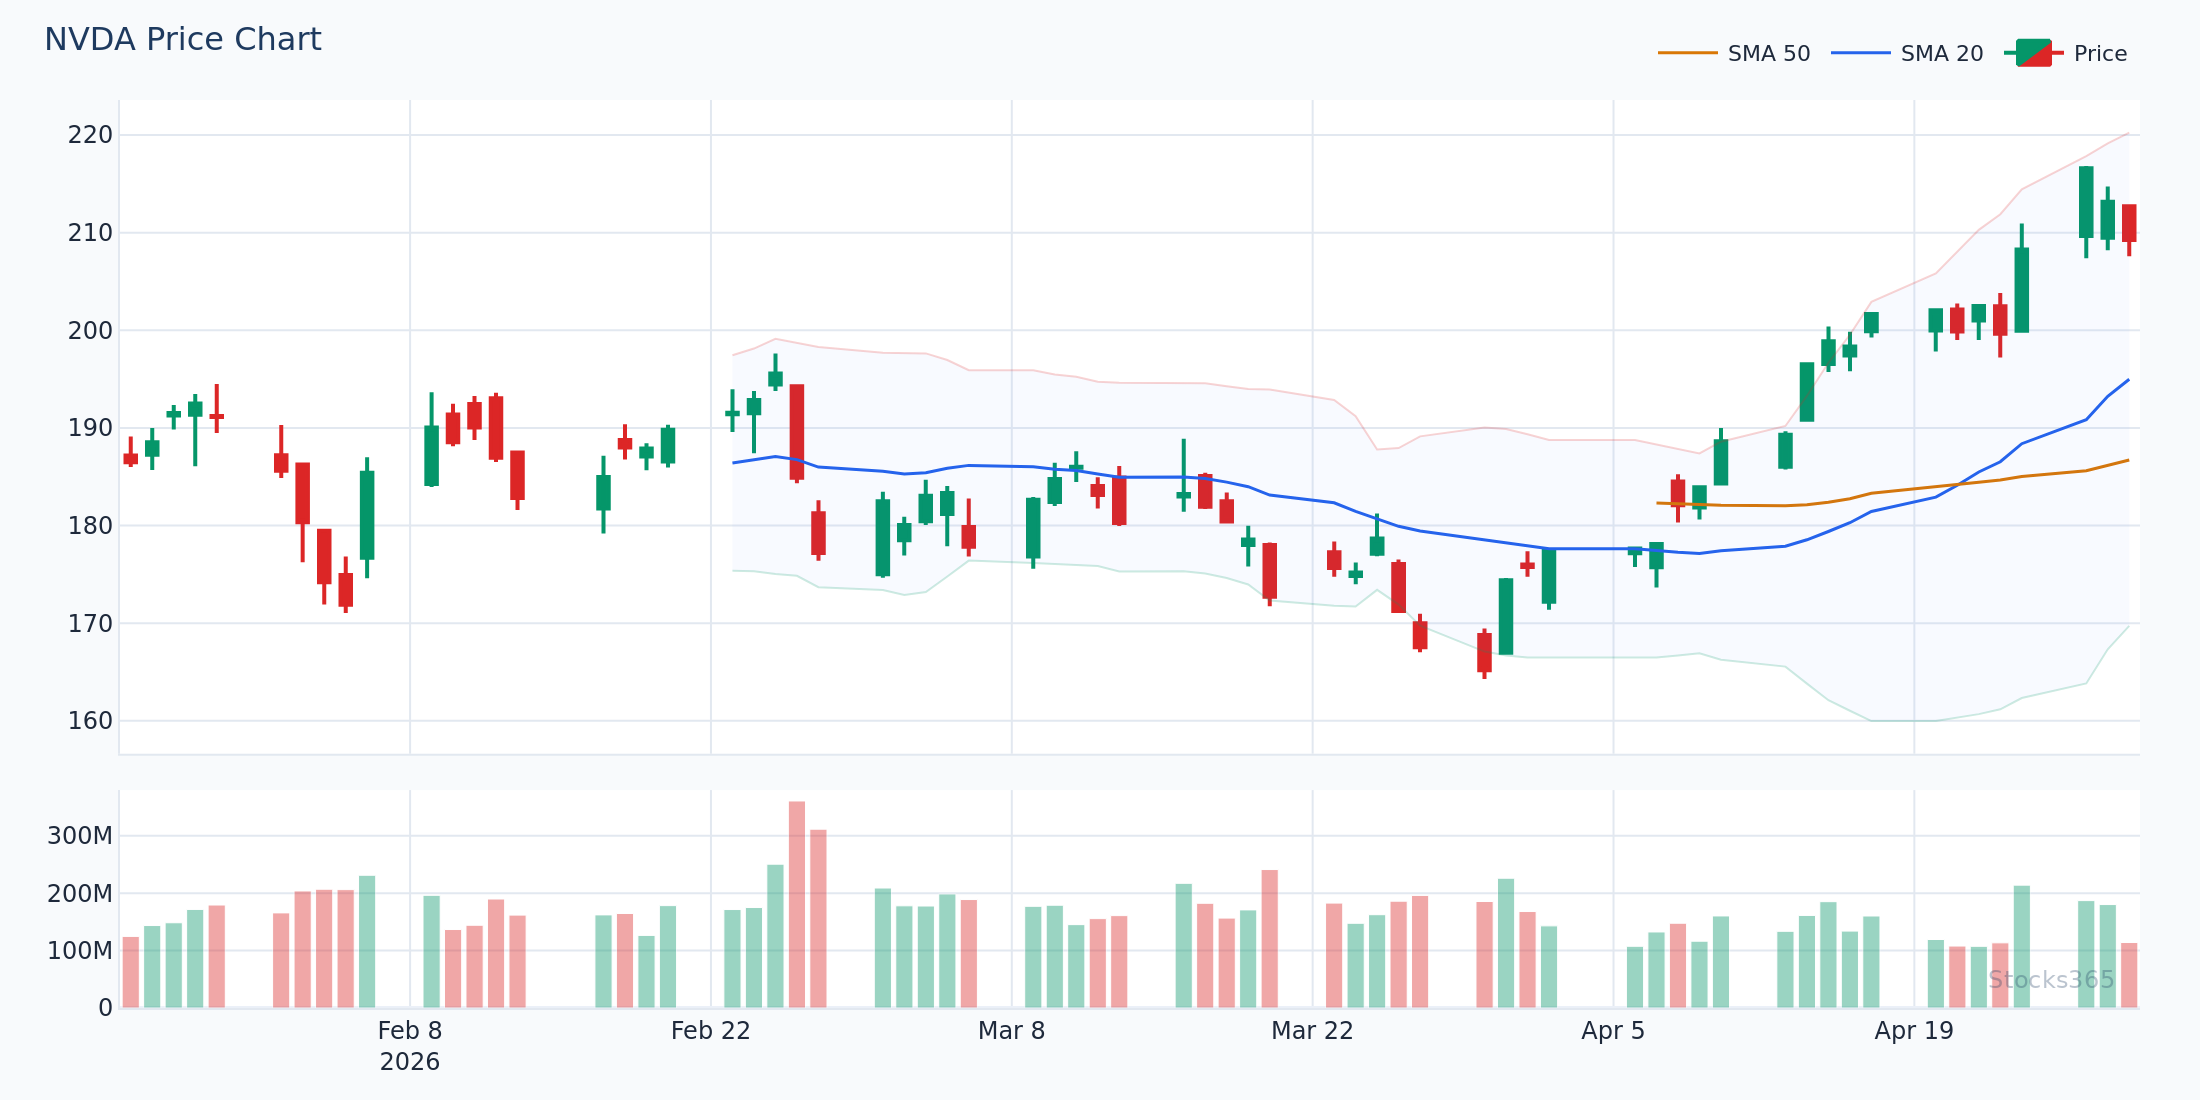
This chart shows the characteristic intraday dip through the 20-SMA — a common trap for traders using tight stops placed exactly at the line. The session closes back above the average, confirming the bounce is intact. Any stop below the candle low (rather than the MA itself) would have kept you in the trade.
The Best Moving Average Bounce Setups by Market Context
Strong Trending Markets
This is where the moving average bounce strategy performs best. When a stock or asset is in a clear, established uptrend with expanding volume and price consistently above the 50 and 200-SMA, every pullback to the 20-SMA is an opportunity.
Look for three consecutive touches of the 20-SMA that all held. The fourth touch has history behind it.
Post-Earnings Consolidation
Stocks that gap up on earnings and then consolidate for 2–4 weeks often set up a perfect 20-SMA bounce. Price compresses, the MA catches up, and the next leg higher begins when price bounces off that freshly rising 20-SMA.
Crypto and the 20-SMA
Our research dashboard shows that crypto delivers the strongest bounce results — 66.8% win rate when price crosses back above the SMA 20 after dipping below it — compared to a 42.5% win rate for forex using the same setup. Crypto's higher volatility means the bounces are harder to hold emotionally, but statistically they're the most reliable. Forex pairs require additional confirmation layers before taking the bounce.
When to Avoid the Bounce Setup
Not every MA touch is a bounce opportunity. Avoid the setup when:
- The moving average is flat or declining — it's no longer acting as dynamic support
- Price has crossed below the MA multiple times in recent sessions (choppy structure)
- Volume is declining as price approaches the MA — no institutional interest
- A major macro event is pending within 24 hours (earnings, Fed decision, CPI print)
- The broader market is in a high-volatility contraction phase
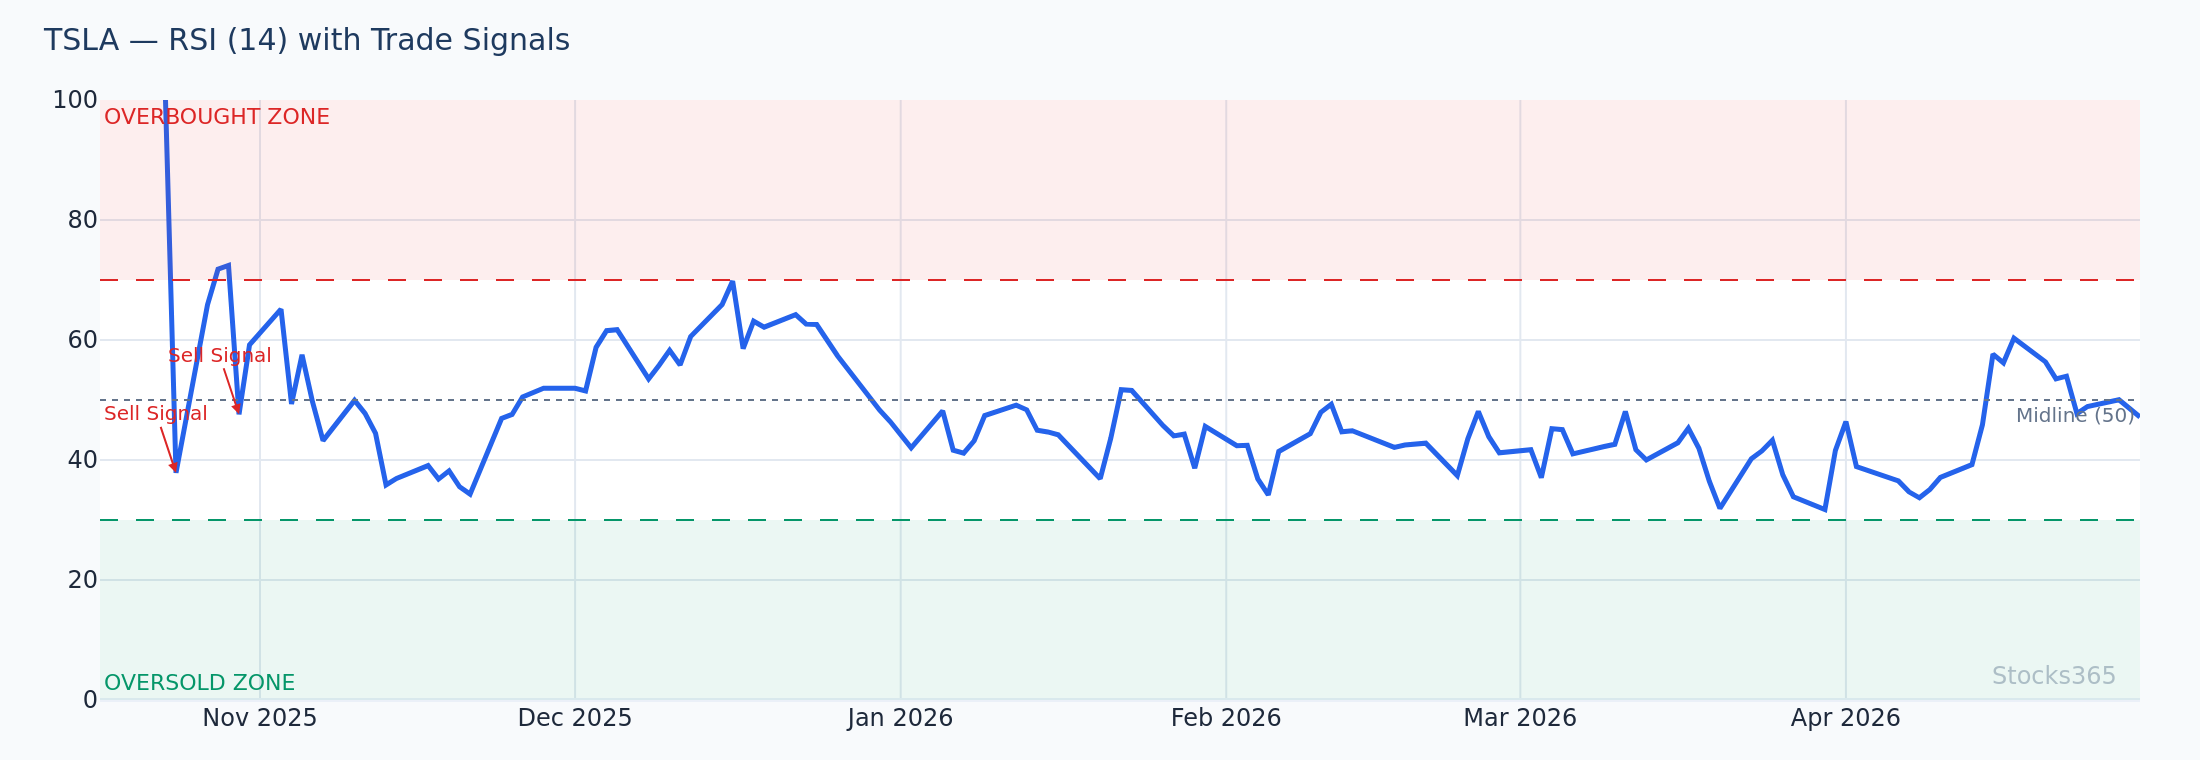
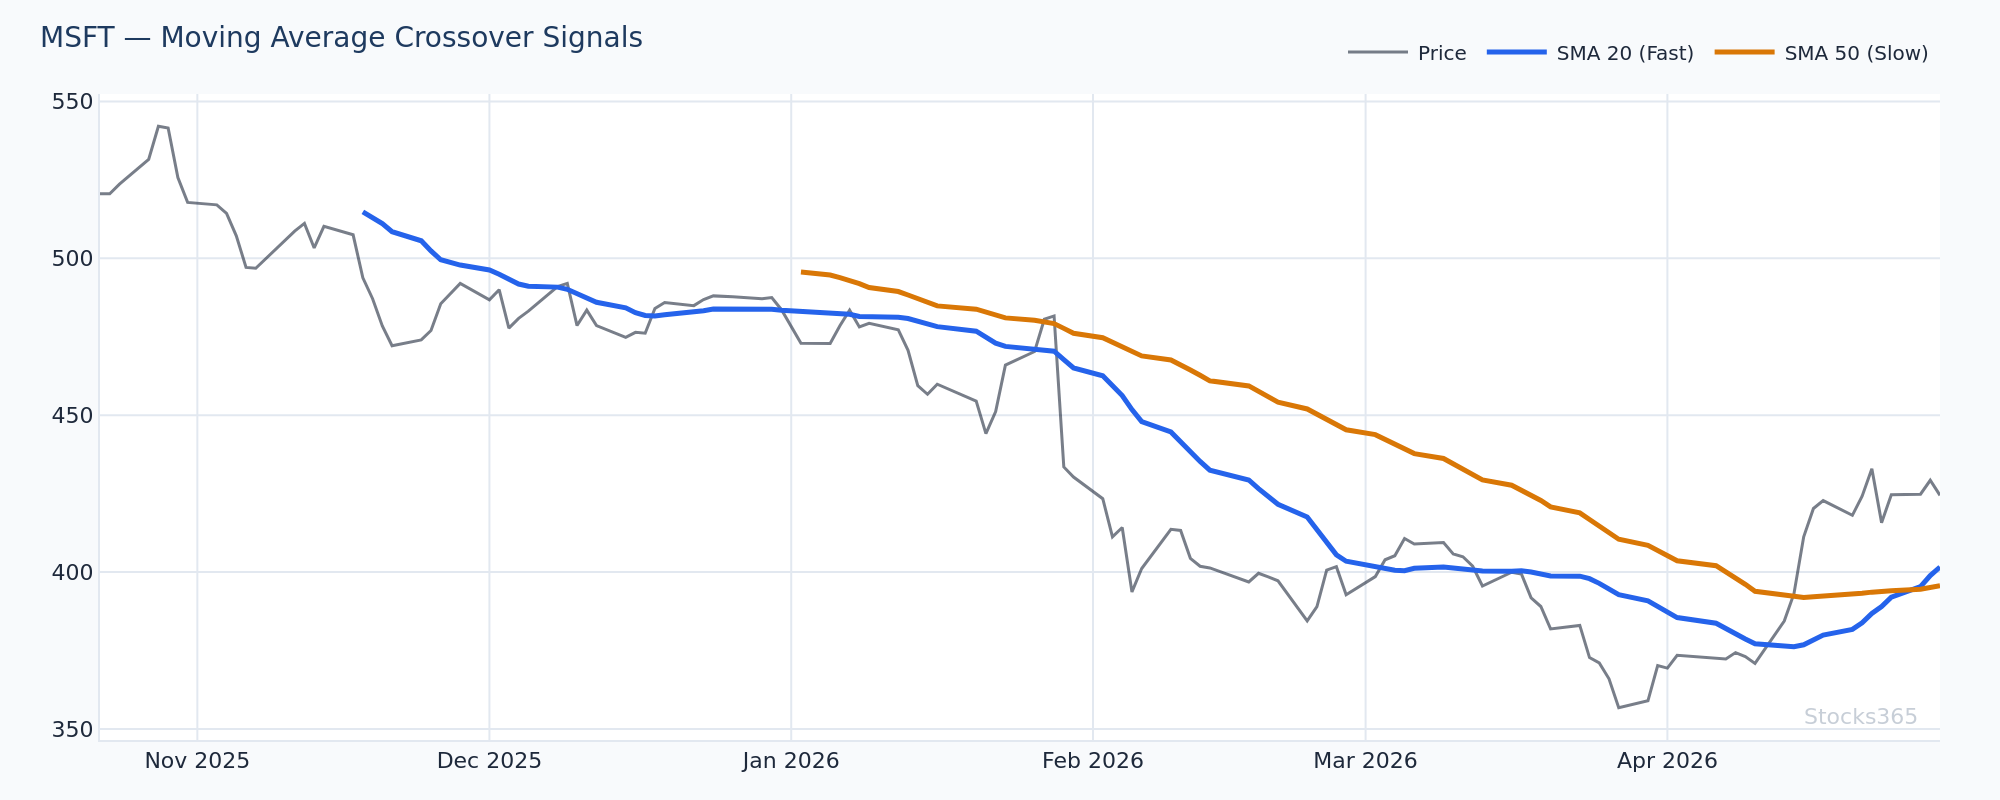
This RSI chart shows momentum cooling to the mid-40s — classic for a healthy trend pullback rather than a trend reversal. When RSI holds above 40 during a moving average touch, it confirms buyers haven't abandoned the trend. An RSI drop through 40 during the same MA test would signal weakening momentum and a reason to wait for further confirmation before entering.
Moving Average Bounce With Multiple Timeframe Confluence
The strongest bounce setups occur when multiple timeframes agree. Call it confluence. When the daily chart shows price touching the 20-SMA in an uptrend, and the weekly chart shows price above a rising 10-week SMA, the probability of a successful bounce increases significantly.
How to use multiple timeframes:
- Higher timeframe — Determine trend direction and the dominant MA level
- Trade timeframe — Identify the MA touch and confirmation candle
- Lower timeframe — Fine-tune entry timing (look for a micro-bounce on the 1H when the daily shows a 20-SMA touch)
Confluence trades have tighter stops and better entries. Single-timeframe setups are lower probability. Always check at least two timeframes before pulling the trigger.
For forex traders applying this approach, the MACD in forex trading guide pairs well with bounce entries — use MACD crossovers on the 4H chart as additional confirmation when trading daily 50-SMA bounces on major pairs.
Combining Moving Average Bounces With RSI Trendlines
One powerful enhancement to the basic bounce setup is drawing trendlines directly on the RSI indicator. When price bounces off a moving average and RSI simultaneously bounces off its own trendline, the signal strength doubles.
This is a more advanced technique. Price touches the 20-SMA. RSI has been making higher lows forming a rising trendline. Both hold simultaneously. That's a high-conviction entry. Explore this in depth in the RSI trendline strategy guide — it complements the moving average bounce approach directly.
Position Sizing and Risk Management
Risk no more than 1–2% of account equity per bounce trade. This isn't a set-and-forget strategy — it's an active trade that requires monitoring. Use the MA as a hard invalidation level.
A simple position sizing formula for bounce trades:
- Identify your stop level (1 ATR below the MA)
- Calculate dollar risk per share (entry price minus stop price)
- Divide maximum dollar risk per trade by dollar risk per share
- That's your share count
Simple. Mechanical. Consistent. Emotion-free sizing is a non-negotiable for this strategy.
What to Watch For
- Rising 20-SMA on a stock making consecutive higher highs — When price pulls back to tag a steeply rising 20-SMA with RSI above 45, that's a textbook bounce setup. The steeper the MA slope, the stronger the trend and the higher the probability of continuation.
- Crypto assets forming hammer candles at the 20-SMA after a 10–15% retracement — Historical bounce win rates in crypto run above 66% in this scenario. Volume confirmation on the reversal candle is the key filter.
- Stocks where the 20-SMA and 50-SMA are converging — When these two MAs are within 1 ATR of each other and price touches both simultaneously, the support cluster is exceptionally strong. Watch for volume expansion as price holds this zone.
- RSI divergence during a moving average touch — If price makes a lower low at the MA but RSI makes a higher low, a bullish divergence is forming. This is a high-conviction bounce signal. Dig into divergence patterns in the RSI divergence guide.
- Post-consolidation breakout retests — When a stock breaks out above a key level, consolidates for 1–2 weeks, and then pulls back to the 20-SMA (which aligns with the breakout level), the bounce has both MA support and a former resistance-turned-support level behind it. That's a double-confluence setup.
How Stocks365 Uses This
How Stocks365 Integrates the Moving Average Bounce Into Its Trust Score
Stocks365's trust score system evaluates each signal across 12+ technical indicators before assigning a confidence rating. Moving average positioning is one of those core inputs. Specifically, the system tracks price distance from the 20, 50, and 200-period SMAs, MA slope, and the number of consecutive MA tests that have held — all as part of the trend regime scoring layer.
When a signal shows price pulling back to a rising 20-SMA while other indicators (RSI position, volume trend, MACD momentum) align, the trust score reflects higher agreement across the system. A bounce signal with 8 out of 12 indicators in agreement carries a materially different weight than one where only price and the MA align. This multi-factor confirmation is why Stocks365's signals filter out the majority of low-quality bounce setups before they ever reach the signals dashboard.
You can see this in action by pulling up any individual signal — for example, AAPL's signal page shows real-time MA positioning alongside the full trust score breakdown.
Key Takeaways
- The moving average bounce strategy enters trades when price pulls back to a key MA in the direction of the dominant trend
- Confirmation candles — hammers, engulfing patterns, volume surges — are required before entry. Never buy the touch alone.
- Stops go below the MA by 0.5–1 ATR to filter noise. Intraday wicks below the MA are not exits — closes below the MA are.
- Crypto produces the highest bounce win rates (66.8% in Stocks365 backtests). Forex requires more confirmation and delivers the weakest standalone results.
- RSI in the 40–50 zone during an MA touch signals a healthy pullback — the highest probability setup
- Multiple timeframe confluence dramatically improves setup quality. Always check the higher timeframe trend before entering on the lower timeframe bounce.
- Position size based on distance to stop, not gut feel. 1–2% account risk per trade, maximum.
| # | Strategy | Type | Win Rate | Sharpe | PF | N | Status |
|---|---|---|---|---|---|---|---|
| #1 | VWAP Mean Reversion Long | mean_reversion | 53.6% | 0.72 | 1.57 | 7,147 | EDGE |
| #2 | RSI Oversold Bounce | mean_reversion | 56.9% | 0.68 | 1.61 | 2,153 | EDGE |
| #3 | Bollinger Lower Band Touch | mean_reversion | 58.1% | 0.65 | 1.55 | 2,798 | EDGE |
| #4 | Williams %R Oversold | mean_reversion | 54.0% | 0.32 | 1.24 | 11,744 | TEST |
| #5 | Stochastic Oversold | mean_reversion | 54.7% | 0.32 | 1.24 | 8,204 | TEST |