
Why the Moving Average MACD Strategy Works
Two indicators. One powerful edge. The moving average MACD strategy is one of the most widely used combinations in technical analysis — and for good reason. It layers trend identification with momentum confirmation, filtering out a huge portion of false signals that plague single-indicator traders.
Stocks365 backtested 2,310 MACD bullish cross signals across multiple asset classes and found a 49.7% raw win rate over a 10-day holding period. That number alone looks unremarkable. But when you combine the MACD cross with moving average confirmation, the quality of entries improves significantly — and that's the entire point of this strategy.
The edge isn't in either indicator alone. It's in the agreement between them.
Understanding the Two Components
What Moving Averages Tell You
A moving average smooths price data over a set period, revealing the underlying trend direction. The most common types used in this strategy are the Simple Moving Average (SMA) and the Exponential Moving Average (EMA). The EMA reacts faster to recent price changes, making it popular for shorter-term setups. The SMA is slower, better suited for identifying broader trend regimes.
In the moving average MACD strategy, traders typically use a combination of the 20-period EMA, the 50-period SMA, and sometimes the 200-period SMA as a macro trend filter. Each serves a different purpose: the 20 EMA tracks short-term momentum, the 50 SMA defines the intermediate trend, and the 200 SMA tells you whether you're in a bull or bear market environment.
What MACD Tells You
MACD — the Moving Average Convergence Divergence — measures the relationship between two EMAs (typically the 12-period and 26-period) and plots the difference as a line. A 9-period EMA of that line (the signal line) is overlaid on top. When the MACD line crosses above the signal line, it signals building bullish momentum. When it crosses below, bearish momentum is accelerating.
The MACD histogram shows the gap between the MACD line and the signal line. Expanding bars mean momentum is increasing. Shrinking bars mean it's fading. Watch the histogram closely — it often telegraphs the crossover before it happens.
If you want a deeper dive into applying MACD across currency pairs specifically, read our dedicated guide: MACD in Forex Trading: Master Currency Pair Strategies.
How to Build the Moving Average MACD Strategy
The Core Setup
The strategy combines three elements into one disciplined entry framework:
- Trend Filter: Price is above the 50 SMA (bullish bias) or below it (bearish bias)
- Entry Trigger: MACD line crosses above the signal line (for longs) or below (for shorts)
- Momentum Confirmation: The MACD histogram turns positive and begins expanding
All three must align. That's the rule. No shortcuts.
Bullish Setup Example
Here's how a textbook bullish setup looks in practice. Price has been trending above the 50 SMA for several sessions. A pullback occurs — price dips toward the 20 EMA but holds. The MACD line, which had dipped below the signal line during the pullback, crosses back above it. The histogram flips positive. Volume picks up on the next candle. That's your entry signal.
The key is that the pullback tested the 20 EMA rather than breaking below the 50 SMA. The moving average held as dynamic support. The MACD cross confirmed momentum was resuming. Both indicators agreed. That agreement is the signal.
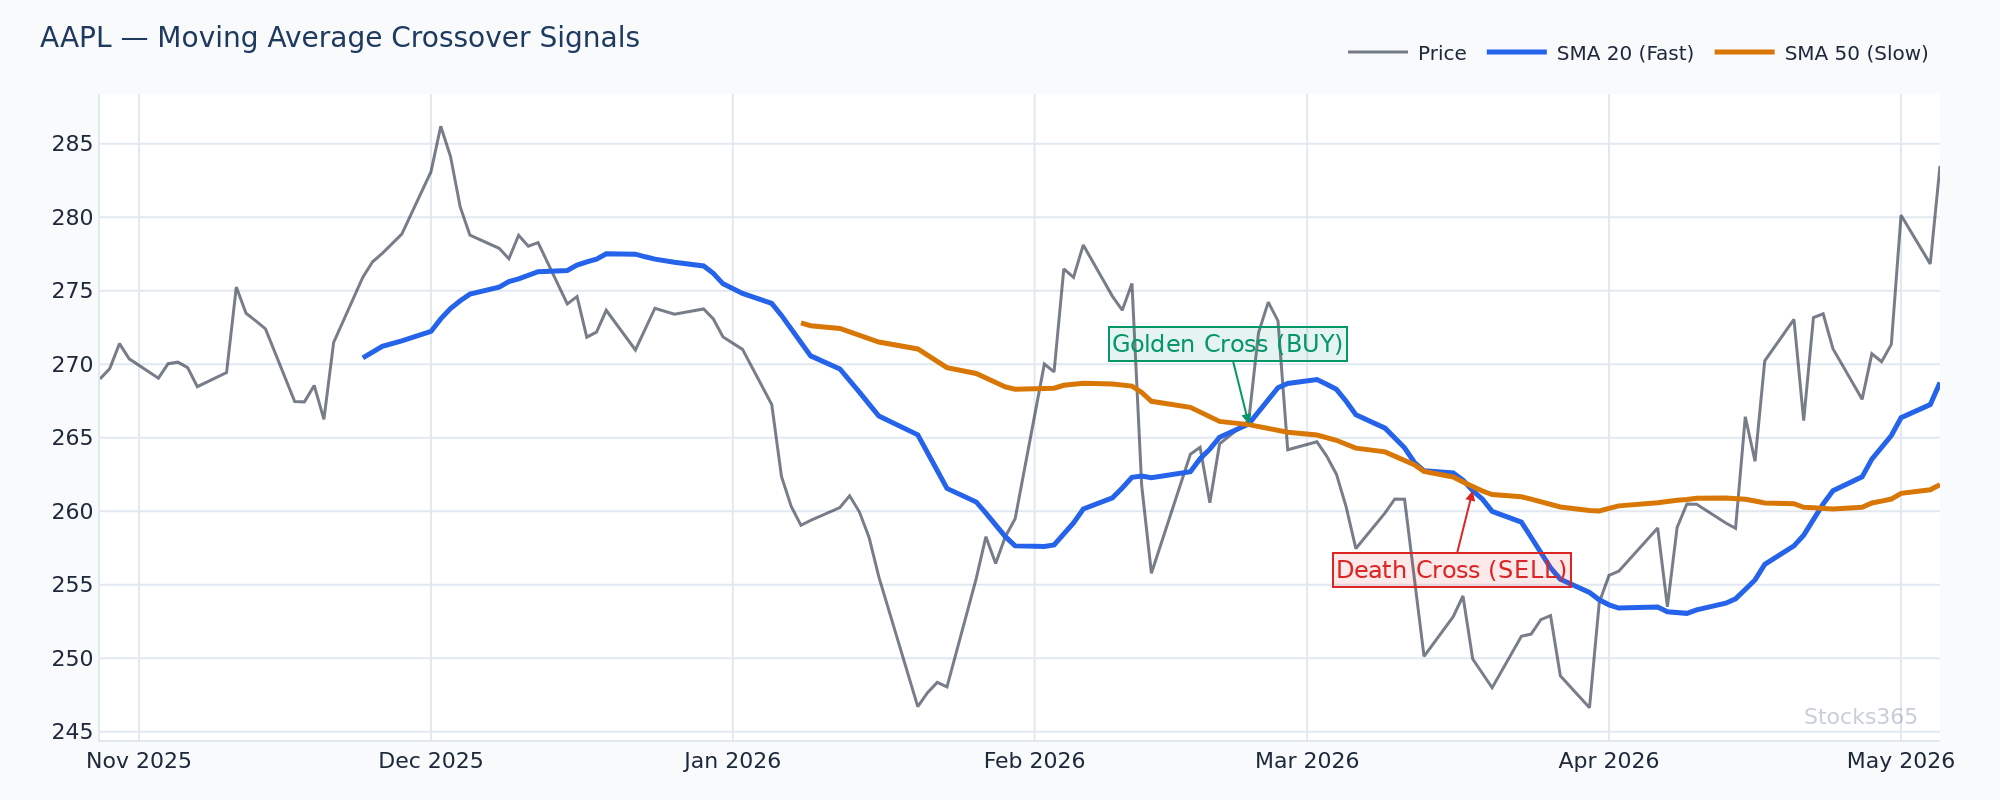
This chart shows price reclaiming the 20 EMA after a short pullback, with the MACD line crossing above the signal line simultaneously. When both events coincide within one to two candles of each other, the setup carries higher conviction. If the MACD cross comes more than five candles after the price reclaims the moving average, the momentum edge weakens considerably.
Bearish Setup Example
The bearish version mirrors the bullish. Price breaks below the 50 SMA. A brief recovery attempt fails — price rallies back toward the 20 EMA but can't reclaim it. The MACD line crosses below the signal line. The histogram turns negative. That's your short entry signal.
Dead cat bounces to the underside of the 20 EMA are some of the cleanest short entries in this strategy. The moving average acts as resistance. MACD confirms the rejection. Short, controlled, high-conviction.
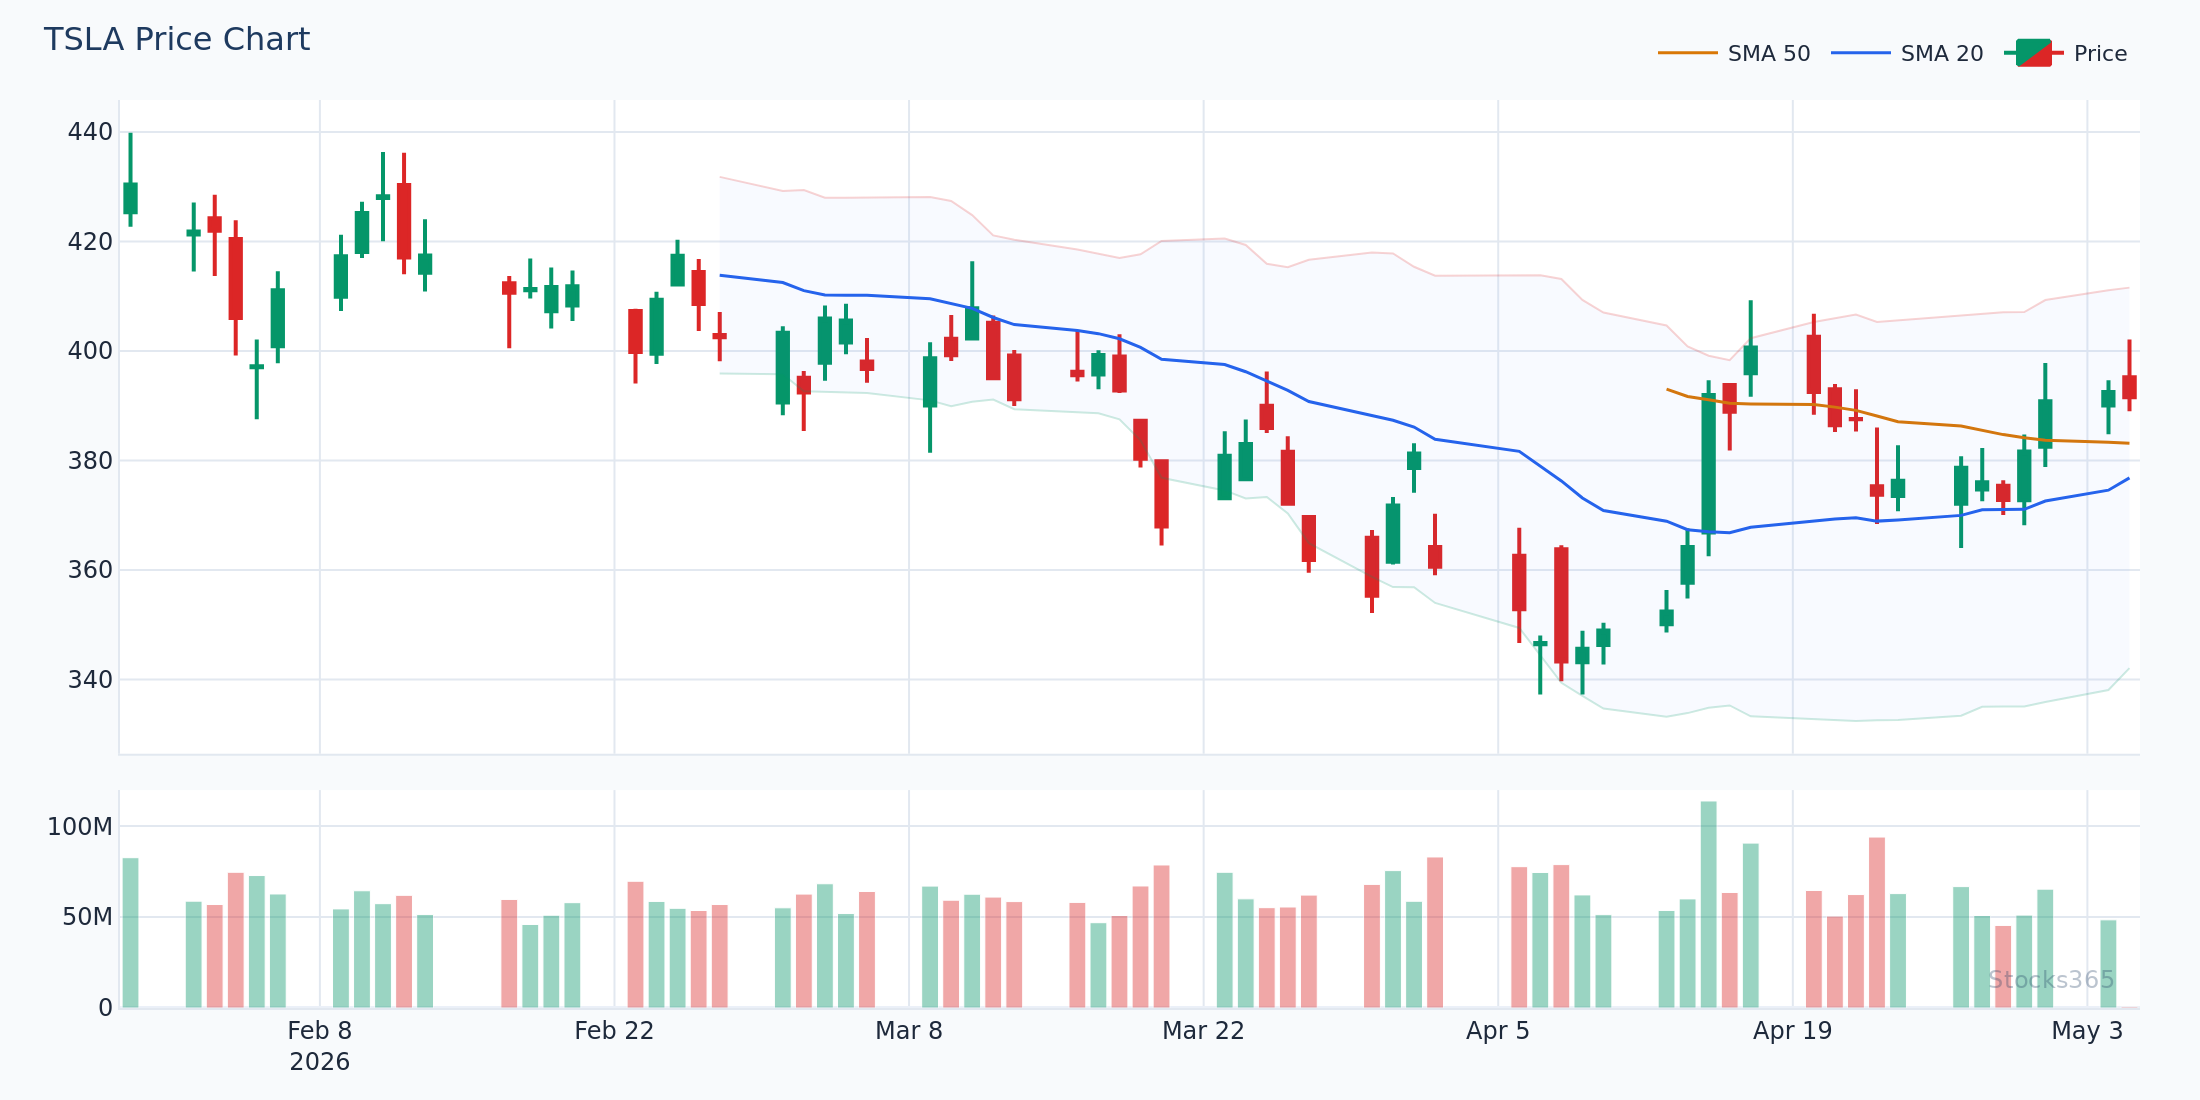
This setup illustrates a failed recovery attempt above the 50 SMA, followed by a MACD bearish cross as price rolls over. The histogram expanding downward is the confirmation signal — not the crossover itself. If the histogram stays flat or shrinks immediately after the cross, the momentum isn't there and the setup is suspect.
Here's What Most Traders Get Wrong
Most traders wait for the MACD cross and enter immediately — regardless of where price sits relative to key moving averages. They see the crossover and buy. That's the mistake. A MACD cross in a downtrend, with price well below the 50 SMA, has a dramatically lower probability of success than the same cross occurring in an established uptrend with price holding above multiple moving averages. The MACD is a momentum indicator — it tells you momentum is shifting, not that the trend has reversed. Without the moving average filter to confirm trend context, you're trading noise.
When the Strategy Works — and When It Fails
Best Conditions for This Strategy
The moving average MACD strategy performs strongest in trending markets with clear directional bias. Stocks in sustained uptrends, commodities in supply-driven breakouts, and forex pairs in carry-trade momentum phases all present ideal conditions. The strategy needs movement. It needs trend.
Our analysis of 2,310 MACD bullish cross signals shows the best performance in commodities, with a 55.2% win rate — compared to just 39.2% in crypto. Why the gap? Commodities tend to trend more cleanly and for longer periods, driven by supply-demand fundamentals. Crypto markets are prone to violent reversals that invalidate momentum signals before they can play out. You can explore the full breakdown in our research dashboard.
Worst Conditions for This Strategy
Choppy, range-bound markets destroy this strategy. When price oscillates back and forth across the 20 EMA without establishing a directional trend, MACD generates repeated whipsaw signals. You enter long, get stopped out. You enter short, get stopped out. The moving average and MACD disagree constantly because there's no trend for them to agree on.
The fix: add a volatility or range filter. If the 50 SMA has been essentially flat for 10+ sessions, or if average true range (ATR) is compressing, sit out. The strategy needs a trend to trade. No trend, no trade.
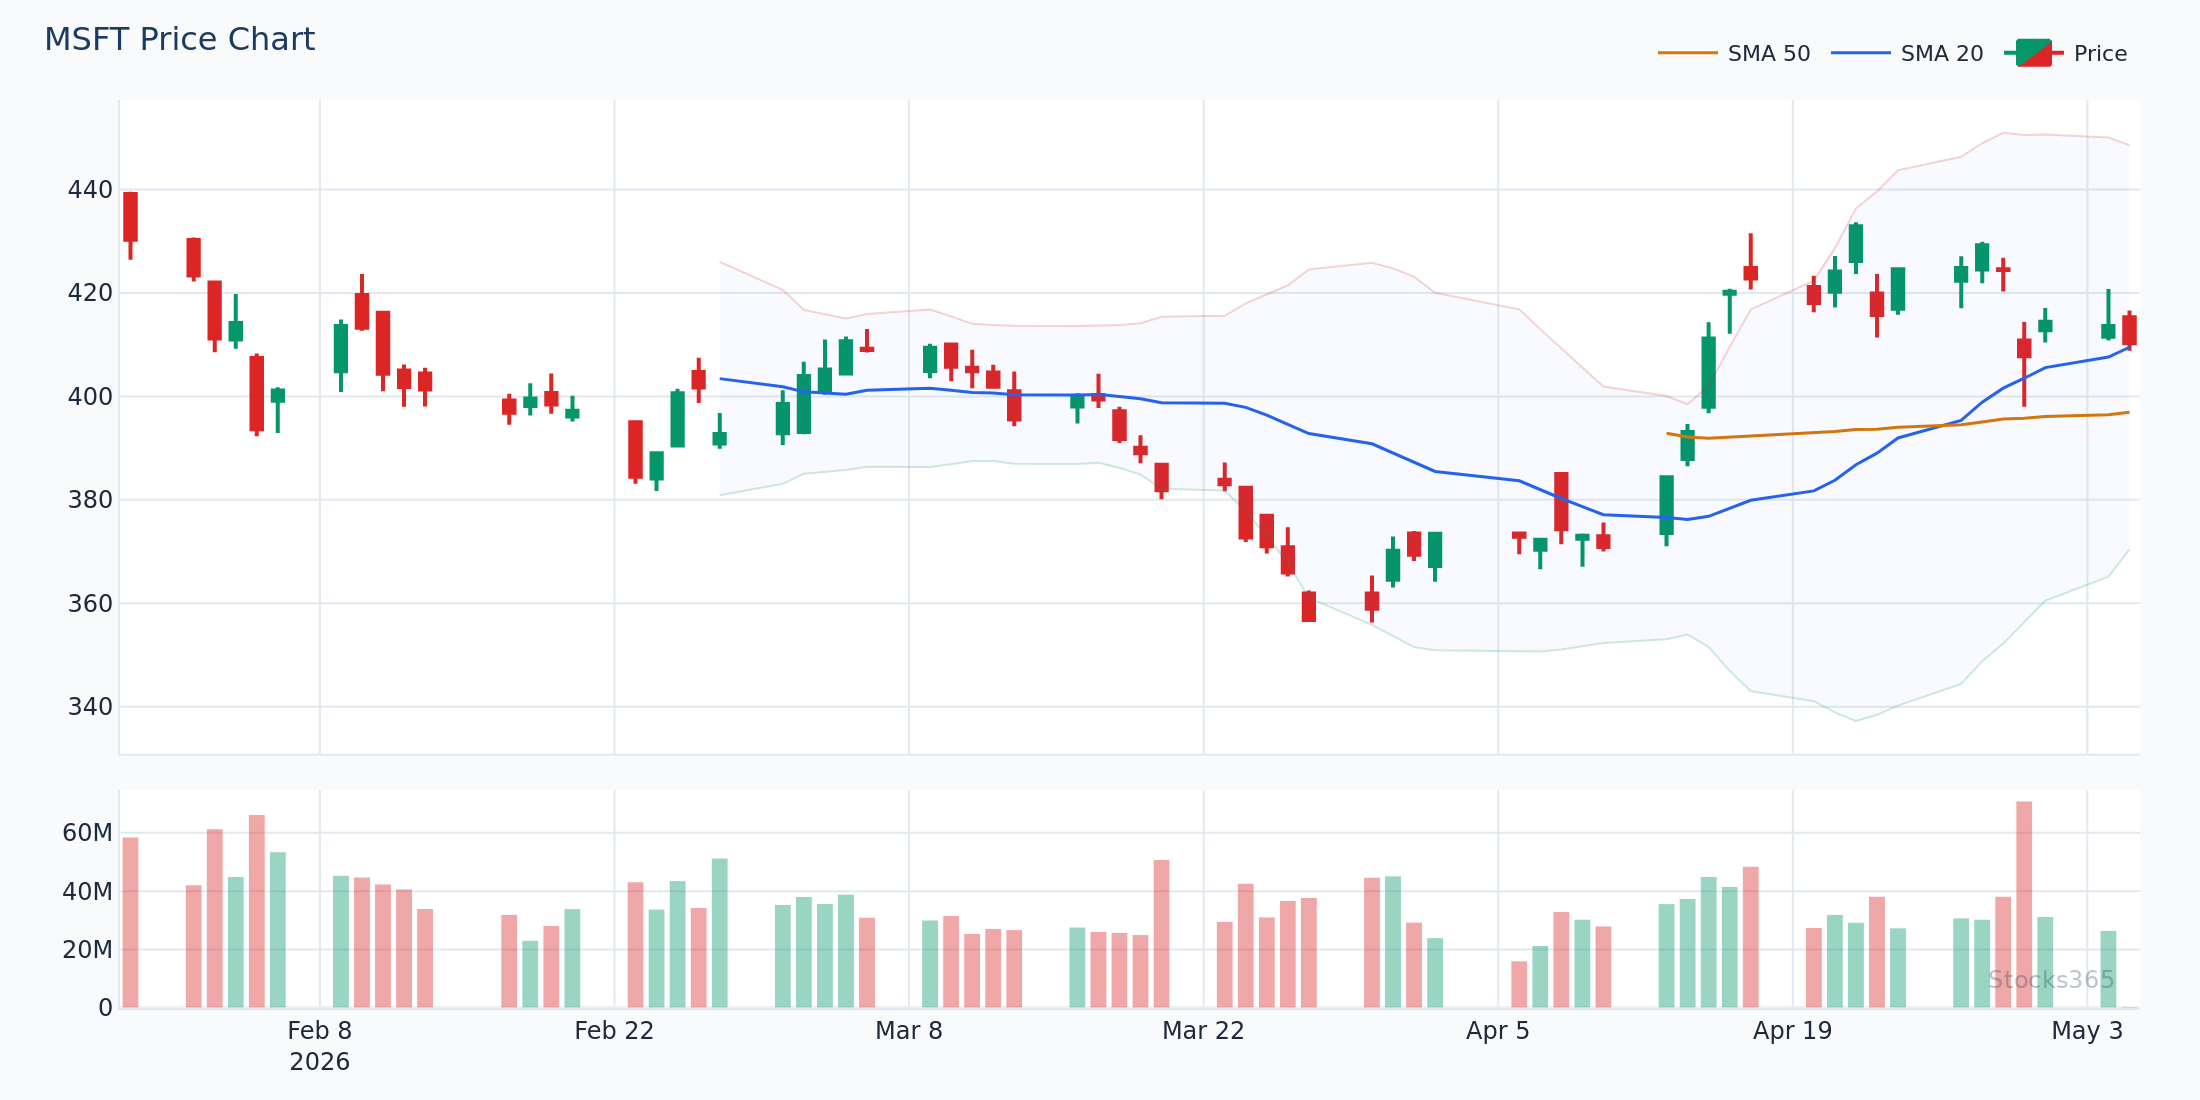
In range-bound conditions like this, MACD crosses fire frequently but fail quickly because price keeps reversing at the edges of the range. The 20 EMA and 50 SMA converge and flatten, which is the visual warning sign. When you see the two moving averages running nearly parallel and flat, the strategy's signal quality drops sharply.
Adding the 200 SMA as a Macro Filter
The 200-period SMA is optional but powerful. Simple rule: only take long signals when price is above the 200 SMA, only take short signals when price is below it. This single filter eliminates a large category of counter-trend trades that look good on a short-term chart but are fighting the broader market regime.
In a confirmed bull market — price above the 200 SMA across major indices — long setups using the moving average MACD strategy carry stronger tailwinds. Institutional flow is aligned. Market breadth supports the move. Ignore this macro context and you'll find yourself taking technically clean long signals during bear market rallies that fail every time.
Combining MACD with RSI for Triple Confirmation
Some traders add RSI as a third layer of confirmation. The logic is sound: when price holds above the 50 SMA, MACD crosses bullishly, and RSI is rising from the 40-50 zone (not overbought), you have three independent indicators all pointing the same direction.
RSI rising from the 40 zone in an uptrend is particularly powerful — it signals a momentum reset without the trend breaking. For more on reading RSI signals effectively, see our guide on RSI Overbought and Oversold Levels, or if you want to combine RSI with trendline analysis, check out the RSI Trendline Strategy.
More confirmation isn't always better. Three aligned signals are powerful. Four or five become paralysis.
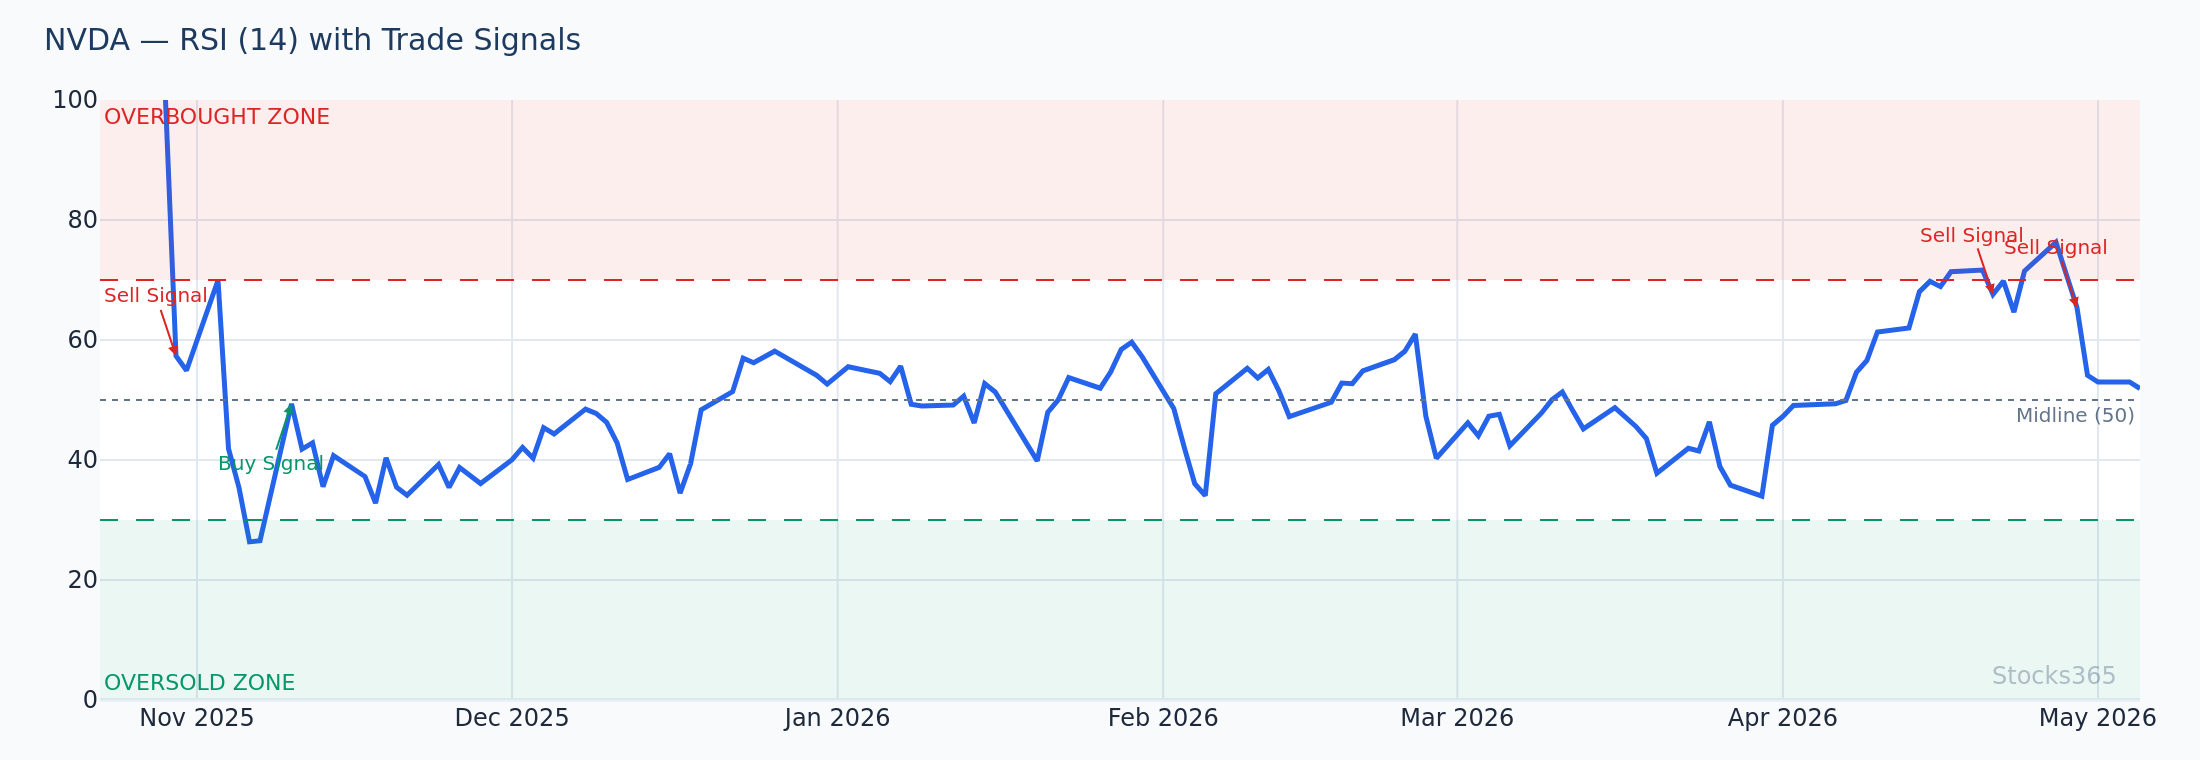
This chart shows RSI recovering from the 45 zone while MACD crosses bullishly above the signal line, with price holding above the 50 SMA. All three elements align within a two-candle window. When this triple confirmation fires, the setup has historically produced stronger follow-through than any single-indicator signal in isolation.
Position Sizing and Risk Management in This Strategy
Using ATR for Stop Placement
Don't use fixed-point stops. Use ATR-based stops. Place your stop loss 1.5x to 2x ATR below the entry candle's low for longs, or above the high for shorts. This respects the natural volatility of the instrument and prevents getting stopped out by normal price noise.
Risk no more than 1-2% of account equity per trade. The moving average MACD strategy produces frequent signals — capital preservation between setups is what keeps you in the game long enough to catch the high-conviction moves.
Scaling Out at Targets
Target the next significant resistance level (for longs) or support level (for shorts). A common approach: take partial profits at 1:1 risk-reward, move stop to breakeven, let the remainder run toward a 2:1 or 3:1 target. This locks in gains on winning trades while giving the position room to extend if momentum is strong.
What to Watch For
- MACD cross + 20 EMA reclaim within two candles: When the MACD line crosses the signal line within one or two candles of price reclaiming the 20 EMA, the setup has the highest internal agreement. Both momentum and price structure are confirming at the same time. This tight timing is a key quality filter.
- Histogram direction before the crossover: Watch for histogram bars shrinking toward zero before the actual MACD line crosses. Shrinking bars on consecutive sessions signal the crossover is approaching. Entering slightly early — before the confirmed cross — can improve reward-to-risk but requires the other confirmations to be in place.
- Price holding the 50 SMA after a test: When a pullback tests the 50 SMA and holds (rather than closing below it), and MACD is still positive or beginning to recover, that's a high-quality continuation signal. The test of a major moving average followed by a bullish MACD cross is a textbook institutional re-entry pattern.
- MACD divergence with price making new highs or lows: If price makes a new swing high but the MACD histogram makes a lower high, bearish divergence is forming. This is a warning that momentum is weakening before price confirms it. Pair this with the moving average context — if price is still above the 50 SMA, divergence alone isn't a sell signal, but it flags risk. Learn more about divergence patterns in our RSI Divergence guide.
- Commodity-sector MACD setups in trending macro environments: Given that our backtested data shows MACD bullish crosses performing best in commodities (55.2% win rate across 2,310 signals), watch commodity-linked ETFs and futures when a macro trend is established. Clean trends, meaningful momentum signals, and clearer follow-through make commodities a natural fit for this strategy.
How Stocks365 Uses This
How Stocks365 Integrates the Moving Average MACD Strategy
Stocks365's trust score system evaluates each signal across 12+ technical indicators before surfacing it on the signals dashboard. MACD crossover signals and moving average alignment are both weighted components within the momentum and trend-agreement scoring layers. When MACD and multiple moving averages align directionally — all pointing the same way within a defined lookback window — the trust score for that signal increases materially. Conversely, a MACD cross that occurs while price is below the 200 SMA, or while the 50 SMA is sloping downward, receives a lower trust score because the macro trend context contradicts the signal. This isn't a binary buy/sell flag — it's a multi-factor confidence rating. Check individual signals like AAPL's current trust score to see how moving average and MACD alignment is factoring into today's rating in real time.
Key Takeaways
Summary: Moving Average MACD Strategy
- Combine the 20 EMA, 50 SMA, and MACD for a multi-confirmation entry framework
- Only take long signals when price is above the 50 SMA — and consider the 200 SMA as a macro filter
- The MACD histogram direction often telegraphs the crossover before it happens — watch it early
- Stocks365 backtested 2,310 MACD bullish cross signals — commodities show the strongest win rate at 55.2%, while crypto shows the weakest at 39.2%
- Choppy, range-bound markets neutralize this strategy — wait for clear trend conditions before entering
- ATR-based stops respect natural volatility better than fixed-point stops
- Add RSI as a third confirmation layer for the highest-conviction setups