
SMA vs EMA: The Moving Average Debate That Actually Matters
Every trader faces this choice. Simple Moving Average or Exponential Moving Average — which one belongs on your chart?
The honest answer: both have a place. But knowing when each one works — and why — separates consistent traders from those who constantly second-guess their setups. This guide breaks down the mechanics, the real-world applications, and the specific conditions that make each moving average shine.
What Is a Simple Moving Average (SMA)?
The Simple Moving Average calculates the arithmetic mean of closing prices over a defined period. Every data point carries equal weight. A 20-day SMA adds the last 20 closing prices and divides by 20. Simple. Transparent. Slow to react.
That slowness is both its weakness and its strength.
Because the SMA responds evenly to all price data, it filters out short-term volatility more effectively than its exponential counterpart. On a weekly chart, the 200-SMA acts like bedrock — institutional traders and algorithms monitor it constantly, which creates self-fulfilling support and resistance zones.
Common SMA Periods Used by Professional Traders
- 20-SMA: Short-term trend and mean reversion signals
- 50-SMA: Medium-term trend direction and pullback entries
- 200-SMA: Long-term market regime filter — bull or bear
The 200-SMA is arguably the most-watched line in global markets. When price crosses above it, institutional money tends to flow in. When it breaks below, risk-off sentiment often accelerates.
What Is an Exponential Moving Average (EMA)?
The Exponential Moving Average applies a multiplier that gives more weight to recent prices. The formula front-loads the most current data, making the EMA faster and more reactive than the SMA over the same period.
That speed comes at a cost — more noise.
In fast-moving markets, the EMA hugs price action closely, generating earlier signals. In choppy, sideways markets, that same responsiveness triggers false breakouts. The EMA rewards traders who understand market context. Used blindly, it punishes them.
Common EMA Periods Used by Professional Traders
- 9-EMA: Momentum gauge for intraday and swing traders
- 21-EMA: Short-term trend filter favored in equity markets
- 50-EMA: Medium-term trend, often used alongside the 200-SMA
- 200-EMA: Long-term directional bias, especially in crypto and forex
The 9/21 EMA crossover is one of the most widely used signals in swing trading. When the 9-EMA crosses above the 21-EMA with expanding volume, momentum is accelerating. When it rolls back below, distribution is likely underway.
This chart shows price reclaiming the 20-SMA after a pullback to the 50-SMA, with both moving averages angling upward — a classic continuation setup. When price closes back above the 20-SMA with above-average volume, the trend typically resumes toward the prior high. The setup is invalidated if price closes below the 50-SMA on elevated volume, suggesting a deeper correction is underway.
SMA vs EMA: The Core Differences
Understanding the structural difference makes every other comparison easier.
- Lag: The SMA has more lag than the EMA over the same period. The EMA reacts faster to recent price changes.
- Smoothness: The SMA produces a smoother line. The EMA closely mirrors current price action.
- Signal timing: EMA generates earlier entries and exits. SMA confirms trends more reliably once established.
- False signals: EMA produces more false signals in ranging markets. SMA filters more noise but misses early moves.
- Institutional use: The 200-SMA dominates as a long-term level. EMAs dominate in shorter-term algorithmic systems.
Neither is objectively superior. Context is everything.
When to Use the SMA
The SMA earns its place in specific market conditions. Use it when you need clarity over speed.
Trend Confirmation
In established uptrends, the 50-SMA and 200-SMA act as dynamic support. Price pulling back to and bouncing off the 50-SMA — especially when RSI simultaneously tags the 40-50 zone — creates high-probability continuation setups. For more on pairing moving averages with momentum indicators, see our guide on how to use RSI in trading.
Mean Reversion Trading
The 20-SMA is a popular mean reversion anchor. When price stretches significantly above or below the 20-SMA, reversion toward the average tends to follow — particularly in range-bound equity markets.
Our analysis of 3,332 signals across the Stocks365 platform found that price crossing below the 20-SMA produces a 50.9% win rate with a profit factor of 1.06 over a 10-day holding period. Crypto leads that group at 66.8%, while forex sits at the bottom with just 42.5%. See the full dataset at Stocks365 Insights.
That edge is real but modest. Context matters enormously — a cross below the 20-SMA during a strong uptrend is a very different signal than the same cross during a deteriorating macro environment.
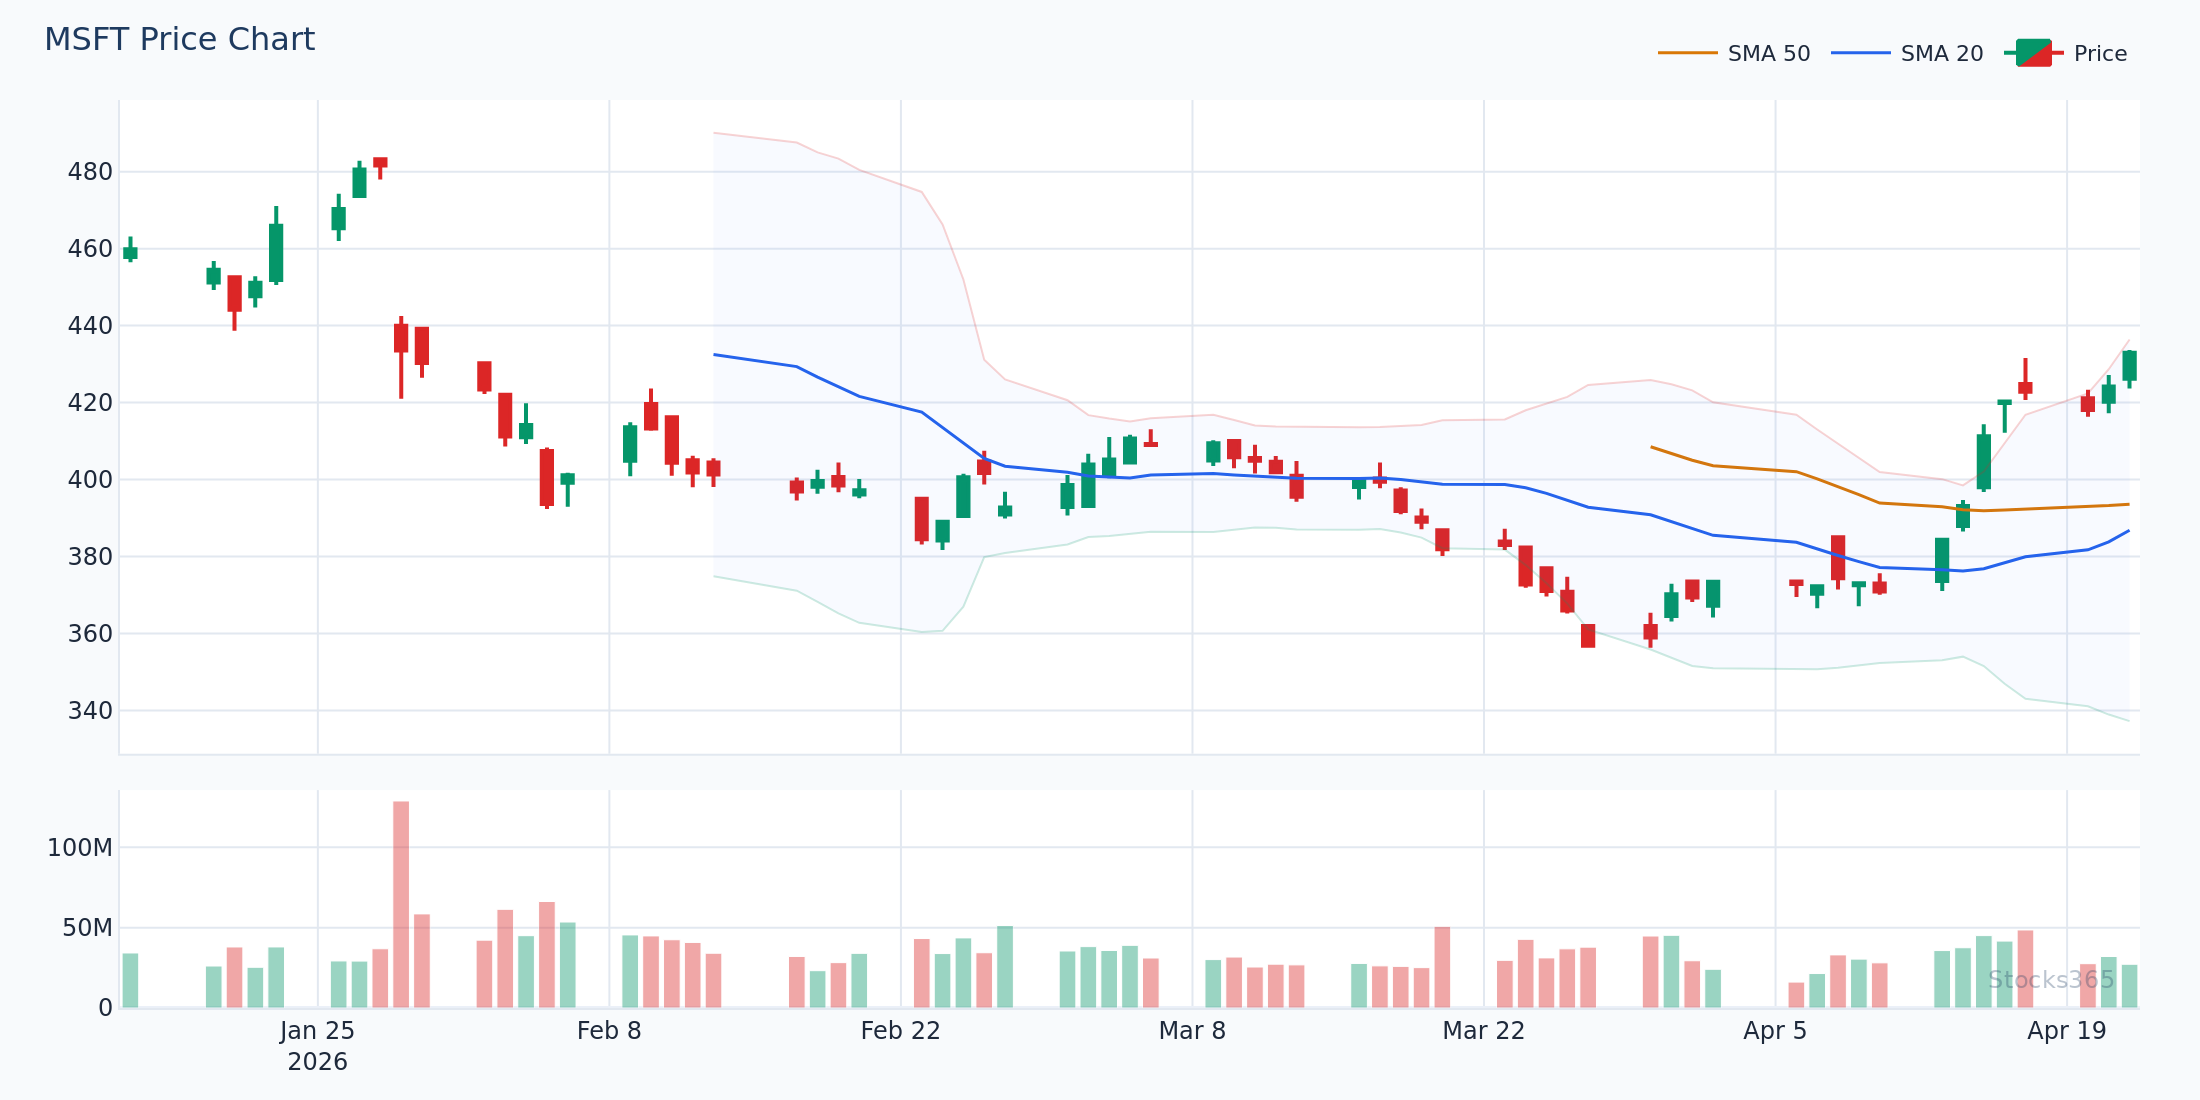
This setup shows MSFT consolidating just above the 50-SMA while the 20-SMA flattens — a pattern that often precedes either a decisive breakout or a support breakdown. Watch for a daily close above the 20-SMA with RSI recovering above 50 to signal resuming upside momentum. A close below the 50-SMA on volume above the 20-day average typically invalidates the bullish read and opens the door to a deeper retest.
Long-Term Position Trading
The 200-SMA is the gold standard for regime identification. Hedge funds, pension funds, and systematic strategies all reference it. Price above the 200-SMA signals a bull regime. Price below signals caution. It's that simple — and that powerful.
When to Use the EMA
The EMA shines when speed and responsiveness matter more than smoothness.
Momentum and Trend-Following
The 9-EMA and 21-EMA combination catches trending moves early. In a strong uptrend, price consistently holds above the 9-EMA on pullbacks. A close below the 9-EMA that then recovers above it within 1-2 sessions is a bullish continuation signal — not a reversal.
Intraday and Swing Trading
Shorter timeframe traders — those working the 15-minute, 1-hour, and 4-hour charts — favor EMAs because they capture intraday momentum shifts that SMAs would miss entirely. The EMA's responsiveness to recent price action makes it the tool of choice when timing entries around volatile catalysts like earnings or macro data.
Crypto Markets
Crypto moves fast. Very fast. The EMA's ability to hug recent price action makes it better suited to the volatility profiles of major digital assets. The 21-EMA and 55-EMA are widely used in Bitcoin and Ethereum analysis, providing dynamic levels that react to rapid sentiment shifts in ways a slow SMA simply cannot.
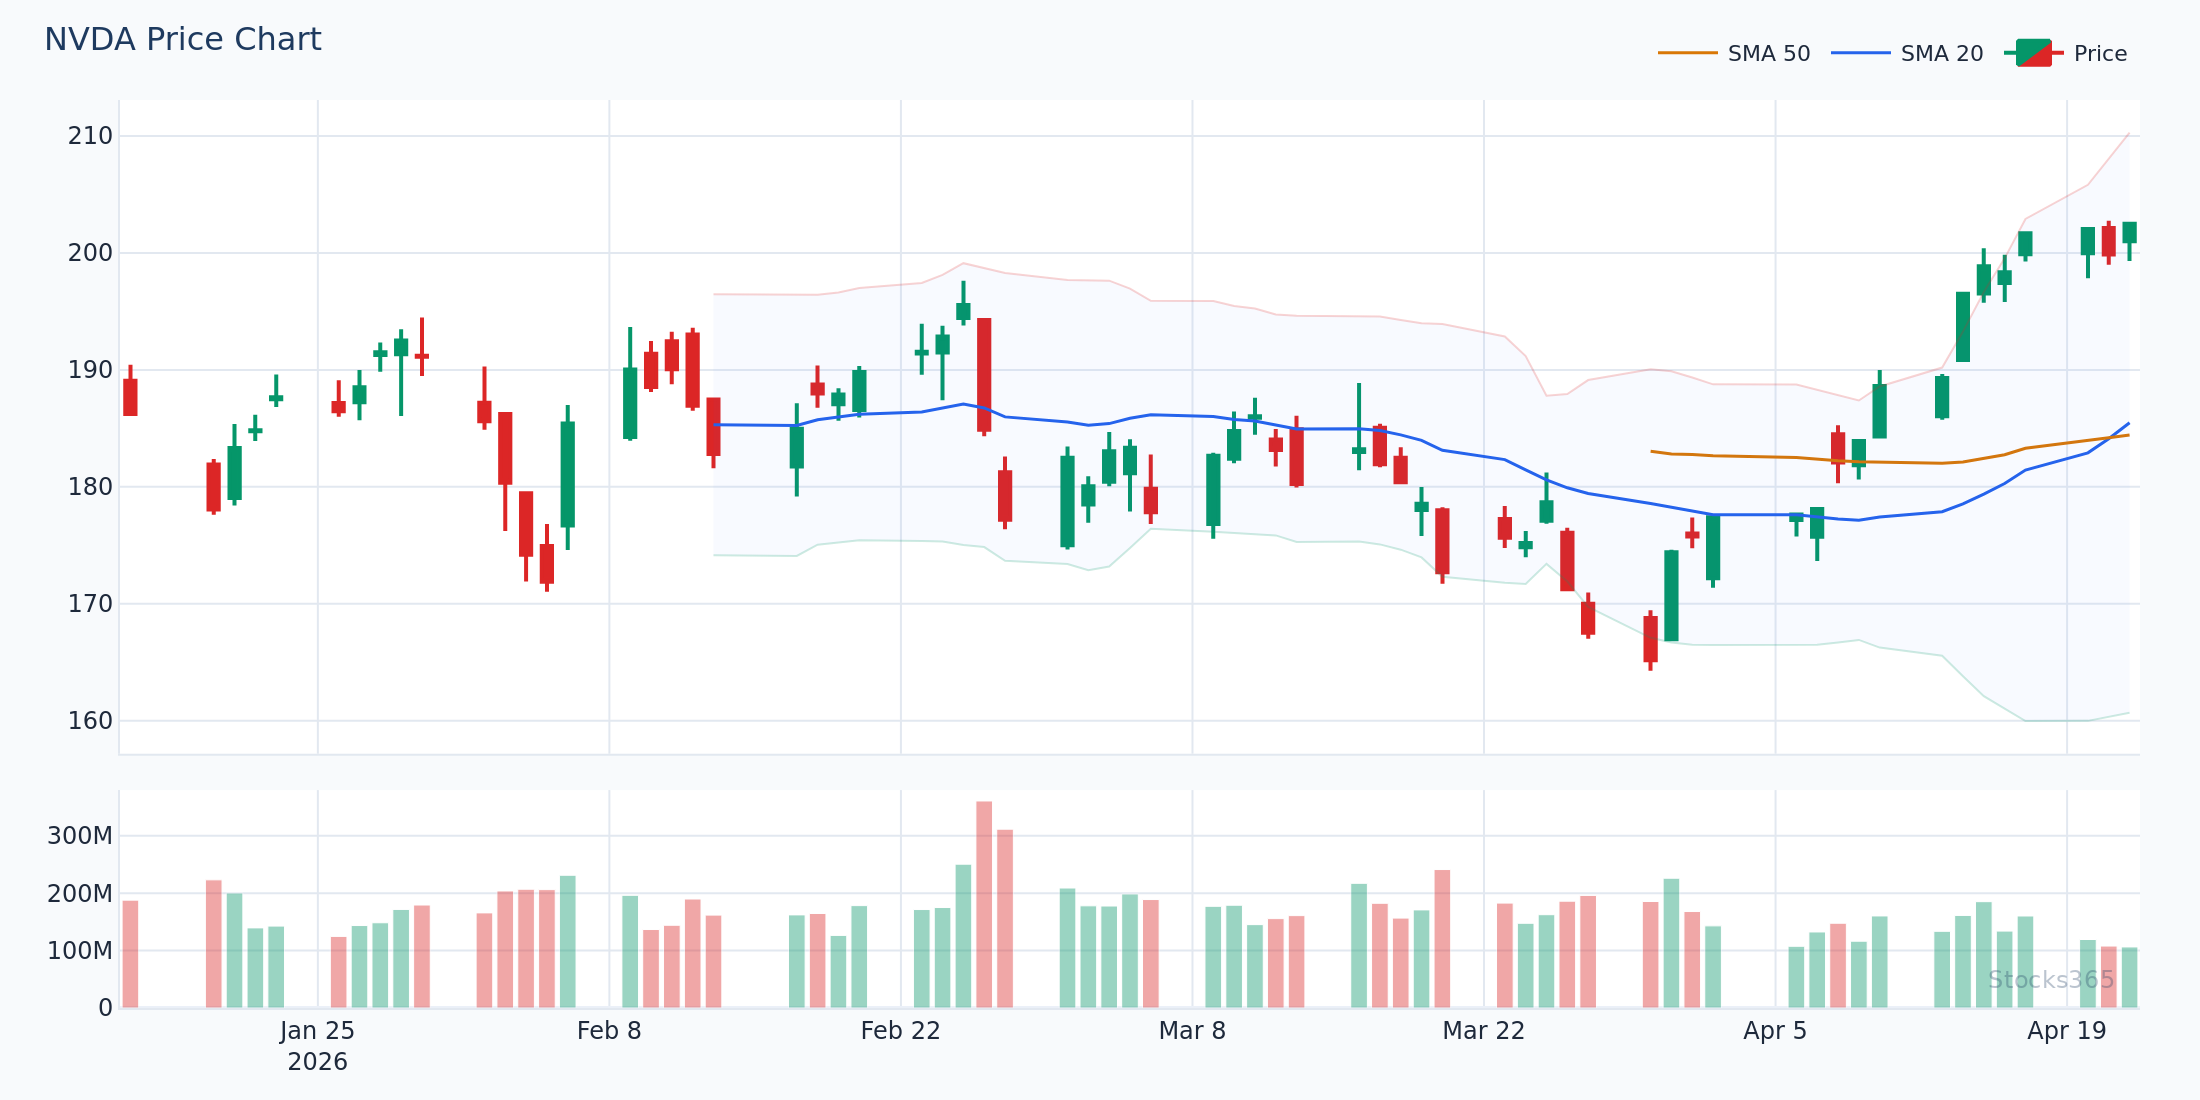
NVDA riding the 9-EMA higher with the 21-EMA well below is a classic momentum structure — price is in the early-to-mid phase of a trend expansion. As long as each daily pullback holds above the 9-EMA and closes near the high, the trend is intact. The first close below the 21-EMA on significant volume signals momentum is fading and a consolidation phase is likely beginning.
Here's What Most Traders Get Wrong
Most traders pick SMA or EMA and treat it as a permanent choice. That's backwards. The real edge is using them together — the EMA for timing entries in the direction of the SMA-defined trend. When the 9-EMA and 21-EMA are stacked above the 50-SMA, which sits above the 200-SMA, that alignment tells you more about market structure than any single moving average ever could. Ignoring one in favor of the other doesn't simplify your analysis — it blinds half of it.
Combining SMA and EMA: The Power Setup
The most effective moving average strategies don't choose sides. They stack signals.
The Trend Filter + Timing Layer Approach
Use the 200-SMA as your regime filter. Only take long trades when price is above it. Only take short trades — or stay in cash — when price is below it. Then use the 9-EMA and 21-EMA crossover as your entry trigger. This layered approach keeps you on the right side of the major trend while using faster tools to time entries with precision.
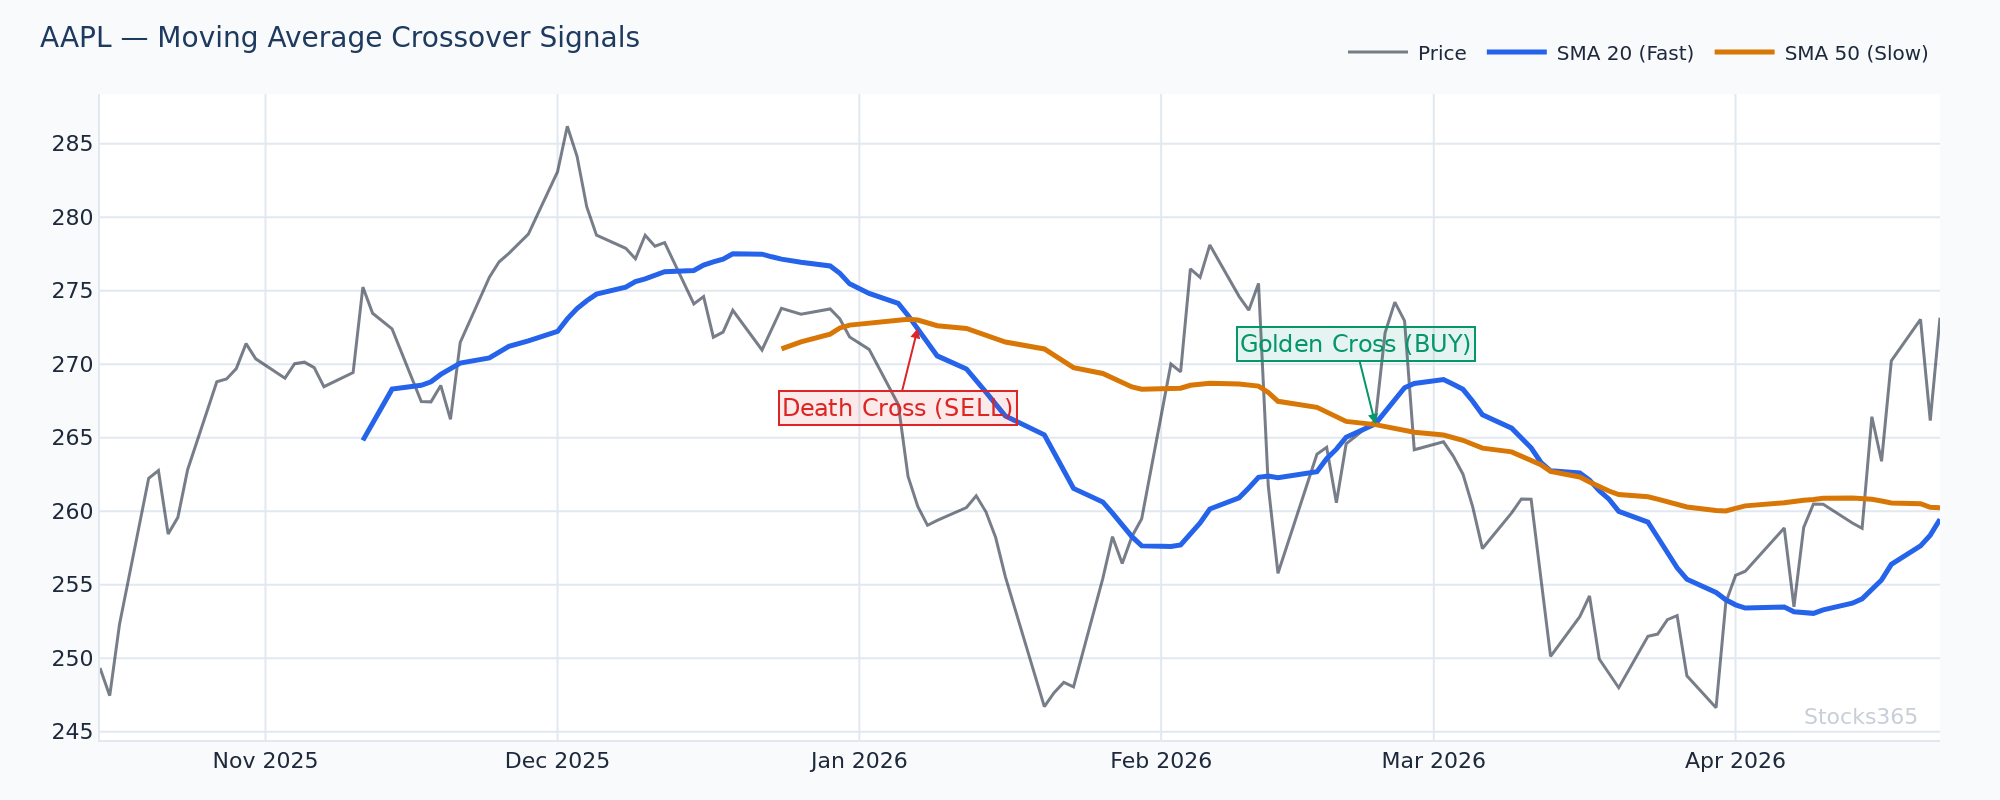
The Golden Cross and Death Cross
The 50-SMA crossing above the 200-SMA — the Golden Cross — is one of the most followed signals in technical analysis. Historically, it marks the transition from a corrective phase to a renewed uptrend. The Death Cross (50-SMA crossing below the 200-SMA) signals the opposite. Neither is a standalone entry signal, but both are powerful regime-change markers when confirmed by volume and momentum.
Pairing these SMA crossovers with RSI momentum confirmation dramatically improves their reliability. An RSI reading that's recovering above 50 at the time of a Golden Cross adds significant confidence to the setup. Learn more in our guide to RSI overbought and oversold levels.
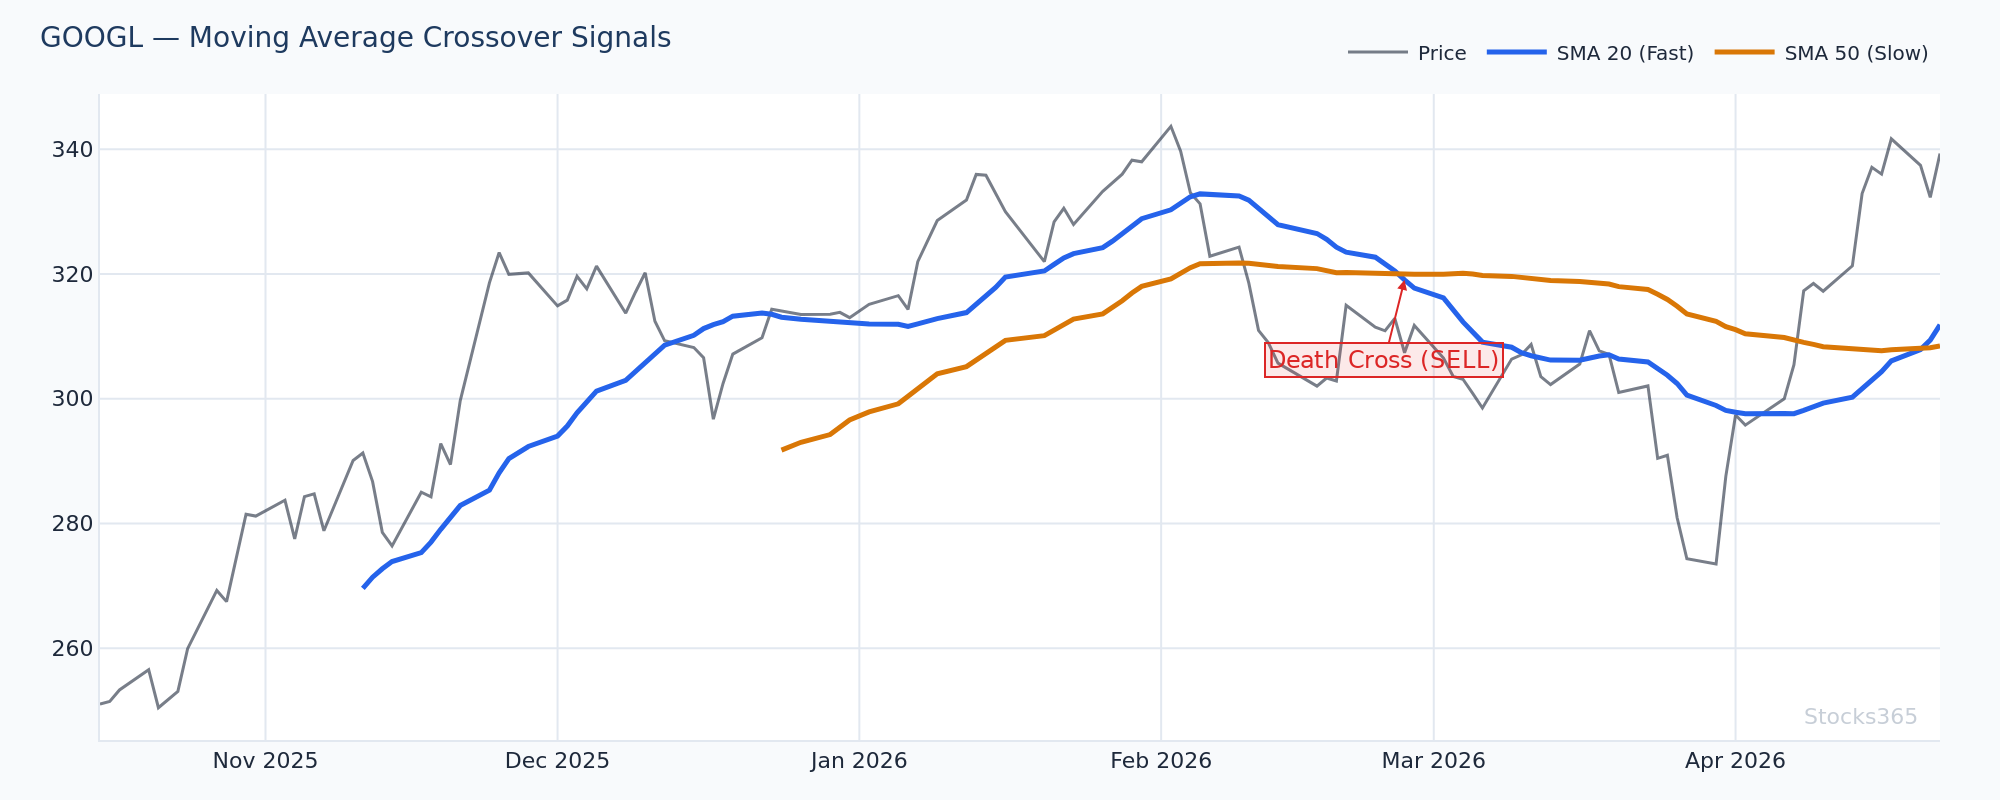
This chart captures GOOGL forming a potential Golden Cross — the 50-SMA approaching the 200-SMA from below after a sustained recovery phase. The pattern is most powerful when price itself is already trading above the 200-SMA before the lines cross, confirming the trend has already shifted. A failure here — where the 50-SMA rolls back below the 200-SMA — typically signals a false recovery and increases the probability of retesting the prior lows.
SMA vs EMA: Practical Comparison by Asset Class
Asset class matters. Moving averages don't behave the same across stocks, crypto, and forex.
- Equities: The 20-SMA, 50-SMA, and 200-SMA dominate. Institutional algorithms reference these levels constantly, creating real, measurable reactions.
- Crypto: EMAs outperform due to higher volatility. The 21-EMA and 55-EMA are community standards. SMA-based signals tend to lag significantly behind rapid crypto price moves.
- Forex: Both are used, but signal quality drops in all moving average strategies due to lower trending behavior and higher mean-reverting character in major pairs.
- Futures and Commodities: The 200-SMA remains the dominant long-term filter. Shorter-period EMAs help with timing in high-velocity moves during supply/demand shocks.
Stocks365 research across 3,289 signals found that price crossing above the 20-SMA shows a 48.3% win rate with a profit factor of 0.88 over 10 days — below breakeven on average. The best performance came in stocks at 52.3%, while crypto was the weakest at just 36.9%. This data reinforces a key principle: buy signals around moving averages need additional confirmation, especially in crypto where volatility frequently fakes breakouts. Explore the full breakdown at Stocks365 Insights.
Moving Averages and Momentum: The Missing Link
Moving averages define trend structure. Momentum indicators define trend strength. Use both.
A price crossing above the 50-SMA means little without knowing whether momentum is accelerating or exhausted. RSI climbing above 50 alongside a 50-SMA breakout is confirmation. RSI diverging downward while price breaks above the 50-SMA is a warning. For a deep dive into how RSI divergence signals emerging trend reversals, see our article on RSI divergence.
The combination is more powerful than either tool alone. Always.
For traders exploring which momentum indicator pairs best with moving averages, our comparison of RSI vs Stochastic Oscillator offers a direct look at the strengths and weaknesses of each in different market environments.
What to Watch For
- EMA compression before a breakout: When the 9-EMA, 21-EMA, and 50-EMA converge tightly on a daily chart, it signals a coiling pattern. The next directional close often extends 1.5–2x the average daily range — watch for volume confirmation on the breakout candle.
- Price reclaiming the 200-SMA after a prolonged downtrend: When price closes above the 200-SMA for the first time after 3+ months below it, and RSI simultaneously crosses 50, this regime-change signal has historically produced strong continuation moves over the following 4–8 weeks.
- 20-SMA flattening during a trend: A 20-SMA that flattens after a strong directional move signals momentum is pausing. If the 50-SMA is still rising beneath it, a tight consolidation here often resolves in the direction of the larger trend.
- EMA death cross on 4-hour charts in crypto: When the 21-EMA crosses below the 55-EMA on a 4-hour crypto chart after a 15%+ decline from recent highs, the probability of further downside increases significantly — especially if RSI is capped below 50 on bounces.
- Golden Cross with expanding volume: A 50-SMA crossing above the 200-SMA means little if volume is contracting. The setups that follow through consistently are those where volume on breakout days is at least 1.5x the 20-day average — confirming institutional participation.
How Stocks365 Uses This
Stocks365 Platform Integration
The Stocks365 trust score system incorporates both SMA and EMA signals as part of its 12+ indicator framework. Moving average alignment — specifically whether price is trading above or below key SMAs (20, 50, 200) and whether short-term EMAs are stacked in a bullish or bearish order — contributes directly to the trend regime scoring component of the trust score.
When multiple moving averages align in the same direction and agree with momentum indicators like RSI and volume signals, the trust score rises. Disagreement between moving averages — such as price above the 50-SMA but below the 200-SMA — is flagged as a mixed regime, reducing the signal confidence score and surfacing that context directly in the dashboard view.
You can see how this plays out in real time for individual instruments like AAPL signals or across all tracked assets in the Stocks365 signals dashboard, where trust score breakdowns show the contribution of each indicator including moving average alignment.