
Moving Averages in Day Trading: The Intraday Edge Most Traders Underuse
Moving averages are the backbone of technical analysis. Every serious day trader uses them. Most use them wrong.
The good news? Once you understand how moving averages behave on intraday timeframes — and more importantly, why they behave that way — your chart reading transforms. You stop guessing entries. You start reading price with structure.
This guide covers everything: how moving averages work on short timeframes, which types matter for day trading, the best setups to watch, and how to combine them with momentum indicators for higher-probability signals. Let's get into it.
Stocks365 Research Note: Our analysis of 3,332 Price Crosses Below SMA 20 signals shows a 50.9% win rate over a 10-day holding period (profit factor: 1.06). Across asset classes, crypto leads at 66.8% while forex lags at 42.5%. Understanding where you're trading matters as much as the setup itself. See the full breakdown on our research dashboard.
What Are Moving Averages and Why Do They Matter Intraday?
A moving average smooths price data over a defined number of periods. On a 5-minute chart, a 20-period SMA calculates the average closing price across the last 20 five-minute candles — roughly 1 hour and 40 minutes of market action. That single line tells you where price has been on average, and gives you a dynamic reference point for where it might go next.
Two types dominate day trading:
- Simple Moving Average (SMA): Equal weight to every period. Slower to react. Better for identifying macro intraday trend direction.
- Exponential Moving Average (EMA): More weight to recent candles. Faster to react. Better for entries and exits in fast-moving markets.
Day traders lean on EMAs more heavily. Speed matters intraday. A 9-EMA and 21-EMA on a 5-minute chart can react to momentum shifts that a standard SMA misses entirely.
The Most Useful Moving Averages for Intraday Timeframes
Not every moving average is built for intraday work. Here's what actually gets used by active traders in 2026:
- 9-EMA: Ultra-fast. Tracks short-term momentum. Used on 1-min and 5-min charts for micro-scalping entries.
- 20-SMA / 21-EMA: The bread-and-butter intraday average. Acts as dynamic support and resistance throughout the session.
- 50-EMA: Mid-session trend filter. If price stays above the 50-EMA, the trend is up. Simple as that.
- VWAP (Volume-Weighted Average Price): Not a traditional moving average, but functions like one intraday. Institutional reference point. Ignore it at your own risk.
- 200-SMA on the daily: Even day traders check this. It defines the macro trend and influences how intraday setups resolve.
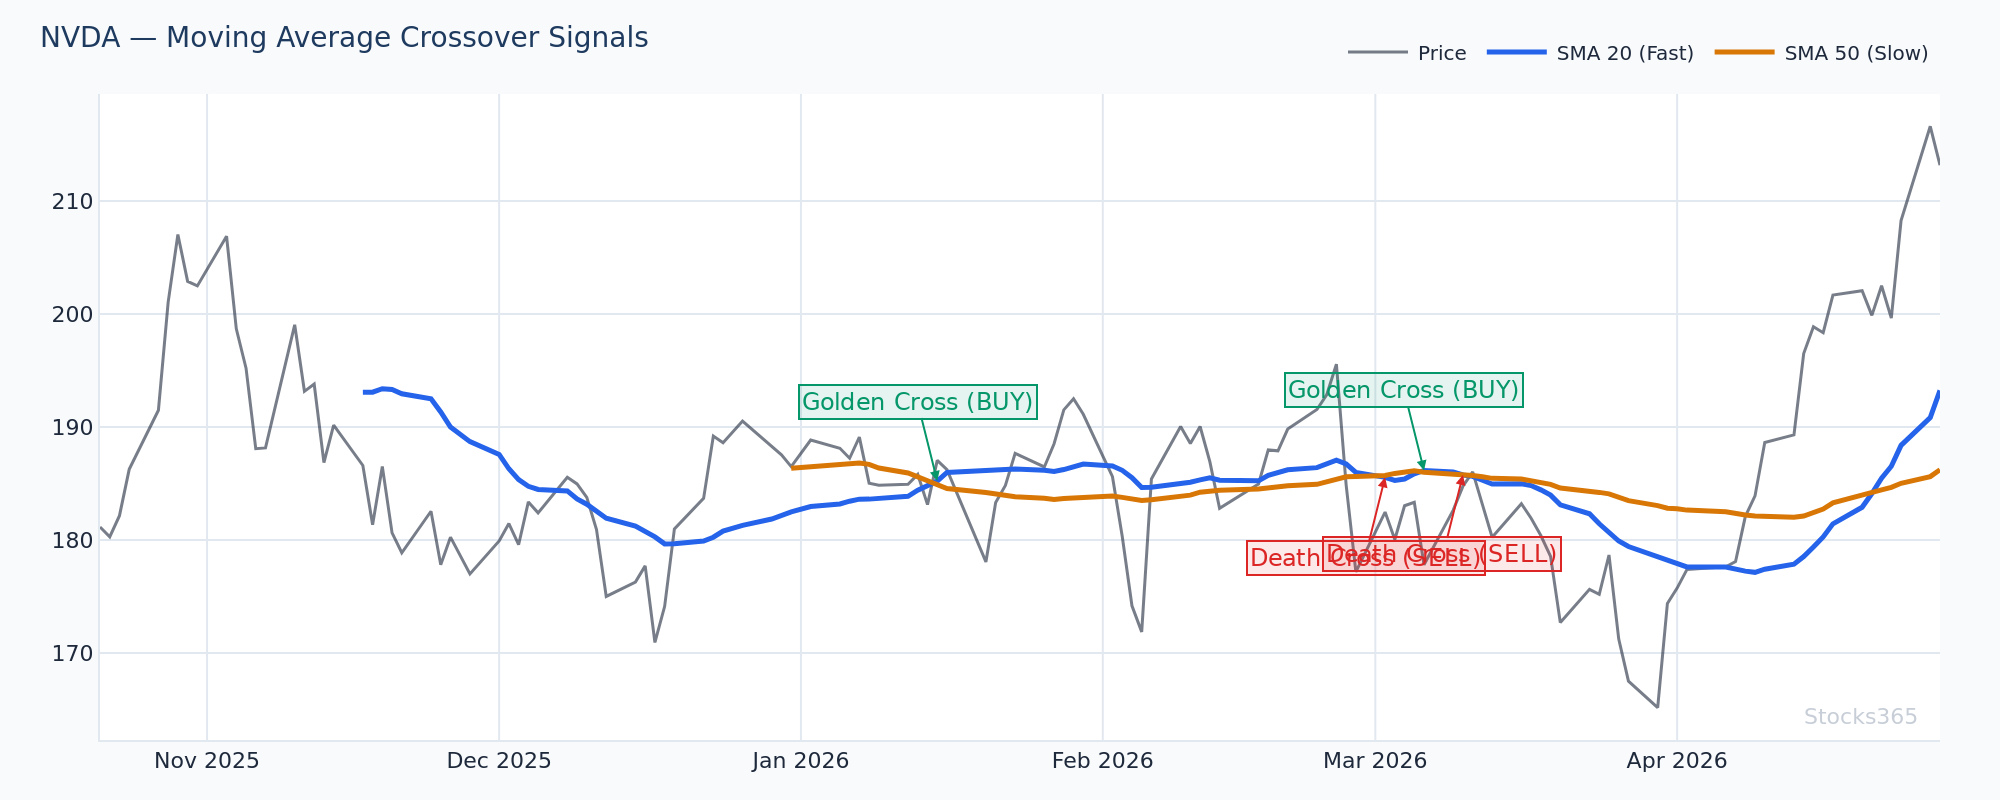
This chart shows a classic 9/21 EMA crossover forming after a consolidation period near the session's VWAP level. When the 9-EMA crosses above the 21-EMA with expanding candle bodies, the setup signals a potential intraday momentum push. Confirmation comes from volume surging above the 20-period average — without that volume, the cross is noise. A close back below the 21-EMA invalidates the move.
The Core Moving Average Setups for Day Trading
Setup 1: The EMA Bounce (Trend Continuation)
This is the highest-probability intraday setup. Price trends in a direction, pulls back to a key EMA, and resumes. Clean. Repeatable.
How to trade it:
- Identify a clear intraday trend (higher highs, higher lows above the 20-EMA on a 5-min chart)
- Wait for price to pull back and touch or slightly pierce the 20-EMA or 21-EMA
- Look for a bullish rejection candle — hammer, engulfing, or strong close off the EMA
- Volume should contract during the pullback, then expand on the bounce candle
- Enter on the close of the rejection candle or the break of its high
The 20-EMA bounce works because it reflects where the dominant intraday players (institutions, algorithms) are positioned. They buy dips to the EMA in uptrends. They sell rips to the EMA in downtrends.
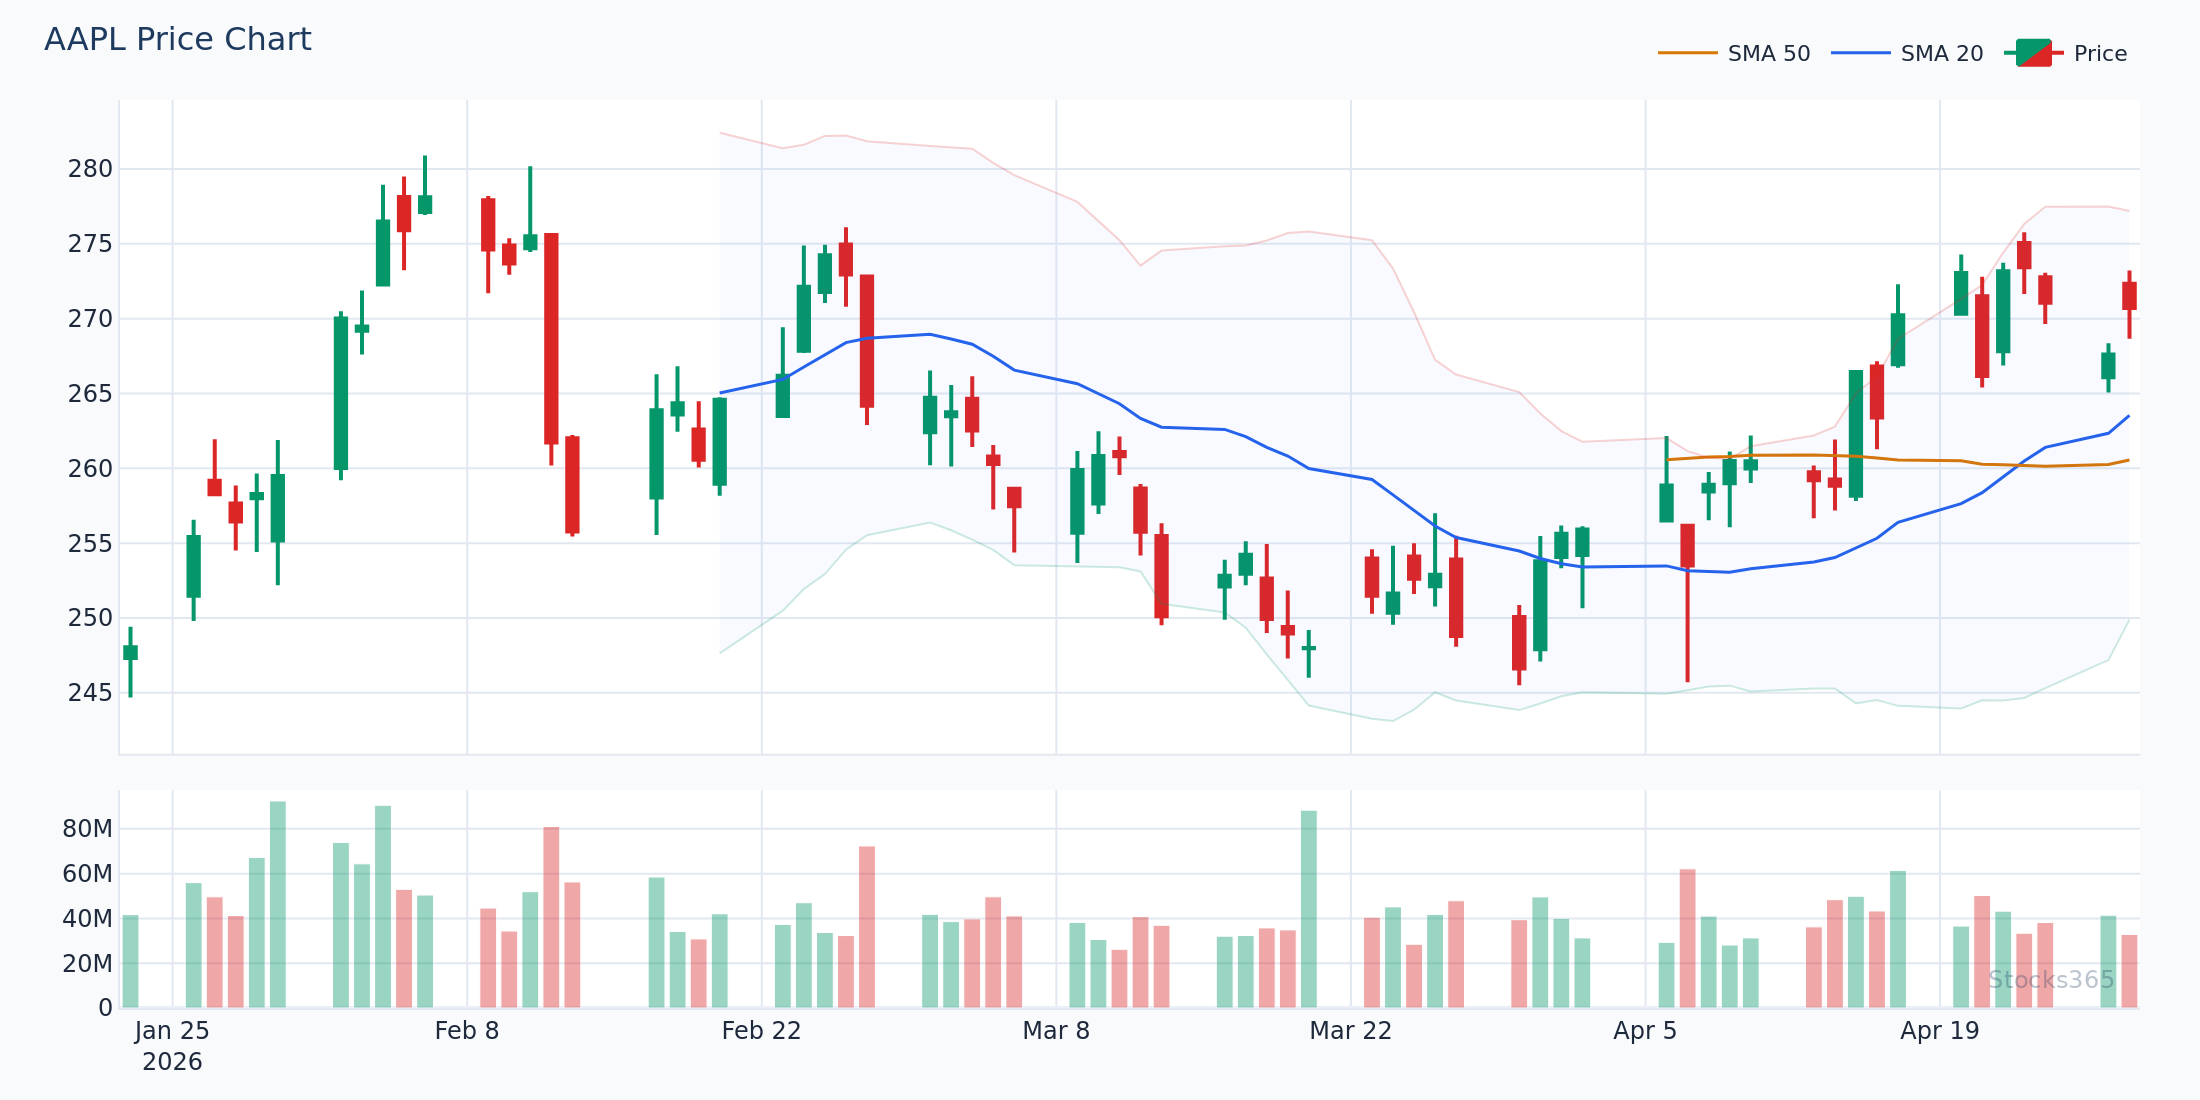
This chart illustrates a textbook EMA bounce scenario: price makes a clean directional move, retraces to the 20-EMA on declining volume, then produces a strong rejection candle. The next candle should close above the prior candle's high to confirm momentum resumption. If instead price breaks and closes below the 20-EMA on above-average volume, the trend is likely reversing and the setup is off the table.
Setup 2: The EMA Crossover (Momentum Signal)
When a faster EMA crosses a slower EMA, momentum is shifting. The 9/21 EMA cross on a 5-minute chart is one of the most watched intraday signals in 2026.
The rules are simple:
- Bullish cross: 9-EMA crosses above 21-EMA — look for longs in the direction of the daily trend
- Bearish cross: 9-EMA crosses below 21-EMA — look for shorts or exit long positions
The catch? Crossovers in choppy, low-volume conditions generate false signals constantly. Filter them. Only act on crossovers that occur after price has been trending — not when price is stuck in a 10-period range. The crossover confirms a move already in progress; it doesn't create one.
Setup 3: The SMA Break and Retest (Intraday Structure Play)
Price breaks above a key SMA (say, the 20-SMA on a 15-minute chart), pulls back to retest it from above, and holds. That retest becomes the entry. Former resistance becomes support. This is basic market structure — but it's extraordinarily reliable when combined with volume confirmation.
The mirror image works on the short side: price breaks below the 20-SMA, retests from underneath, fails to reclaim it, and continues lower. Watch for that retest rejection.
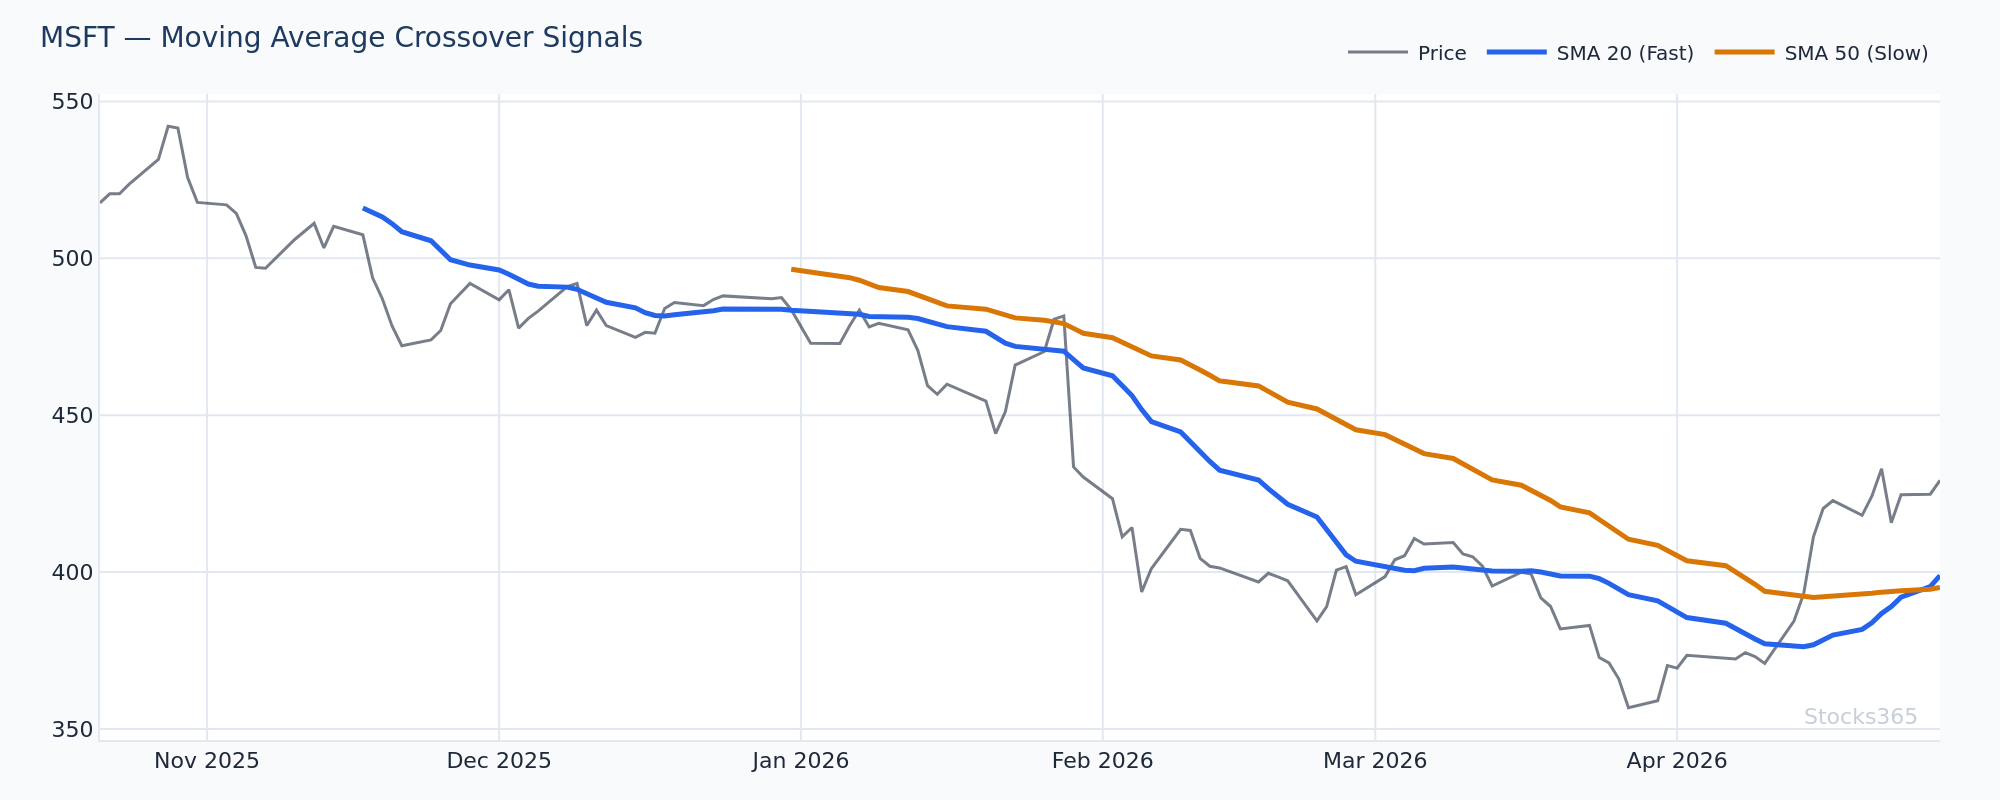
Here the 20-SMA acts as a structural pivot after a clean breakout. Price initially breaks through with a wide-range candle and elevated volume, then retraces to the SMA on quieter volume. The confirmation candle is the one to watch — a close back above the SMA high with renewed volume signals the continuation. A close below the SMA on this retest means the breakout has failed.
Here's What Most Traders Get Wrong About Moving Averages
Most day traders treat a moving average cross as a trade signal. The cross happens, they enter, the trade fails, and they blame the indicator. The problem isn't the indicator — it's the approach.
Moving averages are lagging by design. They confirm trends that already exist. They don't predict. When you enter immediately on a crossover without waiting for confirmation — a strong candle close, a volume surge, a momentum alignment — you're entering after the easy money has already been made.
The edge is using the moving average as a filter, not a trigger. Ask: is price above or below the key EMA? That tells you directional bias. Then wait for a momentum signal — a price action pattern, a momentum oscillator like RSI confirming, volume expansion — to time your entry. The moving average sets the stage. Everything else writes the script.
Combining Moving Averages With Momentum Indicators
Moving averages answer the question: what direction is price moving? Momentum indicators answer: how strong is that move? Together, they're formidable.
Moving Averages + RSI
This is one of the most effective intraday combinations available. Use the EMA to define trend direction, then use RSI to time entries within that trend.
The setup: price is above the 20-EMA (uptrend confirmed), RSI pulls back below 40 on the retrace, then crosses back above 40 as price bounces off the EMA. That RSI re-cross is the momentum confirmation you need. For a deeper understanding of how to read RSI signals precisely, check out our step-by-step guide on using RSI in trading.
Understanding RSI divergence adds another layer. When price makes a new intraday low but RSI prints a higher low near a key EMA, that divergence is a high-quality reversal signal. Our guide on RSI divergence and bullish/bearish signals covers the exact mechanics.
Moving Averages + MACD
MACD is built from moving averages — it measures the difference between a 12-EMA and 26-EMA. Pairing MACD crossovers with price's position relative to a key SMA creates a dual-confirmation system. If you trade forex pairs intraday, this combination is particularly powerful. Our article on MACD in forex trading breaks down the best currency pair applications.
Moving Averages + Volume
Volume is the truth-teller. A moving average signal without volume is a rumor. With volume, it's a fact. When price crosses above a key EMA on a candle with volume 2x or more above the 20-period average, the probability of follow-through rises significantly. Volume confirms conviction. Always check it.
This chart shows price above the 21-EMA in an established intraday uptrend, with RSI pulling back to the 40-50 zone during a shallow consolidation. The entry signal fires when RSI crosses back above 50 simultaneously with a bullish engulfing candle touching the 21-EMA on slightly above-average volume. The invalidation is clear: a close below the 21-EMA on volume expansion means the trend structure has broken.
Moving Averages Across Different Intraday Timeframes
Timeframe selection matters more than most beginners realize.
- 1-minute chart: Use 9-EMA and 21-EMA for scalping. Extremely noisy. Requires very tight execution discipline.
- 5-minute chart: The sweet spot for most day traders. 9-EMA, 20-EMA, and 50-EMA work well. Enough signal, manageable noise.
- 15-minute chart: Better for swing-style day trades held for most of the session. 20-SMA and 50-EMA are primary references.
- Hourly chart: Used for context, not entries. The 20-SMA on the hourly tells you the macro intraday bias.
Multi-timeframe alignment is powerful. If the 20-EMA on the 15-minute chart is pointing up, and the 9-EMA just crossed above the 21-EMA on the 5-minute chart, and RSI is above 50 on both — that's three timeframes agreeing. Trade in that direction with confidence.
When Moving Averages Work — and When They Don't
Moving averages thrive in trending markets. In choppy, range-bound sessions, they generate false signals at an alarming rate. This isn't a flaw — it's the nature of the tool.
Asset Class Context Matters: Stocks365 backtested 3,332 Price Crosses Below SMA 20 setups across multiple asset classes and found stark differences: crypto delivered a 66.8% win rate on this signal, while forex produced just 42.5%. If you're day trading forex pairs with moving average crossovers, the edge is considerably thinner — and your approach needs to adjust accordingly.
How to identify trending vs. choppy conditions before you trade:
- ADX above 25: Trending. Moving average signals are more reliable.
- ADX below 20: Choppy. Reduce position size or avoid MA crossover signals entirely.
- Price oscillating through the EMA repeatedly: Range-bound. The EMA is useless as a directional tool here.
- Candle bodies consistently closing on one side of the EMA: Trend is intact. Use pullback entries.
Also watch the clock. The first 30 minutes of the U.S. session (9:30–10:00 AM ET) and the final hour (3:00–4:00 PM ET) produce the most reliable moving average trends. Mid-day (11:00 AM–1:00 PM ET) typically grinds sideways. Moving average signals during that window often fail.
Practical Day Trading Workflow Using Moving Averages
Before the market opens:
- Check the daily chart. Is price above or below the 200-SMA? This sets macro bias.
- Check the hourly. Where is price relative to the 20-SMA and 50-EMA?
- Note key levels where moving averages cluster — these become magnet zones intraday.
During the session:
- Drop to the 5-minute chart. Define the opening range and note which side of the 20-EMA price opens on.
- Wait for price to establish a clear intraday trend — at least 3-4 candles closing on one side of the EMA.
- Look for a pullback setup or crossover confirmation before entering.
- Combine with RSI or MACD for momentum confirmation.
- Size positions according to the distance between entry and invalidation level (the EMA or recent swing low/high).
Manage the trade by trail. Once price extends 1-1.5 ATR from entry, move your stop to breakeven. Let the EMA trail your exit — in strong trends, price rarely closes back through it on the same bar.
Check live signal quality and trend alignment directly on the Stocks365 signals dashboard before executing — it aggregates moving average status alongside other technical indicators in real time. You can also view individual stock signal pages like AAPL's signal page to see how moving averages align with the broader trust score for that name.
What to Watch For
- EMA stack alignment on the open: When the 9-EMA, 21-EMA, and 50-EMA are stacked in order (9 on top, 50 on bottom in an uptrend) within the first 15 minutes of the session, that's a high-confidence directional bias signal. Trade pullbacks to the 21-EMA, not breakouts.
- Price reclaiming the 20-SMA on the 5-minute chart after a gap-down open: If price gaps below the 20-SMA but reclaims it within the first 30 minutes on above-average volume, that reclaim often produces a sharp intraday reversal. The 20-SMA becomes the new support.
- EMA compression followed by expansion on high-cap tech names: When the 9-EMA and 21-EMA flatten and converge during a low-volume mid-day period, then diverge sharply on volume expansion, the resulting directional move often runs 2-3 ATR. Watch for this setup in the final hour of the session.
- RSI divergence at a key EMA on the 15-minute chart: When price makes a lower low but RSI prints a higher low at the 50-EMA, the combination of momentum divergence and dynamic support makes for a compelling long setup. This pattern has preceded sharp intraday reversals on large-cap stocks repeatedly. More on this pattern in our guide on hidden RSI divergence signals.
- Cross-timeframe EMA rejection on forex: Given that forex shows the weakest win rate on SMA-20 cross signals, focus on EMA rejections (not crossovers) when day trading currency pairs. Wait for price to reject the 20-EMA on the 15-minute chart with a strong bearish or bullish candle body — that's far more reliable than acting on the cross itself in that asset class.
Key Takeaways
📊 Key Takeaways: Moving Averages in Day Trading
- EMAs over SMAs intraday: Exponential moving averages react faster to price change — prefer the 9-EMA, 21-EMA, and 50-EMA on 5-minute and 15-minute charts.
- Use MAs as filters, not triggers: The moving average tells you directional bias. Momentum indicators, volume, and price action patterns tell you when to enter.
- EMA bounces > crossovers: In trending sessions, buying pullbacks to a rising EMA outperforms chasing crossover signals. The bounce setup has cleaner risk-reward.
- Context changes edge: Asset class matters. Stocks365 data shows moving average signals perform meaningfully better in crypto than in forex — adjust expectations accordingly.
- Multi-timeframe alignment multiplies probability: When the 15-min, 5-min, and 1-min charts all show price on the same side of their key EMAs, directional signals are significantly stronger.
- Avoid MAs in choppy mid-day sessions: ADX below 20, price crossing the EMA multiple times — these are signals to step back, not trade harder.
- Combine with RSI and MACD: Moving averages define trend; RSI and MACD confirm momentum. The combination is more powerful than either alone.
How Stocks365 Uses This
🔬 How Stocks365 Integrates Moving Averages Into Its Trust Score SystemMoving average alignment is one of 12+ technical components that feed into the Stocks365 Trust Score for every tracked instrument. Specifically, the system evaluates price position relative to the 20-SMA, 50-EMA, and 200-SMA across multiple timeframes — scoring each as confirming or conflicting with the prevailing trend regime.
When the 5-minute, 15-minute, and daily EMAs all agree directionally, the Trust Score registers higher regime agreement. When moving averages conflict across timeframes — say, price above the 20-EMA on the 5-minute but below it on the 15-minute — the system flags reduced signal quality and weights the overall Trust Score lower.
This multi-timeframe MA stack analysis is combined with momentum scoring (RSI, MACD), volatility regime (ATR percentile, Bollinger Band width), and volume confirmation to produce a composite signal quality rating. The result: you see not just whether a moving average signal exists, but how much of the broader technical picture agrees with it. Check the Stocks365 dashboard to see this in action across live markets.