
What Is the 200-Day Moving Average?
The 200-day moving average (200 DMA) is the average closing price of an asset over the last 200 trading sessions. It smooths out daily noise and reveals the true long-term trend direction. Simple idea. Profound impact.
Hedge funds use it. Retail traders use it. Market commentators quote it on television every time a major index crosses above or below it. There's a reason for that. The 200-day moving average cuts through the chaos and answers one critical question: is this asset in a bull trend or a bear trend?
No other single indicator does that job as cleanly.
How the 200-Day Moving Average Is Calculated
The calculation is straightforward. Add up the closing prices from the last 200 trading days, then divide by 200. That gives you the simple moving average (SMA) version. Some platforms offer the exponential moving average (EMA) version, which weights recent prices more heavily.
For trend filtering — the primary use case — most professional traders prefer the simple 200-day SMA. It reacts more slowly, which is exactly what you want. You're not looking for precision. You're looking for context.
SMA vs. EMA: Which 200-Day Version Works Better?
The 200-day EMA responds faster to recent price changes. That means earlier signals, but also more false signals in choppy markets. The 200-day SMA is slower, which filters out noise that would otherwise trigger premature entries or exits.
The choice depends on your style. Swing traders often prefer the EMA for slightly quicker responses. Position traders and investors lean toward the SMA. When in doubt, use the SMA. Most institutional benchmarks reference it.
Why the 200-Day Moving Average Works
It's not magic. It works because enough participants watch it and act on it. That's the nature of technical analysis — self-fulfilling behavior creates real price reactions.
But there's more to it than market psychology. The 200-day moving average approximates roughly 10 months of trading activity. It captures an entire business cycle phase. When price stays above it for extended periods, institutional money is positioned long. When price breaks below it decisively, risk management protocols trigger institutional selling.
That's not sentiment. That's mechanics.
This chart shows how price tends to respect the 200-day moving average as a gravitational zone. When price pulls back toward the 200 DMA during an uptrend, watch for it to flatten and then curl back upward — that curl often marks the start of the next leg higher. A clean break below the 200 DMA on above-average volume invalidates the bullish thesis and shifts the trend to neutral or bearish.
The Four Key Signals from the 200-Day Moving Average
1. Price Crosses Above the 200 DMA (Golden Signal)
When price crosses above the 200-day moving average after a sustained period below it, the trend has potentially flipped bullish. This is one of the most watched signals in all of technical analysis. It marks the transition from a downtrend to a recovery phase.
Not every cross holds. The best crosses come with confirmation: rising volume, a widening gap between price and the 200 DMA, and momentum indicators like RSI recovering above 50. A weak cross — low volume, price immediately retreating — is a warning sign, not a buy signal.
2. Price Crosses Below the 200 DMA (Death Signal)
The inverse is equally powerful. When price breaks below the 200-day moving average after trading above it for months, institutional selling typically accelerates. The trend has shifted. Mean reversion rallies back to the 200 DMA become selling opportunities, not buying opportunities.
Context matters enormously here. A break below the 200 DMA during a broad market correction carries different implications than a break during a sector-specific selloff. Always assess the macro backdrop.
3. The 200 DMA as Dynamic Support
During strong uptrends, the 200-day moving average acts as a floor. Price dips toward it, tests it, and bounces. These pullback-to-200-DMA entries are among the highest-probability setups in trend following — you're buying strength in context, not chasing price at extended levels.
The key trigger: price approaches the 200 DMA, a lower-timeframe bullish reversal pattern forms (engulfing candle, hammer, morning star), and RSI holds above 40. That combination stacks confluence effectively. You can track these setups in real time on the Stocks365 signals dashboard.
4. The 200 DMA as Dynamic Resistance
In downtrends, the 200 DMA flips to resistance. Rallies up toward it stall and reverse. Short sellers actively defend this level. Price reaching up to touch the underside of the 200 DMA — particularly when that average is sloping downward — is a textbook distribution zone.
This setup is particularly instructive. Notice how the rally approaches the 200 DMA with declining volume — that's distribution, not accumulation. When RSI simultaneously fails to break above 50 during the push toward the 200 DMA, the probability of a reversal back lower increases substantially. A close back below any recent consolidation range confirms the rejection.
Here's What Most Traders Get Wrong
Most traders treat the 200-day moving average cross as an instant buy or sell signal. They see price break above the 200 DMA and buy immediately. They see price break below and sell everything. This reactive approach is exactly backward.
The 200-day moving average is a filter, not a trigger. The cross tells you which direction to trade. It does not tell you when to enter. Entry timing requires a separate trigger — a pullback, a consolidation breakout, a momentum shift on a lower timeframe. Trading the cross itself, especially with gap-up or gap-down opens, means entering at the worst possible price relative to your stop.
Wait for the retest. Let price confirm the new trend relationship with the 200 DMA before committing capital.
Combining the 200-Day Moving Average with Other Indicators
200 DMA + RSI: A Powerful Combination
The 200-day moving average tells you the trend. RSI tells you the momentum condition within that trend. Together, they filter out most low-quality setups. The rule is simple: only take RSI oversold readings (RSI below 30) as buy signals when price is above the 200 DMA. Only take RSI overbought readings as sell signals when price is below the 200 DMA.
This alignment between trend regime and momentum condition dramatically improves signal quality. For a deeper dive into how RSI works alongside trend filters, see our guide on how to use RSI in trading. If you're new to the indicator entirely, the complete RSI beginner's guide is the right starting point.
200 DMA + Volume: Confirming Real Moves
Volume is the lie detector of price action. A break of the 200 DMA on volume that surges 2x or more above the 20-day average volume is a real move. The same break on below-average volume is a potential head fake — price may touch the other side of the 200 DMA and snap back.
Always check volume at the moment of a 200 DMA break. It takes one second and it eliminates a significant percentage of false signals.
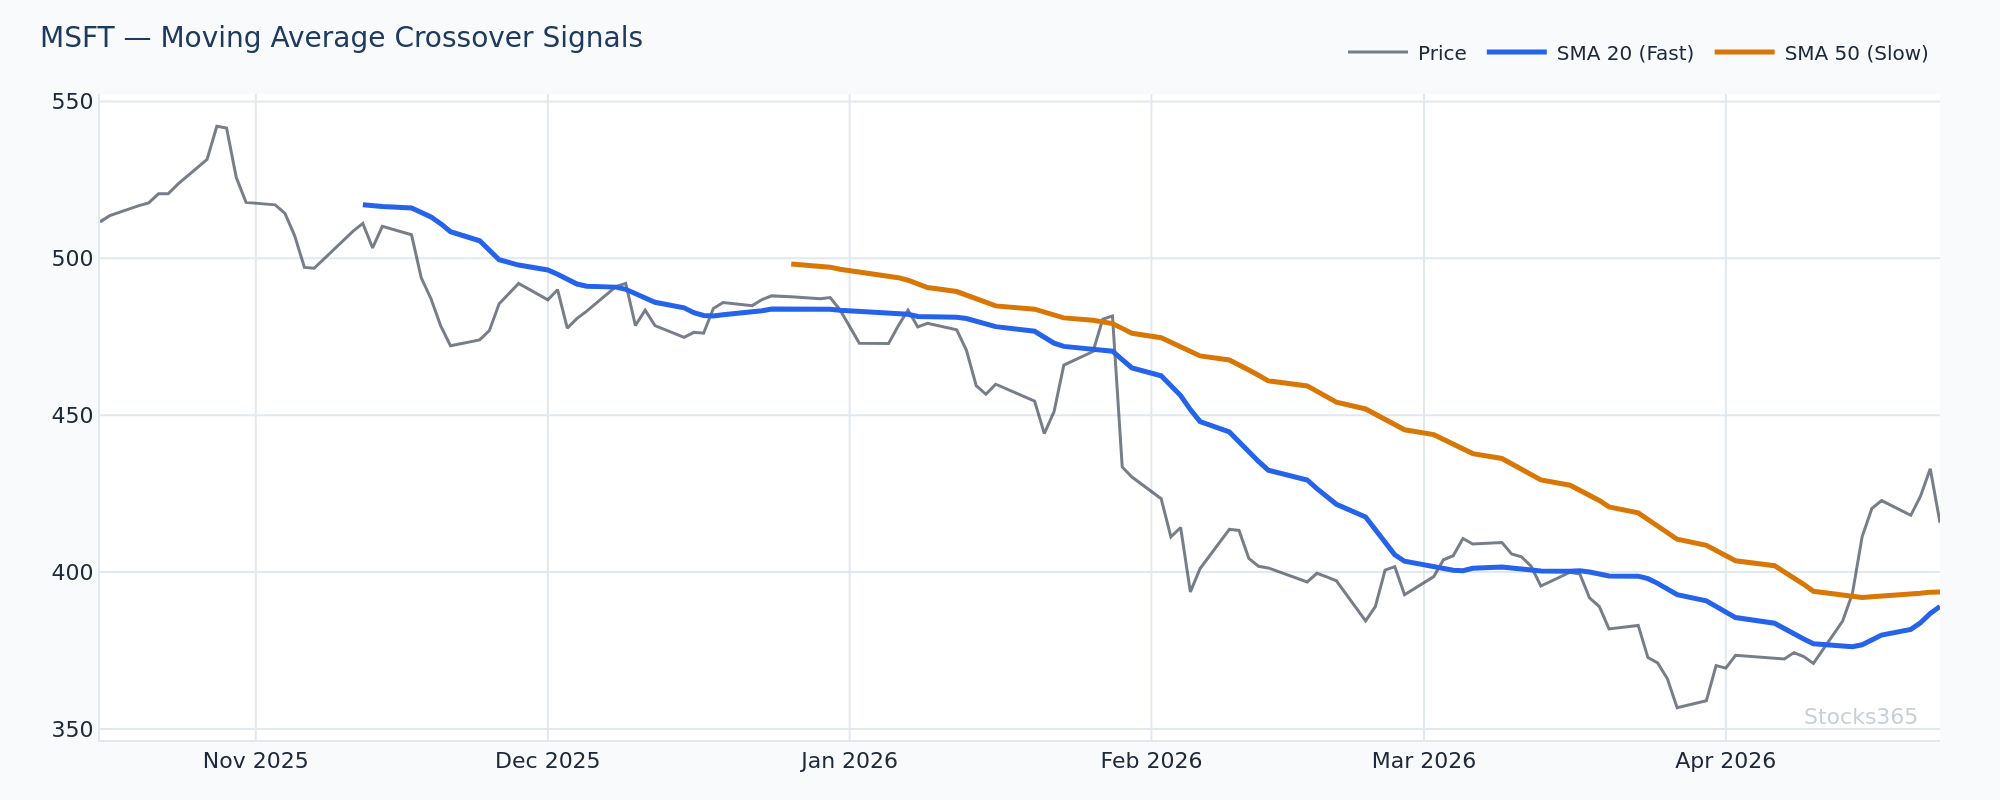
200 DMA + 50-Day Moving Average: The Golden and Death Cross
When the 50-day moving average crosses above the 200-day moving average, it's called a Golden Cross. When it crosses below, it's the Death Cross. These are slower signals — they lag significantly — but they carry enormous weight among institutional managers who use them as portfolio-level trend confirmation.
The Golden Cross tends to generate the most excitement at the wrong time: after a large move has already happened. The smarter use is recognizing that once a Golden Cross forms, pullbacks to the 200 DMA are buying opportunities until the structure breaks.
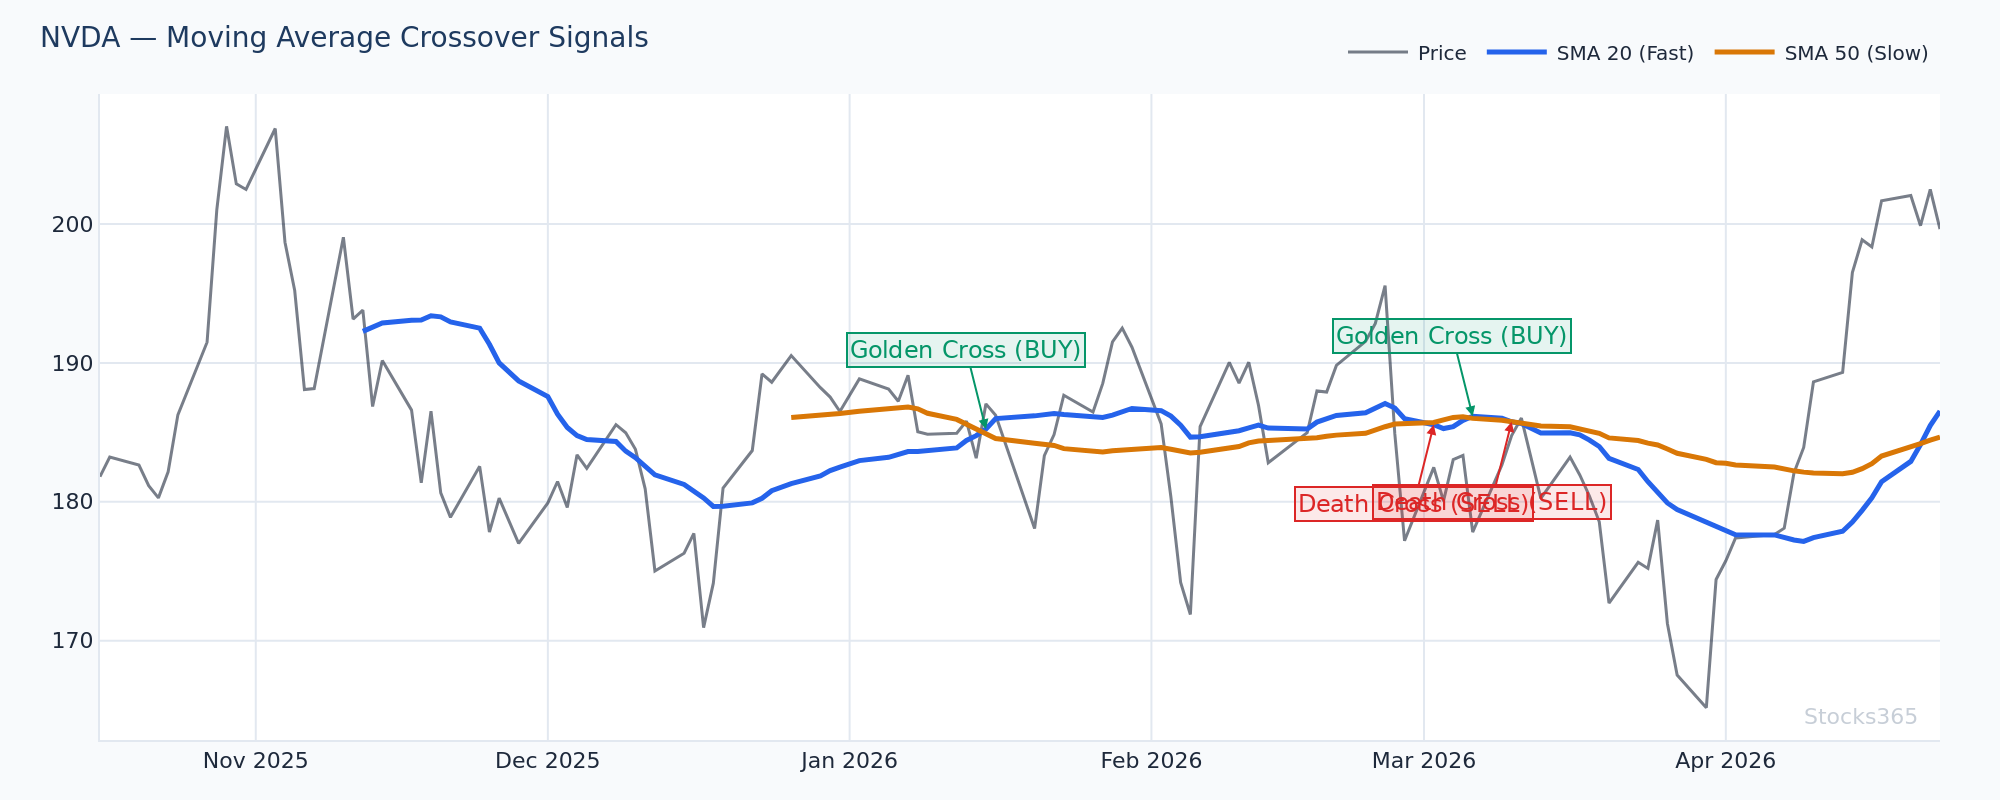
When the 50 DMA crosses above the 200 DMA, the most reliable follow-through entries come on the first pullback back to either moving average — not on the cross itself. Watch for that first test of the 200 DMA after the Golden Cross: if price holds and RSI stays above 45, the trend is likely establishing. A clean break back below the 200 DMA on strong volume negates the Golden Cross entirely.
The 200-Day Moving Average Across Asset Classes
The 200-day moving average doesn't perform equally across all markets. Equities — particularly large-cap stocks and major indices — show the most consistent 200 DMA respect. The logic is institutional: fund managers benchmark against indices, and the 200 DMA is a widely used risk management threshold.
Forex markets are messier. Currency pairs can chop around the 200 DMA for extended periods without clean trending behavior. Commodities sit in the middle — trend-following works well in commodities, but supply/demand shocks can override technical levels violently.
Crypto is a unique case. Volatility is extreme. The 200-day moving average still functions as a regime indicator in crypto, but the crosses are sharper and the reversals more violent. Expect wider swings around the level.
Stocks365 research across 11,597 signals found that trend-following signals using ADX confirmation achieved a 54.8% win rate in commodities — but only 36.1% in crypto over a 10-day holding period. This gap illustrates exactly why the 200-day moving average works differently depending on the asset class you're trading. See the full breakdown at Stocks365 Insights.
Practical 200-Day Moving Average Trading Setups
Setup 1: The Pullback to 200 DMA in an Uptrend
Price has been above the 200-day moving average for several months. A correction pulls price back toward the 200 DMA. Volume on the decline is below average (normal profit-taking, not distribution). RSI drops to the 40-50 zone — oversold for a strong trend but not catastrophically so. Price forms a reversal candle pattern at or near the 200 DMA.
Entry: On the close of the reversal candle or the open of the next session. Stop: Below the 200 DMA by at least 1 ATR to avoid normal noise. Target: The prior high or a measured move based on the depth of the pullback.
This is clean. This is high probability. This is what institutional buyers wait for.
Setup 2: The 200 DMA Breakdown Retest Short
Price breaks below the 200-day moving average on elevated volume. The first break often sees a sharp move lower, then a dead-cat bounce. That bounce rallies back up toward the 200 DMA. Volume on the rally is weak. RSI recovers but fails to reclaim 50. Price stalls at or just below the 200 DMA.
Entry: Short on the failure candle at the 200 DMA retest. Stop: Above the 200 DMA by 1 ATR. Target: The next significant support level or a measured move equal to the breakdown range.
Patience is the edge here. Wait for the retest. Most beginners chase the initial breakdown — professionals wait for price to come to them.
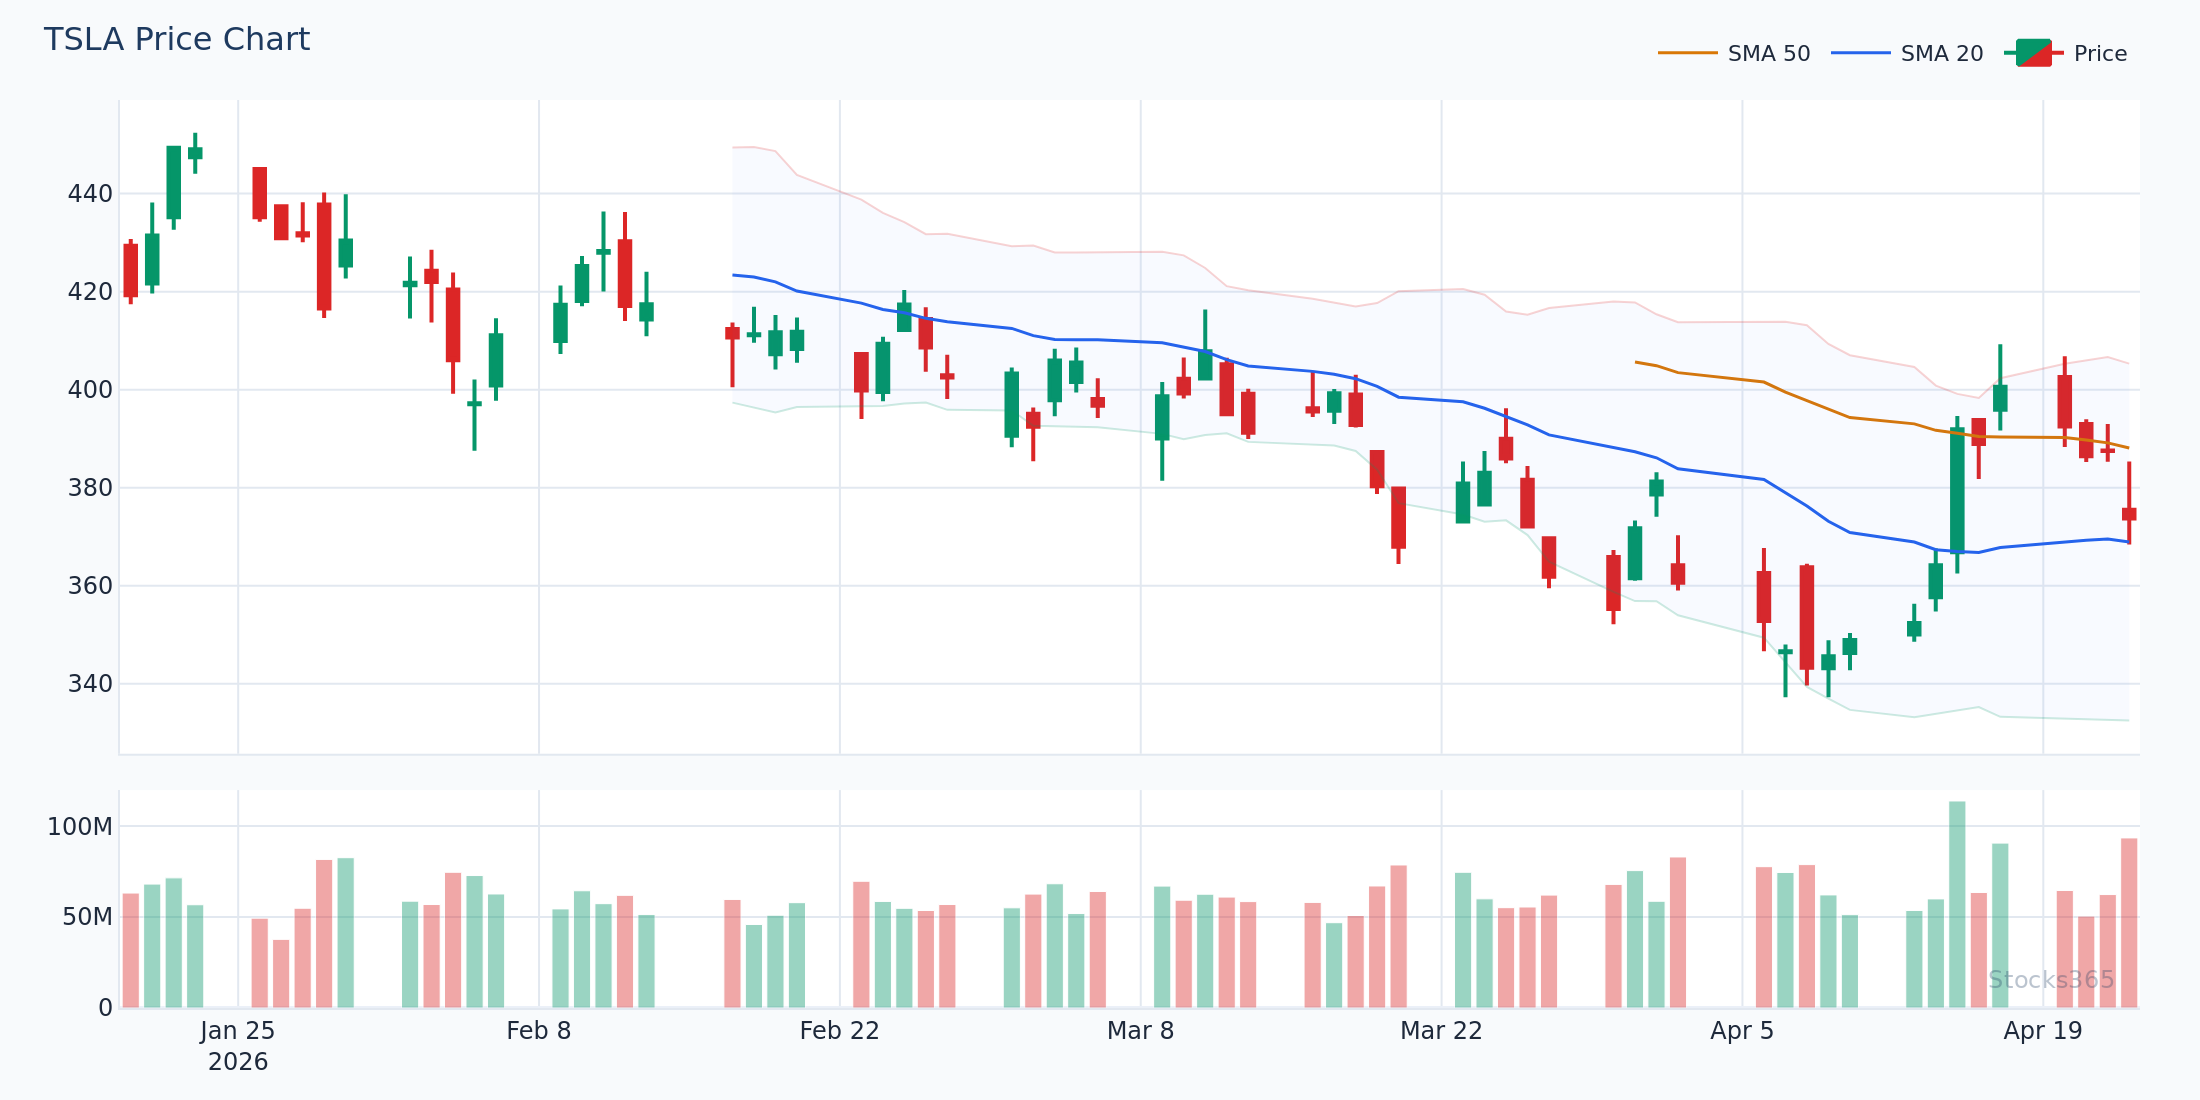
This setup illustrates the ideal pullback-to-200 DMA structure. The key observation: the pullback candles show decreasing range and volume as price approaches the 200 DMA, indicating sellers are losing momentum. The confirmation candle — typically a strong-bodied bullish close with above-average volume — is the trigger. If the next day opens weak and price falls back through the 200 DMA, the setup is invalidated and the stop is hit cleanly.
Setup 3: The 200 DMA Slope Filter
The direction and slope of the 200-day moving average itself is critical information. A rising 200 DMA means long-term buyers are in control and have been for months. A flat 200 DMA means the market is transitioning — be cautious. A declining 200 DMA means sellers have dominated for an extended period.
Only take long trades when the 200 DMA is rising. Only take short trades when it's declining. When it's flat, reduce position size and be prepared for whipsaw. This one filter alone removes a large category of losing trades.
200-Day Moving Average and Market Regimes
Markets operate in regimes: trending or ranging. The 200-day moving average is fundamentally a trending-regime tool. In ranging markets, price crosses the 200 DMA repeatedly, generating false signals in both directions. Losses stack up quickly for trend followers.
Identifying the regime before applying the 200 DMA filter is essential. ADX above 25 indicates trending conditions where the 200 DMA works well. ADX below 20 signals a ranging market where momentum indicators like RSI divergence are more useful. For regime-aware trading, explore how RSI divergence signals complement trend-following tools in non-trending conditions.
Regime awareness isn't optional. It's the difference between a 55% win rate and a 42% win rate over time.
Our analysis of 1,474 signals shows that regime-aware trend entry strategies achieve a 64.5% win rate in commodities — but that rate collapses to 32.5% in crypto. The lesson: even a structurally sound strategy like 200-DMA trend filtering needs to be calibrated to the asset and its volatility characteristics. Full data available at Stocks365 Insights.
What to Watch For
- Pullback-to-200 DMA during established uptrends: When price corrects back toward the 200 DMA after a multi-month rally, watch for low-volume pullbacks followed by a reversal candle with RSI holding above 40. These entries offer defined risk and strong reward-to-risk ratios — the stop sits just below the 200 DMA.
- Failed retests after 200 DMA breakdowns: When price reclaims the underside of the 200 DMA on weak volume and RSI can't push above 50, the rejection sets up a short entry. The trade is entering as price rolls back below the 200 DMA, with the stop just above the retest high.
- Golden Cross setups with first-pullback confirmation: After the 50 DMA crosses above the 200 DMA, the highest-probability long entry is the first significant pullback to the 200 DMA that holds. Don't chase the cross — wait for price to come back to the level and confirm support.
- Declining 200 DMA slope as a regime warning: When the 200-day moving average shifts from rising to flat to declining, that slope change is an early warning to reduce long exposure — even before price definitively breaks below it. Slope matters as much as the level.
- 200 DMA + RSI overbought divergence in late-stage trends: When price makes new highs above a rising 200 DMA but RSI shows a lower high, a distribution phase may be beginning. This combination — with detailed pattern analysis — is explored in our guide on hidden RSI divergence signals.
Key Takeaways
📊 200-Day Moving Average — What You Need to Remember
- The 200-day moving average is a trend filter, not a trade trigger. Use it to define direction, then find entries with separate tools.
- Price above a rising 200 DMA = bullish regime. Price below a declining 200 DMA = bearish regime. Everything else is transitional.
- The best entries come on pullbacks to the 200 DMA, not on the cross itself. Wait for confirmation.
- Volume confirms the move. A 200 DMA break on weak volume is suspect. A break on 2x average volume is real.
- Combine with RSI to time entries within the trend — use RSI overbought and oversold levels to find precise entry zones on 200 DMA pullbacks.
- Regime matters. In ranging markets, the 200 DMA generates false signals. Check ADX before applying the filter.
- The slope of the 200 DMA reveals trend strength. Rising = strong bull. Flat = caution. Declining = bear in control.
How Stocks365 Uses This
🔬 How Stocks365 Integrates the 200-Day Moving AverageAt Stocks365, the 200-day moving average is one of 12+ indicators that feed into our proprietary Trust Score system. Specifically, it contributes to the regime scoring layer — the component that determines whether market conditions are conducive to trend-following or mean-reversion signals.
When price is above a rising 200 DMA, our system assigns a bullish regime classification to that instrument. This boosts the Trust Score weighting for trend-aligned signals and suppresses mean-reversion signals in the opposite direction. When price trades below a declining 200 DMA, the regime shifts bearish and signal logic adjusts accordingly.
The 200 DMA slope is evaluated in combination with ADX readings, volume characteristics, and sector-relative performance to produce a composite regime confidence score. A signal that aligns with a strong 200 DMA trend in a high-ADX environment receives a materially higher Trust Score than the same signal in a flat, choppy market.
You can see which stocks currently have high Trust Scores and their 200 DMA relationship directly on the Stocks365 dashboard — including individual stock signals like the AAPL signal page.