
What Is the 20-Day EMA and Why Traders Swear By It
The 20-day exponential moving average is one of the most widely watched technical levels in short-term trading. Unlike its simpler cousin, the 20-day simple moving average, the EMA places heavier weight on recent price data. That responsiveness is everything when markets move fast.
React faster. Signal earlier. That's the edge.
The formula prioritizes recent closes, meaning the 20-day EMA bends toward current price action before the SMA does. For swing traders and active investors operating on daily or weekly charts, this responsiveness makes a real difference in entry timing and trade management.
In 2026, with algorithmic trading dominating intraday flows, the 20-day EMA has become even more significant — not because retail traders invented it, but because institutional systems reference it constantly. When algos and discretionary traders both watch the same level, the level matters.
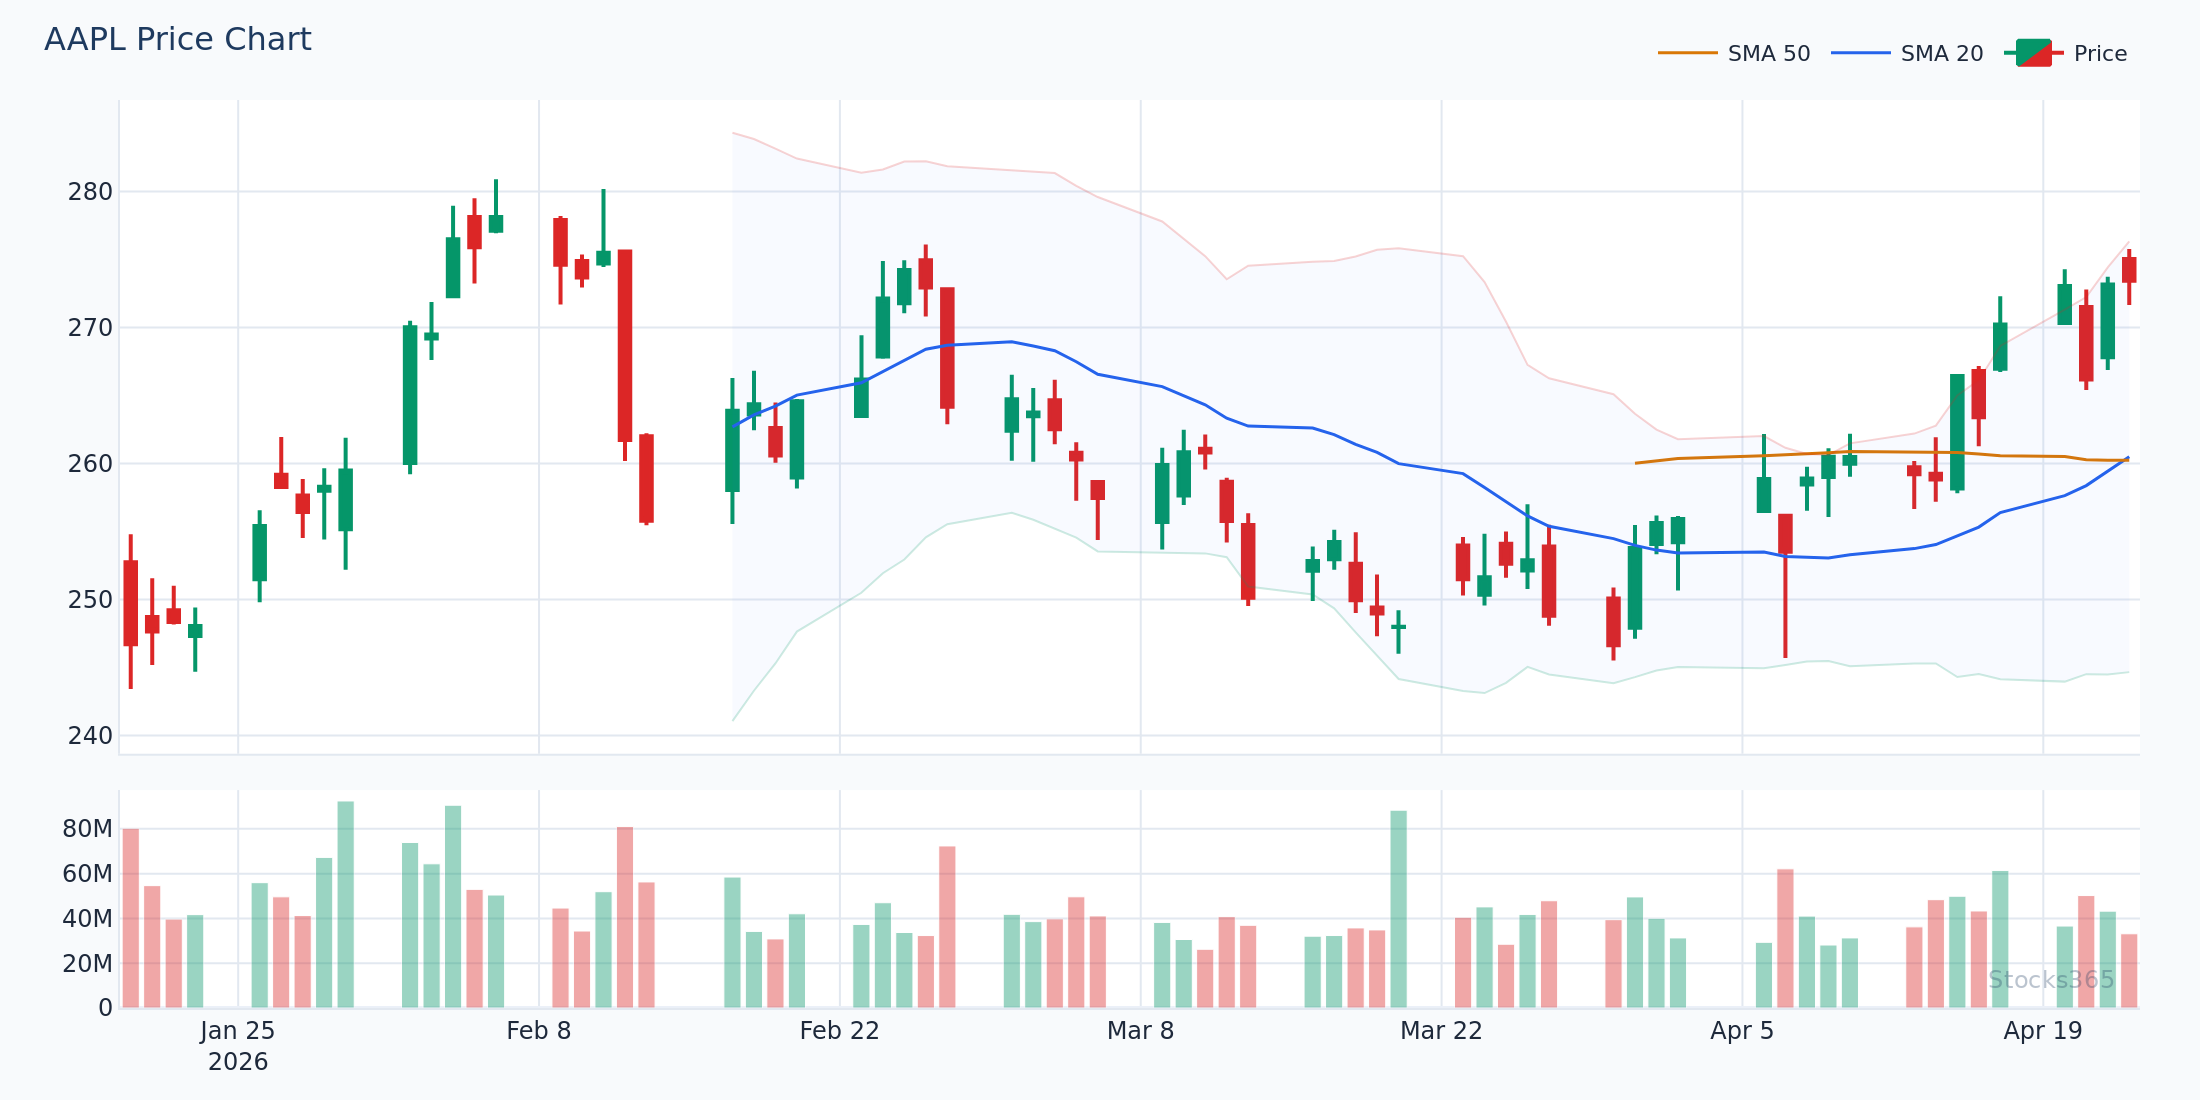
This chart shows price repeatedly bouncing from the rising 20-day EMA during an established uptrend. Each pullback to the EMA attracts buyers, and price resumes higher within 1-3 candles. A close decisively below the EMA — especially on elevated volume — is the first signal the pattern is breaking down.
How the 20-Day EMA Actually Works: The Math Behind the Signal
You don't need to calculate this by hand. But understanding the mechanics sharpens how you read the signal.
The EMA uses a multiplier: 2 ÷ (period + 1). For a 20-day EMA, that's 2 ÷ 21 = approximately 0.0952. Each new EMA value equals:
EMA = (Current Close × 0.0952) + (Previous EMA × 0.9048)
The result: recent price gets roughly 9.5% of the weighting in every new calculation. Yesterday's EMA carries the rest. This creates a line that follows price more closely than a simple average — but still smooths out the daily noise that trips up amateur traders.
Compare it to the 50-day or 200-day EMA and the difference is dramatic. The 20-day EMA reacts to a two-week selloff. The 200-day barely flinches. That's why short-term traders live on the 20-day while long-term investors watch the 200-day.
The Core 20-Day EMA Trading Setups That Actually Work
Setup 1: The EMA Pullback in an Uptrend
This is the bread-and-butter setup. Price trends higher. It pulls back to touch or slightly pierce the 20-day EMA. Then buyers step in and price resumes the uptrend.
The key isn't just the touch — it's confirmation. Look for:
- A bullish engulfing or hammer candle at the EMA
- Volume declining on the pullback and expanding on the bounce
- RSI holding above 40 throughout the pullback — not collapsing toward oversold
- The EMA itself still sloping upward
When all four align, the setup has real conviction behind it. Miss one, the odds still favor you. Miss three, pass the trade.
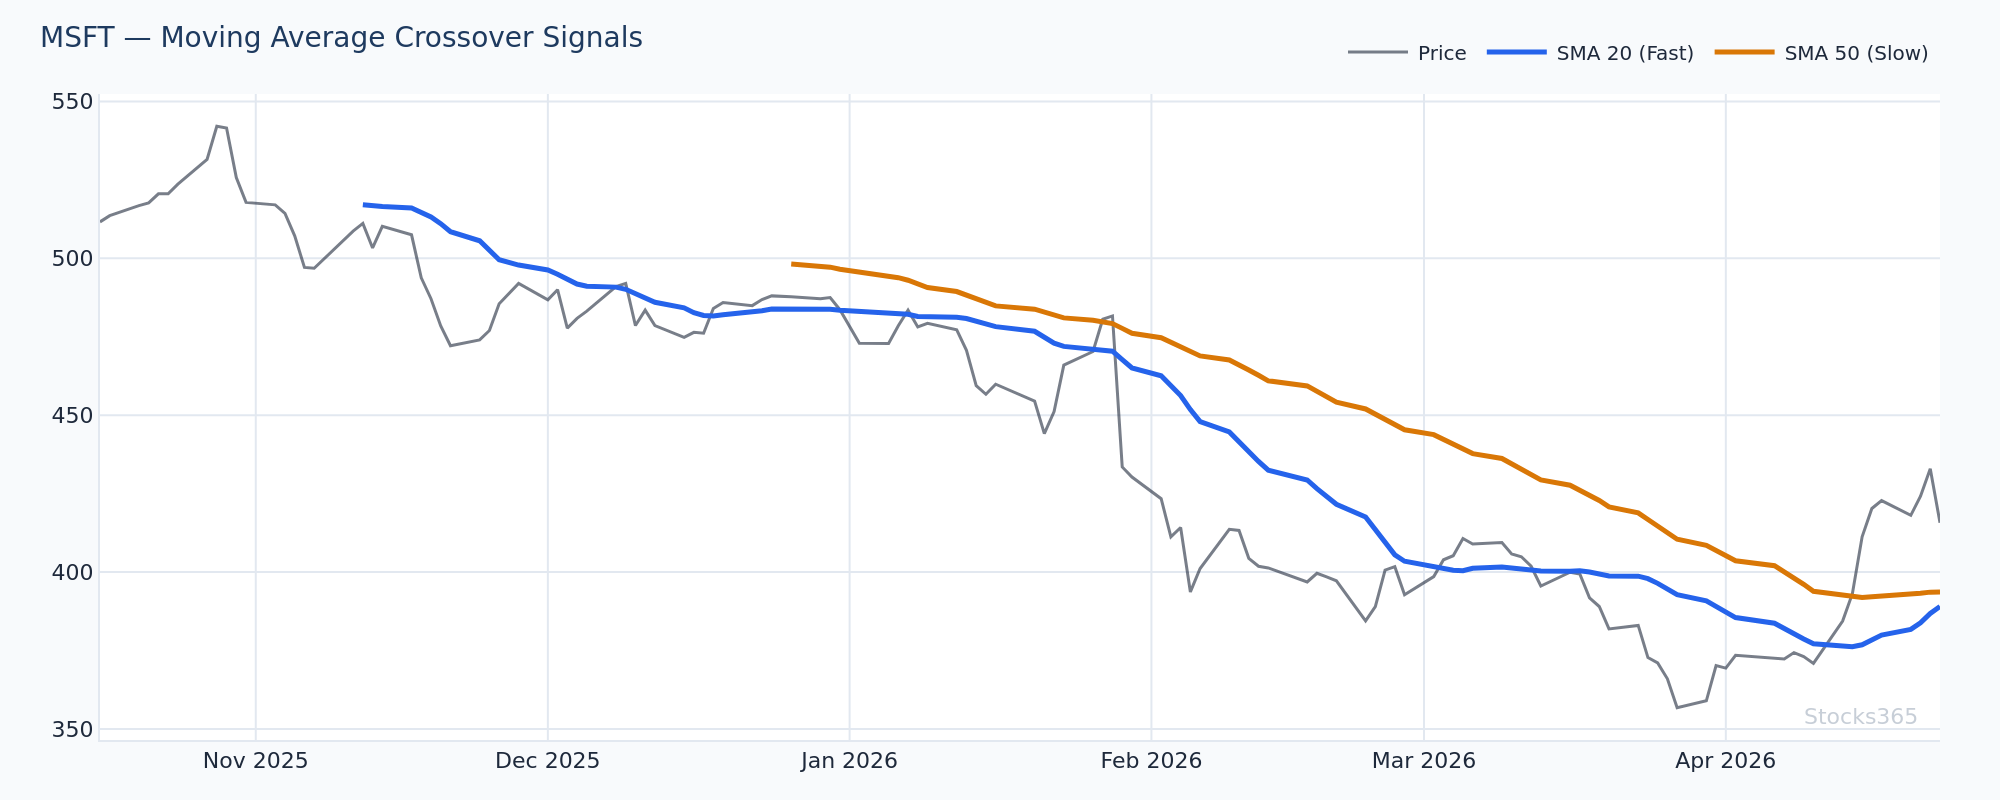
Here you can see MSFT pulling back into the 20-day EMA after an extended run higher. Volume contracted during the three-day pullback, then expanded sharply on the bounce candle. This volume confirmation distinguishes a genuine EMA bounce from a dead-cat pattern that continues lower.
Setup 2: The EMA Crossover as Trend Change Signal
When price crosses above the 20-day EMA after trading below it, something is shifting. The signal strengthens when:
- The cross happens on above-average volume
- The EMA itself starts flattening or turning upward after the cross
- Price closes — not just touches — above the EMA on the daily chart
- A higher low forms before the cross occurs
Crossovers on low volume in choppy markets produce false signals constantly. Volume is the filter that separates signal from noise.
Setup 3: EMA as Dynamic Resistance in Downtrends
The same line that acts as support in uptrends becomes resistance in downtrends. This is the mirror trade — and it works just as reliably.
Price breaks below the 20-day EMA. Sellers push lower. Price rallies back to test the underside of the EMA. Sellers defend that level. Price resumes lower.
Short traders and put buyers watch these EMA retests carefully. The EMA retest in a downtrend is often the cleanest risk-defined entry — with a stop just above the EMA for defined risk.
Here's What Most Traders Get Wrong About the 20-Day EMA
Most traders treat a price touch of the 20-day EMA as an automatic buy signal. In trending markets, that works. But when applied in choppy, sideways conditions, the same setup generates loss after loss — and traders abandon the indicator entirely, blaming the tool rather than the market regime.
The 20-day EMA is a trend-following tool. It performs in trending markets. It fails in range-bound ones. Before applying any EMA setup, confirm the regime first. A rising EMA with price consistently above it signals a trend worth trading. A flat, whipsawing EMA that price crosses repeatedly signals a range — and the right response is to step aside or switch tools entirely, not keep buying touches.
Check regime before entry. Always.
Combining the 20-Day EMA With RSI for Higher-Probability Trades
The 20-day EMA tells you where price is relative to recent history. RSI tells you how fast it got there and whether momentum supports continuation. Together, they filter out a large percentage of low-quality setups.
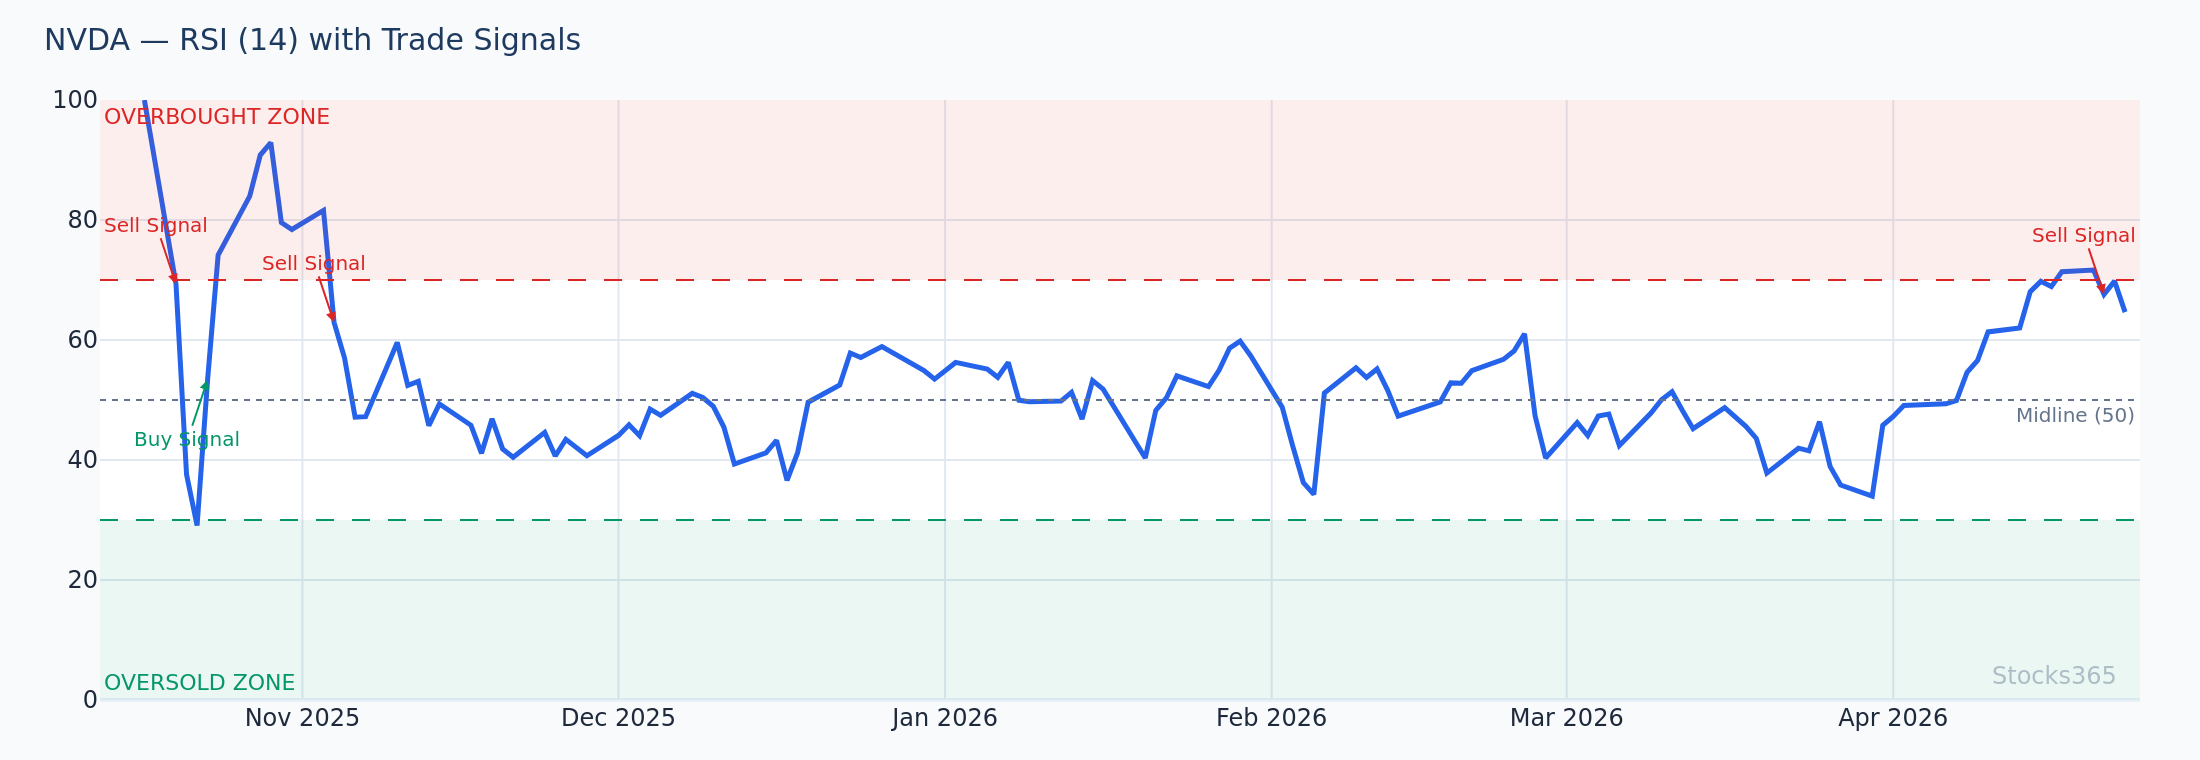
This chart overlays RSI beneath the NVDA price action with the 20-day EMA plotted on price. Notice how the strongest EMA bounces occur when RSI is between 40 and 60 on the pullback — not yet oversold, but cooled enough to support a fresh move. When RSI reaches 70+ and price simultaneously touches the EMA, the bounce is weaker and more likely to fail.
The combination creates a two-condition entry requirement:
- Condition 1: Price touches or slightly undershoots the 20-day EMA in an uptrend
- Condition 2: RSI is in the 35-55 range on the pullback, not collapsed below 30
Both conditions met? The setup is high quality. One condition met? It's marginal. Neither? Stay out.
For a deeper understanding of how RSI levels work across different market conditions, the RSI Overbought and Oversold Levels guide breaks down exactly which readings carry the most weight in trending versus ranging environments.
RSI divergence adds another layer. When price pulls back to the 20-day EMA and makes a lower low, but RSI makes a higher low — that's a bullish divergence at a key technical level. That specific convergence of signals is among the highest-conviction setups in short-term trading. Learn more in the RSI Divergence Explained guide.
The 20-Day EMA Across Different Timeframes
Daily Chart: The Primary Trading Timeframe
The daily chart is where the 20-day EMA shines brightest. It captures approximately one calendar month of trading data, aligning naturally with options expiration cycles, earnings windows, and institutional rebalancing periods. Most professional swing traders use the daily chart as their primary decision-making frame.
Weekly Chart: Catching the Bigger Moves
On the weekly chart, the 20-week EMA represents nearly five months of price history. When weekly price action holds above a rising 20-week EMA, the underlying trend is intact and powerful. Pullbacks to this level on the weekly chart often precede some of the cleanest, largest directional moves.
Intraday Charts: Different Animal
On 5-minute or 15-minute charts, the 20-period EMA functions similarly — but the noise level increases dramatically. False signals multiply. The setup still works, but requires tighter filters and faster execution. Most professional day traders pair intraday EMA signals with volume profile and order flow data, not just price alone.
20-Day EMA vs 20-Day SMA: Which One Should You Use?
Both track 20 periods of price data. The difference is weighting.
- 20-Day SMA: Equal weight to all 20 closes. Slower to react. Smoother line. More lag.
- 20-Day EMA: Front-weighted. Reacts faster. Tighter to price. Less lag — but more false signals in chop.
For short-term 20 day EMA trading, the EMA wins on responsiveness. In volatile, fast-moving markets, being early to the signal matters. For position traders operating on monthly timeframes, the SMA's smoothness can actually be an advantage — filtering out whipsaws that would shake out an EMA follower.
The right answer depends on your holding period and risk tolerance. Most swing traders default to EMA. Most position traders default to SMA. Know which trader you are.
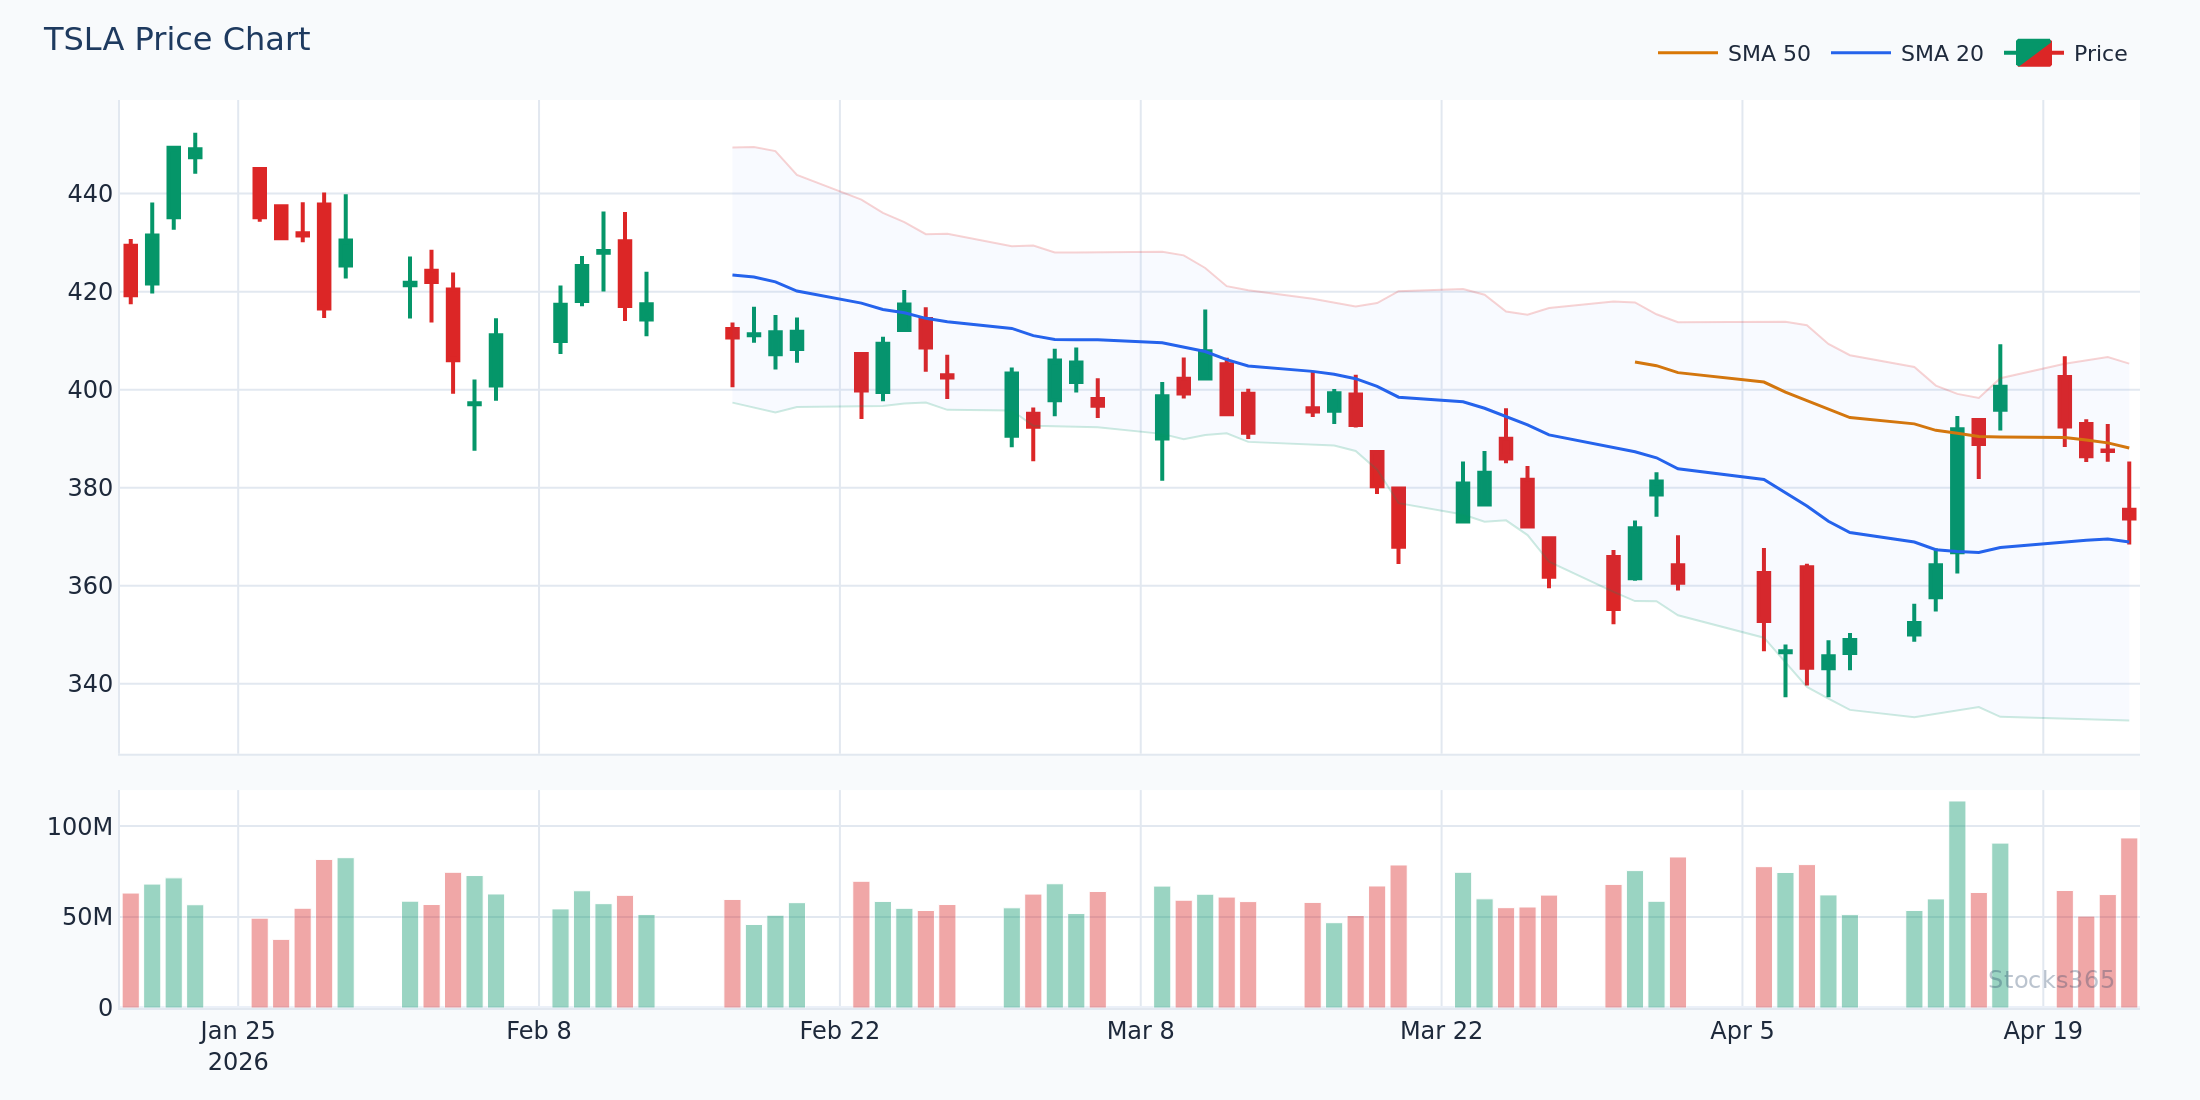
This comparison chart shows both the 20-day EMA and 20-day SMA plotted on TSLA during a high-volatility period. The EMA reacted to the sharp selloff several candles before the SMA, giving EMA traders an earlier warning signal. However, the EMA also generated a brief false buy signal during the bounce before the decline resumed — showing both the advantage and the tradeoff of faster reaction time.
Advanced 20-Day EMA Concepts for Serious Traders
EMA Slope as Trend Strength Indicator
The angle of the 20-day EMA matters as much as where price sits relative to it. A steeply rising EMA with price well above it signals a strong, momentum-driven trend. A flat or barely-sloping EMA signals uncertainty. A declining EMA confirms distribution.
Slope changes often precede price reversals by several days. Watch for the EMA to flatten after a sustained move — it frequently signals exhaustion before price actually reverses.
EMA Cluster Levels
When the 20-day EMA converges with the 50-day EMA, the resulting cluster becomes a powerful technical magnet. Price is drawn to these convergence zones, and breakouts from them carry significant momentum. The narrower the EMA cluster, the more explosive the subsequent move tends to be.
This concept mirrors Bollinger Band squeezes — compressed volatility preceding expansion. When EMAs converge and the bands tighten simultaneously, the resulting breakout often generates 2-3 ATR moves in the breakout direction.
Gap Fills and EMA
When a stock gaps above its 20-day EMA on earnings or news, the gap often acts as support on subsequent pullbacks — until it doesn't. A close below the gap fill and the EMA together is a double-confirmation warning sign that deserves attention.
For traders who want to understand how multiple indicators interact to produce reliable signals, the complete RSI trading guide explains how momentum readings pair with price structure for higher-probability decisions.
Real-World 20-Day EMA Trading Examples: Patterns and Setups
The Bounce Play: What It Looks Like
Picture this setup: a large-cap tech stock has been trending higher for six weeks. Price pulls back over four days on declining volume. The pullback reaches the 20-day EMA. A doji or hammer forms at that level. The next day, price gaps up slightly and closes near its high. Volume on that candle is 1.5 to 2 times the average daily volume.
That's the textbook bounce setup. Entry is on the break of the hammer's high or on the second confirming candle. Stop goes just below the EMA or below the low of the pullback. Target is the previous swing high.
The Failed EMA Retest: The Short Setup
A stock breaks down through its 20-day EMA on heavy volume. Over the next three days, price rallies back to test the underside of the EMA. On the third day of the rally, a bearish engulfing candle forms right at the EMA. Volume picks up on the down day. RSI approaches but fails to reach 50 on the retest.
That's the EMA retest rejection. Short entry is on the break of the engulfing candle's low. Stop sits just above the EMA. The failed retest often leads to a move that extends significantly below the initial breakdown level.
Understanding momentum signals is critical here. The RSI settings guide covers which RSI period works best for identifying momentum exhaustion at EMA levels across different trading styles.
What to Watch For
- EMA + Volume Surge Breakouts: When price breaks above the 20-day EMA on volume that's 2x or more the 20-day average volume — especially after a tight consolidation period — the move tends to extend. The volume is institutional confirmation, not retail chasing.
- EMA Cluster Compression in Large-Cap Tech: When the 20-day and 50-day EMA converge within 1-2% of each other while Bollinger Band width compresses below the 20th percentile, prepare for a directional expansion. Trade the break of the consolidation range, not the compression itself.
- RSI Divergence at EMA Touch: On large-cap stocks and major ETFs, when price makes a lower low that touches the 20-day EMA but RSI prints a higher low simultaneously, the resulting bounce has historically been stronger and faster than standard EMA bounces — typically accelerating within 2-3 sessions.
- EMA Slope Reversal After Extended Trend: When a 20-day EMA that has been rising for 8+ weeks begins to flatten — even while price is still technically above it — a regime change is forming. The flattening often precedes the actual price rollover by 3-7 trading days, giving observant traders an early warning.
- Failed EMA Retests in Downtrending Sectors: In sectors showing relative weakness against the broader market, EMA retests tend to fail more reliably than in strong sectors. A sector ETF that reclaims the 20-day EMA briefly but then closes back below it within 1-2 sessions is a high-conviction continuation short setup.
How Stocks365 Uses This
How Stocks365 Integrates the 20-Day EMA
Stocks365's trust score system evaluates over 12 technical indicators simultaneously to generate confidence-weighted signals for individual stocks. The 20-day EMA is one of the core price structure inputs within the trend regime component of the trust score.
Specifically, the platform calculates whether price is above or below the 20-day EMA, the slope direction of the EMA, and the distance of price from the EMA as a percentage of ATR. These three sub-factors contribute to the overall trend agreement score — one of the primary regime classifications that determines whether the trust score system favors bullish, bearish, or neutral signal weighting for a given stock.
When multiple indicators in the system agree — for example, price above the 20-day EMA, RSI above 50, and rising volume — the trust score elevates, reflecting higher-confidence setup conditions. You can see this in action on the Stocks365 signals dashboard, where trust scores update in real time as market conditions shift.
For stock-specific analysis, individual signal pages like the AAPL signal page display the current EMA positioning, trust score, and multi-indicator agreement status — giving traders a structured, objective view of where each stock stands relative to its key moving averages at any moment.
Key Takeaways
- The 20-day EMA reacts faster than the SMA — making it the preferred tool for short-term swing traders who need early signals.
- EMA pullback bounces work in trending markets — but produce consistent losses in range-bound or choppy conditions. Identify regime first.
- Volume confirms EMA signals — a bounce or breakout without volume expansion is suspect until proven otherwise.
- RSI between 35-55 on a pullback is the optimal momentum reading for high-quality EMA bounce setups in uptrends.
- EMA slope matters as much as price position — a flattening 20-day EMA warns of trend exhaustion before price rolls over.
- Failed EMA retests in downtrends are among the highest-conviction short setups available to technical traders.
- Combine the 20-day EMA with RSI divergence for the highest-probability entries — both tools confirming simultaneously produces the strongest signals.