
What Is the 50-Day Moving Average?
The 50-day moving average is one of the most widely watched technical indicators in trading. It calculates the average closing price of an asset over the past 50 trading sessions, producing a smooth line that filters out short-term noise and reveals the underlying trend direction.
Simple. Powerful. Widely respected.
Unlike shorter-term averages like the 20-day SMA, the 50-day moving average sits in a sweet spot — responsive enough to reflect meaningful trend shifts, but stable enough to avoid triggering false signals on minor fluctuations. Institutional desks, algorithmic systems, and retail traders all watch this level. That collective attention is exactly what gives it weight.
The formula is straightforward: add up the last 50 closing prices and divide by 50. Each new session, the oldest price drops off and the newest gets added. The result is a dynamic line that rises in uptrends, flattens in consolidation, and falls in downtrends.
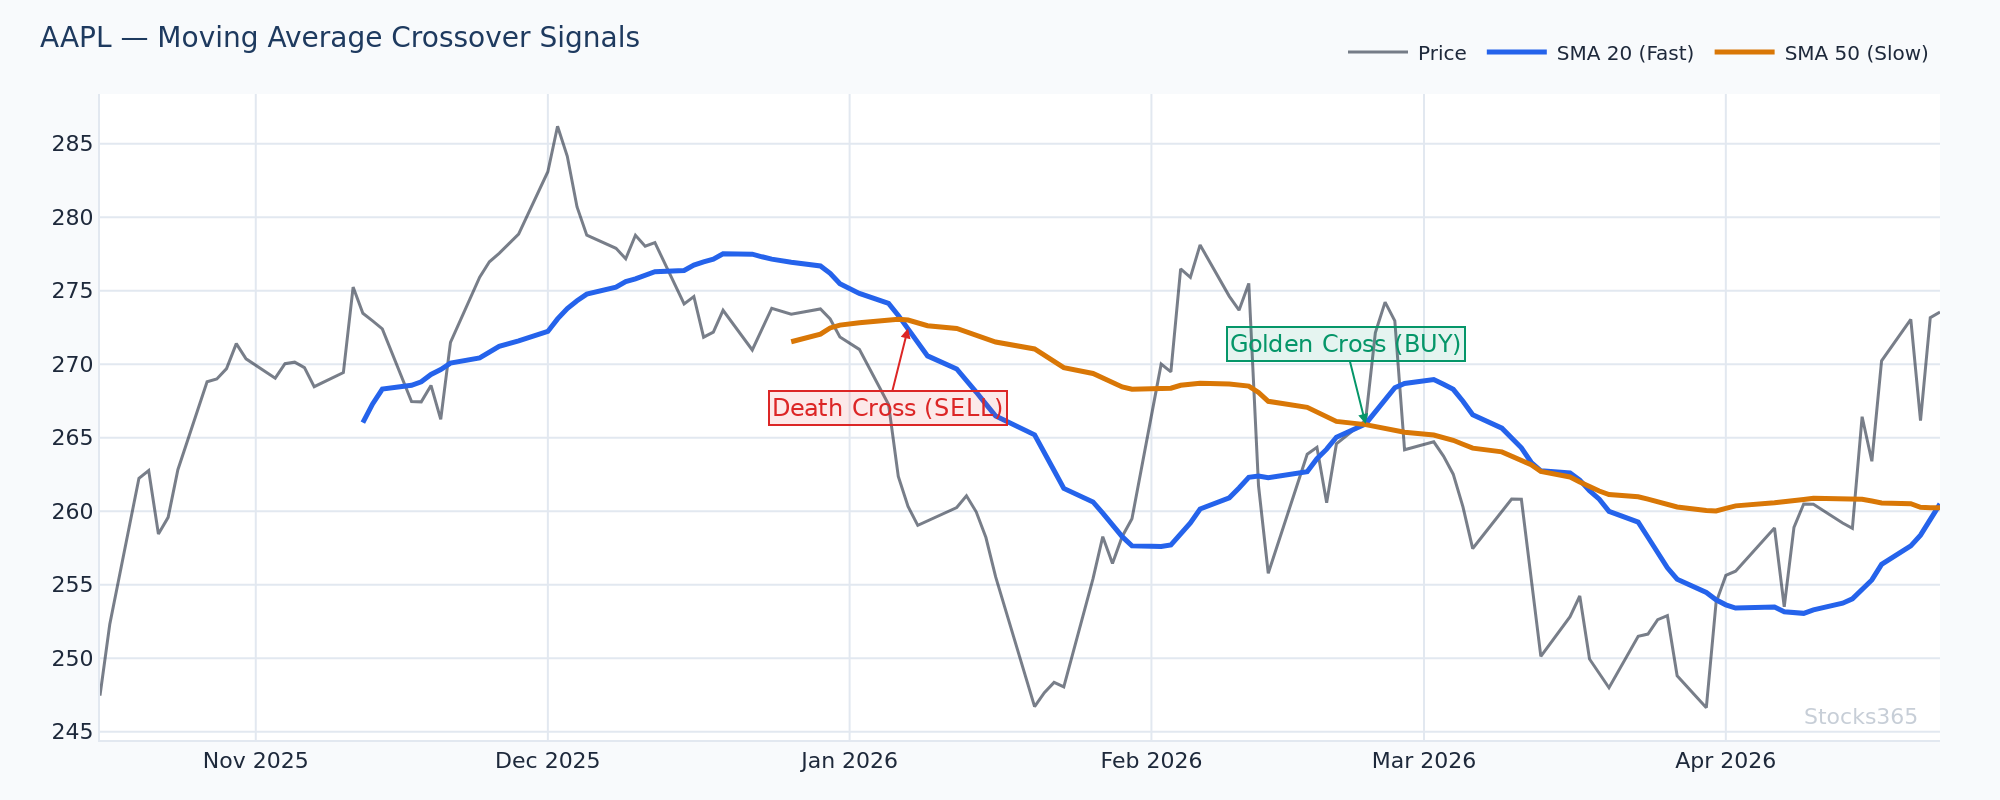
This chart shows AAPL's price action relative to the 50-day moving average, with clear areas where price tested the line as support during an uptrend. When price holds above the 50-SMA after a pullback and volume confirms, the pattern typically resolves with continuation higher. A decisive close below the 50-SMA on elevated volume invalidates the bullish setup and signals potential trend deterioration.
Why the 50-Day Moving Average Works
Markets are driven by participants. When enough participants watch the same level, that level becomes a self-fulfilling focal point. The 50-day moving average is one of the most referenced technical levels across equities, crypto, forex, and commodities.
Beyond psychology, there's structure. The 50-day SMA approximately represents 10 weeks of trading — roughly two and a half months of price history. That window aligns naturally with earnings cycles, quarterly portfolio rebalancing, and macroeconomic reporting calendars. Institutions react to these events. The 50-day moving average captures the resulting momentum shifts.
Three core reasons the 50-day SMA earns its place on every professional chart:
- Trend identification: Price consistently above the 50-SMA signals an established uptrend. Below signals a downtrend or bearish regime.
- Dynamic support and resistance: In trending markets, the 50-SMA acts as a magnet during pullbacks. Price often bounces from this level before resuming the primary trend.
- Signal confluence: The 50-SMA gains power when combined with other indicators — RSI, volume, and candlestick patterns all sharpen the signal quality dramatically.
The 50-Day Moving Average vs. Other Key Moving Averages
Understanding where the 50-day sits in the hierarchy of moving averages matters. Each timeframe serves a distinct purpose, and confusing them costs traders money.
50-Day vs. 20-Day Moving Average
The 20-day SMA reacts faster to price changes. It's ideal for short-term traders who want to ride momentum within a larger trend. The 50-day SMA is slower, more deliberate, and better suited for swing traders who hold positions for several days to several weeks. When both lines slope upward and price sits above them, that confluence strengthens the bullish case considerably.
50-Day vs. 200-Day Moving Average
The 200-day SMA defines the long-term trend. A stock trading above its 200-day SMA is in a structural uptrend. The 50-day SMA operates within that structure, flagging intermediate-term opportunities. The relationship between the two — particularly the Golden Cross (50-day crossing above the 200-day) and Death Cross (50-day crossing below) — generates some of the most widely followed signals in technical analysis.
Here's what most traders get wrong:
Most beginners treat the 50-day moving average as a hard line in the sand — a level price must respect or the trade is done. That's not how it works. In volatile markets, price regularly dips below the 50-SMA by a few percent before snapping back sharply. The edge isn't in treating the line as binary. The edge is watching how price interacts with it — the speed of the break, the volume behind it, and whether it closes decisively below or just wicks through intraday. A closing candle that respects the 50-SMA matters far more than an intraday violation.
How to Trade the 50-Day Moving Average: Core Setups
Theory is only useful if it translates into actionable setups. Here are the setups professional traders actually use.
Setup 1: The Pullback to the 50-SMA in an Uptrend
This is the highest-probability setup built around the 50-day moving average. In a confirmed uptrend — higher highs, higher lows, price above both the 50-SMA and 200-SMA — a pullback to the 50-SMA represents a buying opportunity within the prevailing trend.
What to look for:
- Price pulls back to the 50-SMA after an extended move higher
- Volume contracts during the pullback (low conviction selling)
- A bullish reversal candle forms at or near the 50-SMA (hammer, engulfing, doji reversal)
- RSI pulls back but holds above 40, avoiding oversold territory — a sign trend strength is intact
- Volume expands on the recovery candle, confirming buyer absorption
Entry triggers on the break of the reversal candle's high. The stop sits below the 50-SMA or the swing low of the pullback, whichever is more logical. For deeper guidance on reading RSI signals alongside moving averages, see our guide on RSI Overbought and Oversold Levels.
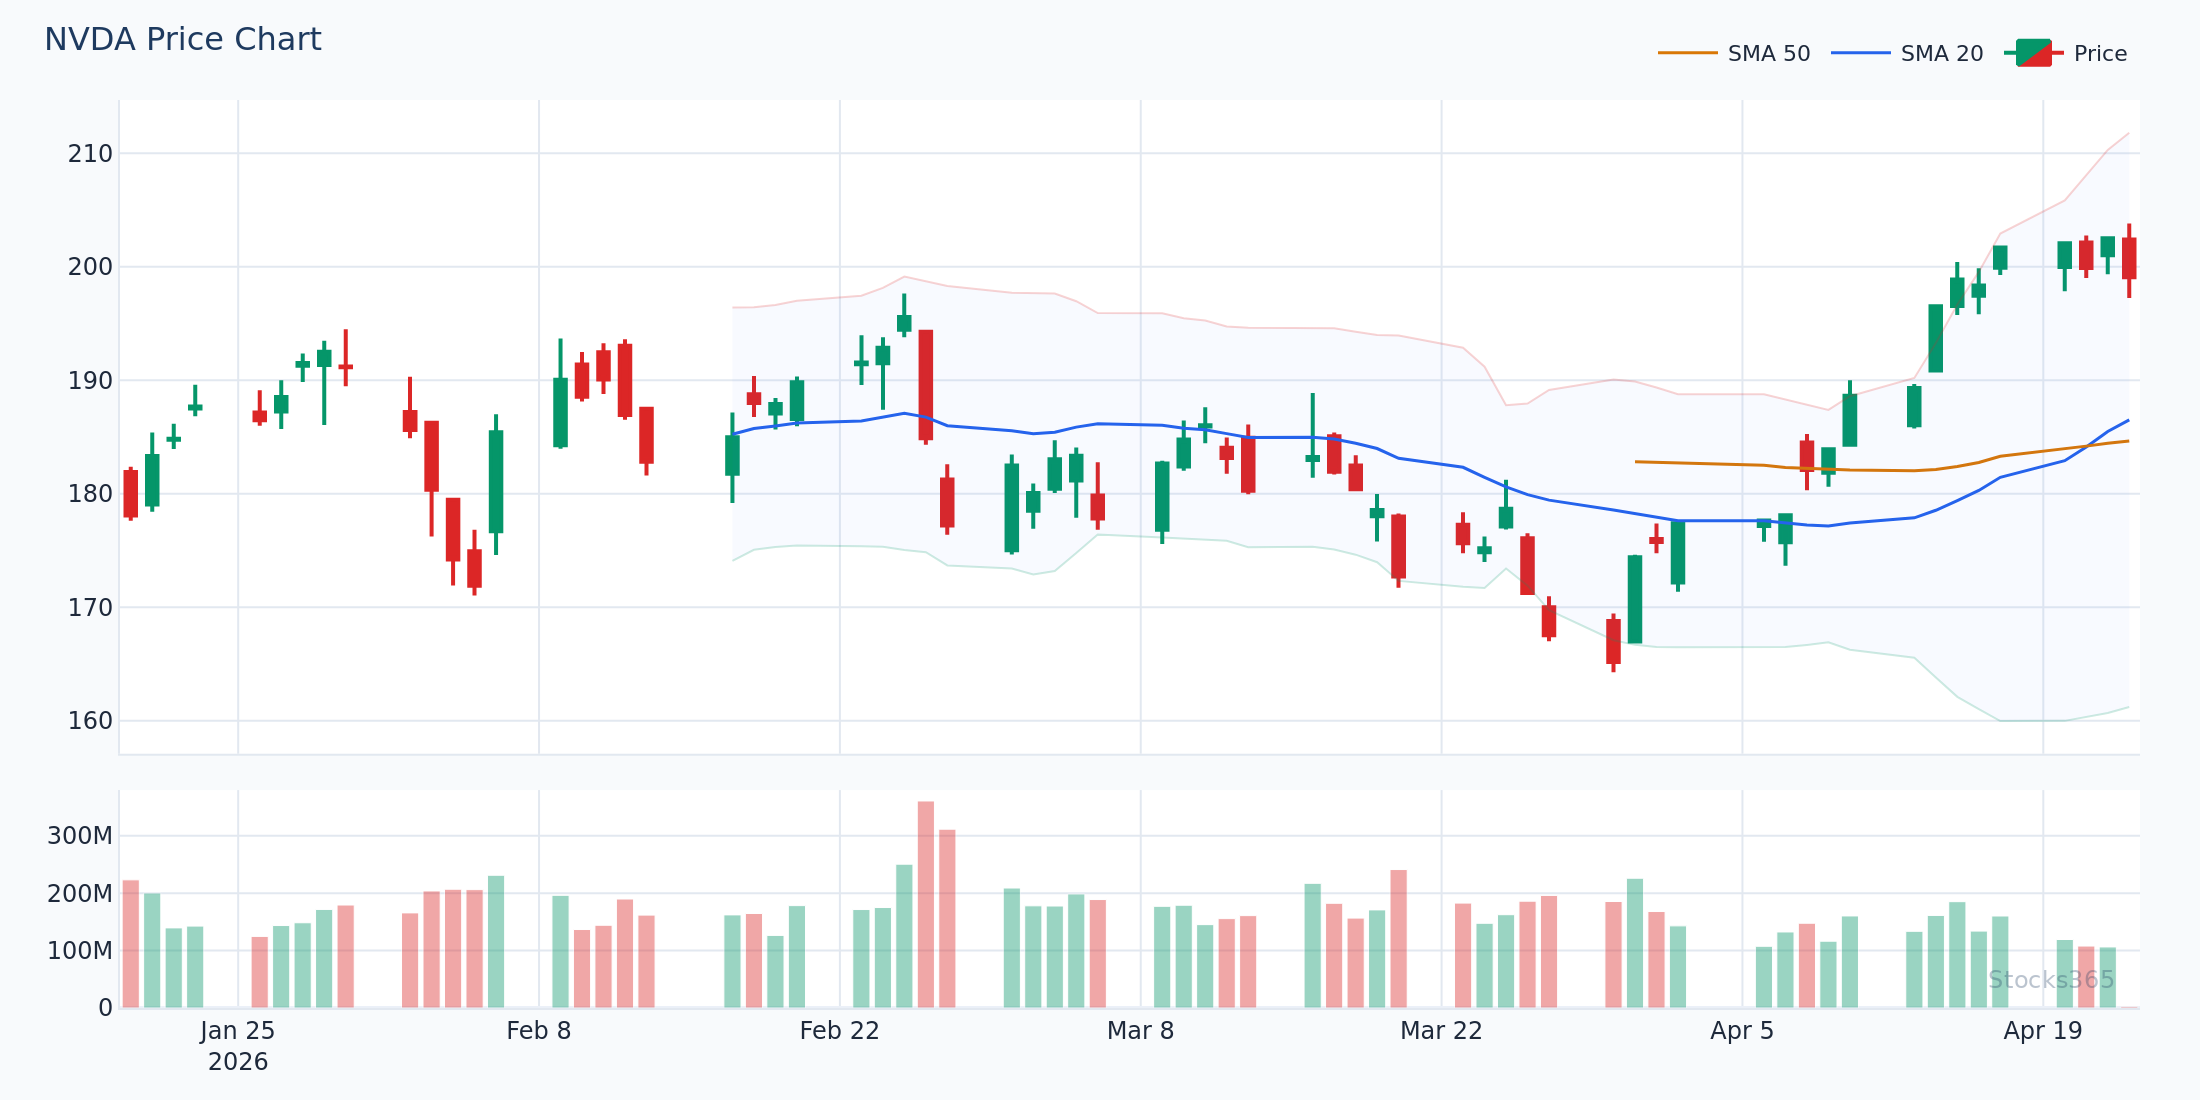
This setup on NVDA illustrates a textbook pullback to the 50-SMA within a broader uptrend, where declining volume during the retreat signaled weak selling pressure. A bullish engulfing candle at the 50-SMA with a volume surge on the recovery bar confirmed buyer interest. A close back below the 50-SMA on significant volume would have invalidated the setup entirely.
Setup 2: The 50-SMA Breakdown and Retest
Breakdowns work in reverse. When price breaks decisively below the 50-day moving average on elevated volume, the level that previously acted as support often flips to resistance. A rally back up to the underside of the 50-SMA — the retest — frequently offers a shorting opportunity.
The pattern unfolds in three stages:
- Break: Price closes below the 50-SMA with volume running above the 20-day average volume
- Pullback: Price rallies back toward the 50-SMA on declining volume
- Rejection: A bearish reversal candle prints at or just below the 50-SMA, confirming the resistance flip
This is one of the cleaner momentum continuation patterns available in technical trading.
Setup 3: The Golden Cross — Intermediate Trend Confirmation
When the 50-day SMA crosses above the 200-day SMA, institutional algorithms recognize the shift. This doesn't signal an immediate explosive move. It confirms that the intermediate-term trend has aligned with the long-term trend — and sustained moves often follow.
The highest-quality Golden Cross setups include:
- Both moving averages sloping upward at the time of the cross
- Price already trading above both lines before the cross completes
- Volume expanding in the sessions following the cross
- RSI in the 50-65 range — enough momentum to sustain the move without being overextended. Learn more about reading RSI context in our complete guide on using RSI in trading.
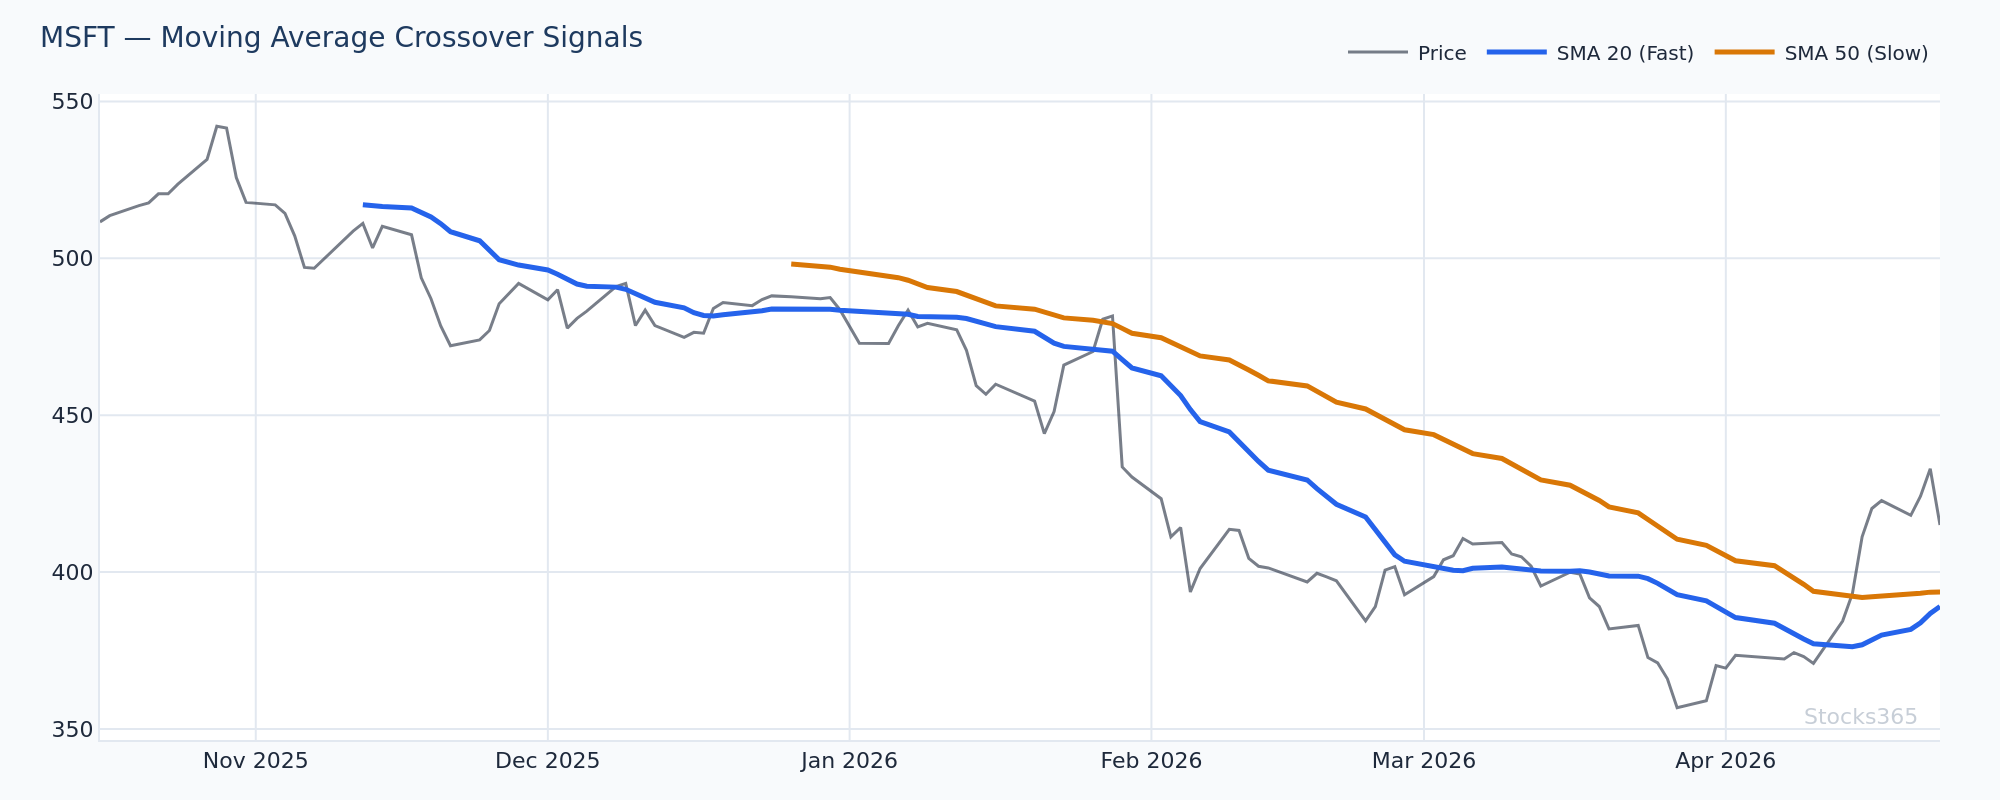
The Golden Cross on MSFT shows the 50-SMA cutting above the 200-SMA while both lines maintained upward slopes, a condition that historically precedes sustained trend continuation rather than false breakouts. Price consolidating above the crossover point before accelerating higher confirms institutional accumulation. A failure of price to hold above the 200-SMA after a Golden Cross is the key invalidation signal to watch.
Setup 4: 50-SMA as Trend Filter for Other Signals
The 50-day moving average doesn't just generate signals — it filters them. Use it as a regime indicator. Only take long setups when price trades above the 50-SMA. Only take short setups when price trades below it. This single filter eliminates a significant portion of counter-trend trades that account for most losing streaks.
Pair this filter with RSI divergence signals for dramatically higher conviction entries. Our article on RSI divergence covers exactly how to identify these high-probability setups when they align with moving average structure.
The 50-Day Moving Average Across Asset Classes
The 50-day moving average works across markets, but its behavior varies. Equities — particularly large-cap stocks — tend to respect the 50-SMA cleanly during trending phases. The level gets tested, buyers step in, and the trend resumes. In crypto markets, volatility is structurally higher, so price violations of the 50-SMA are more frequent and less reliable in isolation.
Context always wins.
Forex pairs often require additional confirmation before treating 50-SMA tests as actionable. Currency markets are heavily influenced by macro events and central bank policy, which can override technical levels abruptly. In commodities, the 50-SMA performs well during trend-following phases but generates more whipsaws during range-bound conditions.
The takeaway: the 50-day moving average is a versatile tool, but calibrating expectations to the asset class prevents overconfidence in the signal.
Combining the 50-Day Moving Average with RSI
Moving averages tell you the trend. Momentum oscillators like RSI tell you the condition of that trend. Together, they form a complete picture.
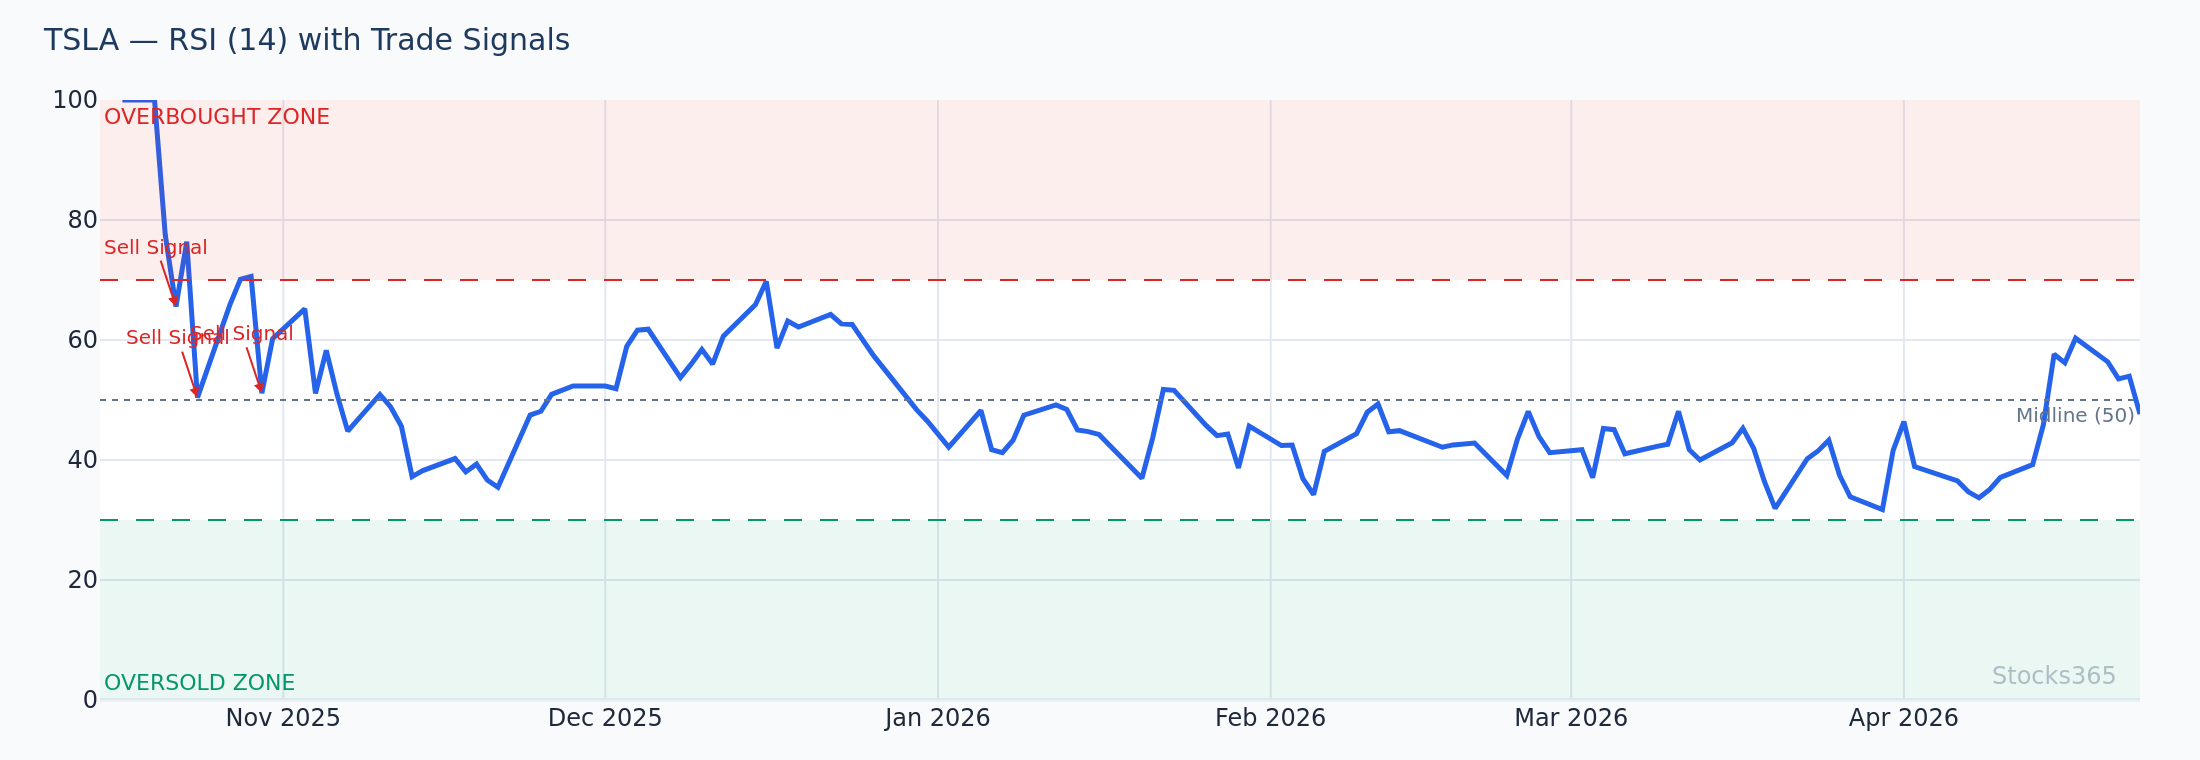
This chart overlays TSLA's 14-period RSI against price action near the 50-SMA, revealing how RSI dropping below 40 during a pullback to the SMA — rather than overshooting into oversold territory — confirmed trend strength and preceded the next leg higher. RSI rebounding above 50 as price reclaimed the 50-SMA provided the final confirmation of renewed momentum. When RSI fails to recover above 50 after a bounce from the 50-SMA, it signals weakening trend conviction and raises the probability of a more significant breakdown.
The most reliable combination plays out like this: price pulls back to the 50-SMA while RSI pulls back to the 40-50 zone (not deeply oversold — that signals too much weakness). A bounce off the 50-SMA accompanied by RSI turning back above 50 gives you dual confirmation. The trend is intact. Momentum is resuming. That's a clean entry.
For traders wanting to go deeper on RSI mechanics, including how the indicator is constructed, our step-by-step RSI calculation guide covers the formula in detail. And if you're optimizing your RSI period settings to complement your moving average strategy, our RSI settings guide is worth reading alongside this one.
50-Day Moving Average: Common Mistakes to Avoid
The 50-SMA is simple enough to misuse. These mistakes show up repeatedly.
- Trading every touch as a signal: Not every test of the 50-SMA produces a tradeable bounce. Confirmation from volume and a reversal candle is non-negotiable.
- Ignoring the broader trend: Buying a 50-SMA test in a downtrend is fighting the tape. The setup has negative expectancy without trend alignment.
- Using it in isolation: The 50-SMA is a filter and a guide. RSI, volume, and price action patterns are what generate entries. Relying on the moving average alone leads to mediocre results.
- Treating intraday breaks as decisive: Closing prices matter. An intraday wick below the 50-SMA that closes back above it often represents a shakeout, not a breakdown.
- Forgetting the slope: A flat 50-SMA signals consolidation, not trend. Only rising or falling 50-SMA slopes carry meaningful directional information.
Stocks365 research across 3,332 signals analyzing price crosses below the SMA 20 shows a 50.9% win rate over a 10-day holding period — with crypto outperforming at 66.8% and forex lagging significantly at 42.5%. See the full breakdown at Stocks365 Insights. The asset class gap is a reminder that moving average signals aren't universally equal — the market you're trading materially changes the expectancy.
Practical Risk Management Around the 50-SMA
Every setup needs a defined invalidation point. With 50-SMA trades, the logic is clean.
For pullback-to-50-SMA long setups, the stop goes below the most recent swing low or below the 50-SMA by a margin that accounts for normal volatility (use ATR to define this buffer — one ATR below the entry candle's low is a widely used standard). If price closes decisively below the 50-SMA after entry, the thesis is wrong. Exit without hesitation.
Position sizing relative to the stop distance keeps drawdowns manageable. No setup justifies oversizing, regardless of how clean the pattern looks. The 50-SMA is a guide, not a guarantee.
What to Watch For
- Watch for 50-SMA reclaims after extended breakdowns: When a stock or index trades below its 50-SMA for several weeks and then reclaims it on a surge in volume, the pattern historically precedes a more sustained recovery. The reclaim candle's close matters more than the intraday cross.
- Monitor RSI divergence at 50-SMA tests: When price retests the 50-SMA for the second or third time but RSI makes a higher low compared to the prior test, hidden bullish divergence is forming. This pattern often precedes the strongest bounces.
- Watch large-cap tech stocks for 50-SMA compression before earnings: When price coils tightly around the 50-SMA in the two to three weeks before an earnings catalyst, the post-earnings directional move tends to use the 50-SMA as the pivot point. A gap above confirms the setup. A gap below accelerates the downside.
- Track Golden Cross setups where the 50-SMA slope is steepening: A Golden Cross where the 50-SMA is accelerating upward — not just crossing flat — carries substantially higher follow-through. Flat crossovers produce more false signals. You can screen for these setups across Stocks365's signals dashboard.
- Watch for Death Cross failures in strong uptrends: When a Death Cross forms but price immediately reclaims the 50-SMA within two to four sessions on heavy volume, the pattern often traps late sellers and produces sharp reversals. This is one of the more contrarian but high-conviction setups in moving average trading.
How Stocks365 Uses the 50-Day Moving Average
At Stocks365, the 50-day moving average is one of more than 12 technical indicators integrated into our proprietary Trust Score system. The 50-SMA contributes primarily to the trend regime component of the score — helping classify whether a given instrument is in a bullish, bearish, or neutral phase at the intermediate-term level.
When price trades above a rising 50-SMA, the Trust Score weights bullish signals more heavily across supporting indicators. When price breaks below a declining 50-SMA, the system shifts weighting toward bearish signal agreement. This regime-aware scoring prevents the system from generating buy signals into deteriorating trends or sell signals during strong uptrends — a common failure mode in single-indicator systems.
For individual instruments, the 50-SMA status is reflected directly in our signal pages — for example, the AAPL signal page shows real-time moving average alignment alongside RSI, volume context, and pattern recognition. Stocks365 research across 3,289 signals on price crosses above the SMA 20 found a 48.3% win rate with a profit factor of 0.88 over 10-day holding periods — with stocks performing best at 52.3%. The full dataset lives at Stocks365 Insights. These numbers reinforce why the Trust Score combines multiple signals rather than acting on any single moving average cross alone.
Key Takeaways
- The 50-day moving average is the most reliable intermediate-term trend indicator available — respected by institutional and retail participants alike.
- The highest-probability setup is a pullback to the 50-SMA in an established uptrend, confirmed by declining volume during the pullback and a bullish reversal candle.
- Use the 50-SMA as a trend filter — only take long setups above it, only take short setups below it. This single rule improves trade expectancy significantly.
- The Golden Cross (50-SMA crossing above 200-SMA) is most reliable when both lines slope upward and price is already trading above the crossover level.
- Combine the 50-SMA with RSI and volume for the highest-quality entries — the moving average identifies the setup, momentum oscillators and volume confirm the timing.
- Closing prices matter more than intraday violations — always wait for the close before acting on a 50-SMA break.
- Asset class matters: moving average signals perform differently in equities, crypto, and forex — calibrate expectations accordingly.