
How to Add Bollinger Bands on TradingView: The Complete 2026 Guide
Bollinger Bands are one of the most powerful volatility indicators on the planet. They show you when markets are coiling for a move — and when they're overextended. TradingView makes adding them simple. Using them well is a different story.
This guide covers everything: how to add Bollinger Bands on TradingView, how to configure the settings, what the signals actually mean, and how to build real trading setups around them.
What Are Bollinger Bands?
Bollinger Bands were developed by John Bollinger in the 1980s. The indicator plots three lines on a price chart: a middle band (a simple moving average), an upper band (middle band + 2 standard deviations), and a lower band (middle band − 2 standard deviations). The bands expand when volatility rises and contract when volatility falls.
That contraction is the signal most traders sleep on.
When the bands squeeze tight, the market is coiling. Energy is building. A breakout is coming — up or down. The bands don't tell you direction, but they do tell you something is about to move.
How to Add Bollinger Bands on TradingView (Step-by-Step)
Adding Bollinger Bands to any chart on TradingView takes under 30 seconds. Here's exactly how to do it.
Method 1: Using the Indicators Menu
- Open TradingView and load any chart (stock, crypto, forex — works on all asset classes).
- Click the "Indicators" button at the top of the chart toolbar (it looks like a flask icon).
- In the search bar that appears, type "Bollinger Bands".
- Select "Bollinger Bands" from the dropdown — it's the built-in TradingView version by TradingView.
- The indicator loads instantly onto your chart. Three lines appear: upper band, middle band (20-SMA), and lower band.
Method 2: Using the Pine Script Search Bar
- Click anywhere on the chart price area.
- Press the "/" key to open the quick search bar.
- Type "BB" or "Bollinger" and select the indicator from results.
Both methods get you to the same place. Method 1 is more reliable on the mobile app.
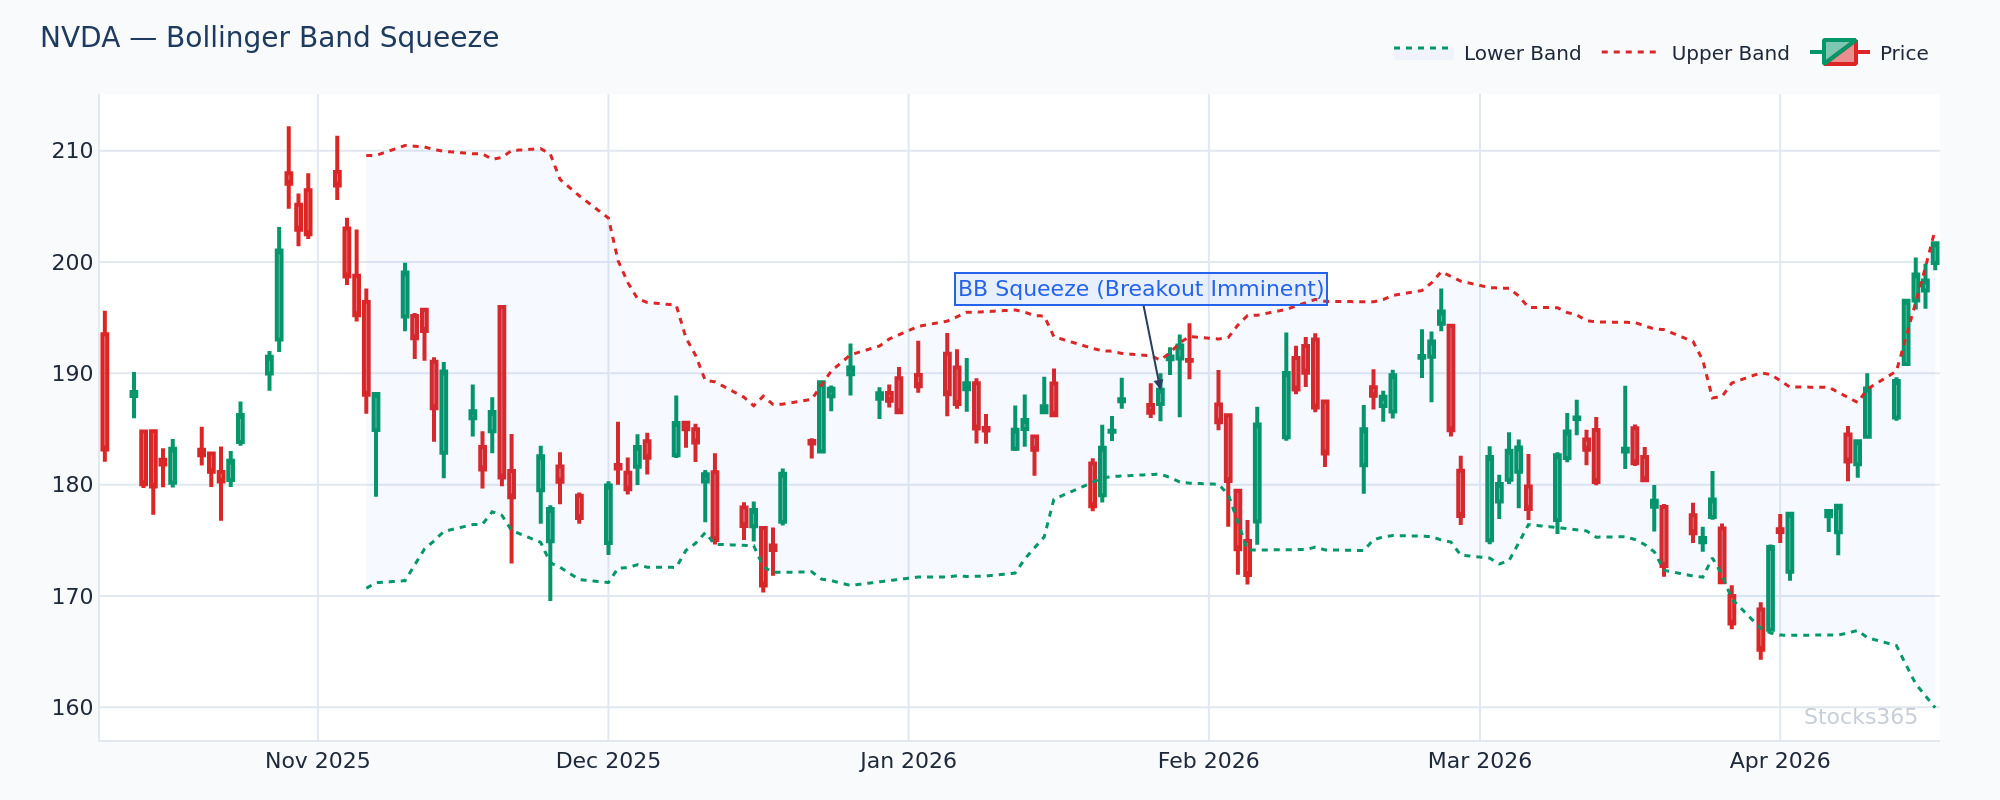
This chart shows NVDA's Bollinger Bands narrowing sharply, with band width compressing toward a multi-week low. This is a classic squeeze setup — price is coiling inside a tightening range. Confirmation comes when price closes decisively outside either band on elevated volume. A false breakout invalidates the setup if price immediately reverses back inside the bands within 1-2 candles.
Bollinger Bands TradingView Settings Explained
Once you've added the indicator, click the gear icon (⚙) next to "BB" in the top-left of the chart to open the settings panel. These are the parameters you control:
Length (Default: 20)
This controls the period of the middle moving average. The default of 20 works well for swing trading on daily charts. Shorter periods (10–14) make the bands more reactive and suit day traders. Longer periods (50) smooth the bands and are better for position traders holding weeks or months.
Source (Default: Close)
This determines which price data feeds into the calculation. Close price is standard. Some traders use HLC3 (high + low + close divided by 3) for a smoother read on volatile assets like crypto.
StdDev Multiplier (Default: 2.0)
This sets how many standard deviations the upper and lower bands sit from the middle. At 2.0, approximately 95% of price action falls within the bands statistically. Increase to 2.5 or 3.0 for highly volatile assets (crypto, small caps). Decrease to 1.5 for tight, low-volatility setups.
MA Type (Default: SMA)
TradingView lets you change the middle band from a simple moving average to an EMA, WMA, or other types. Most traders stick with SMA — it's what Bollinger himself specified. But an EMA-based middle band reacts faster and can suit shorter timeframes.
Visual Settings
You can customize band color, line thickness, and whether to fill the space between bands. A semi-transparent fill between upper and lower bands makes it easier to spot price touching the extremes at a glance.
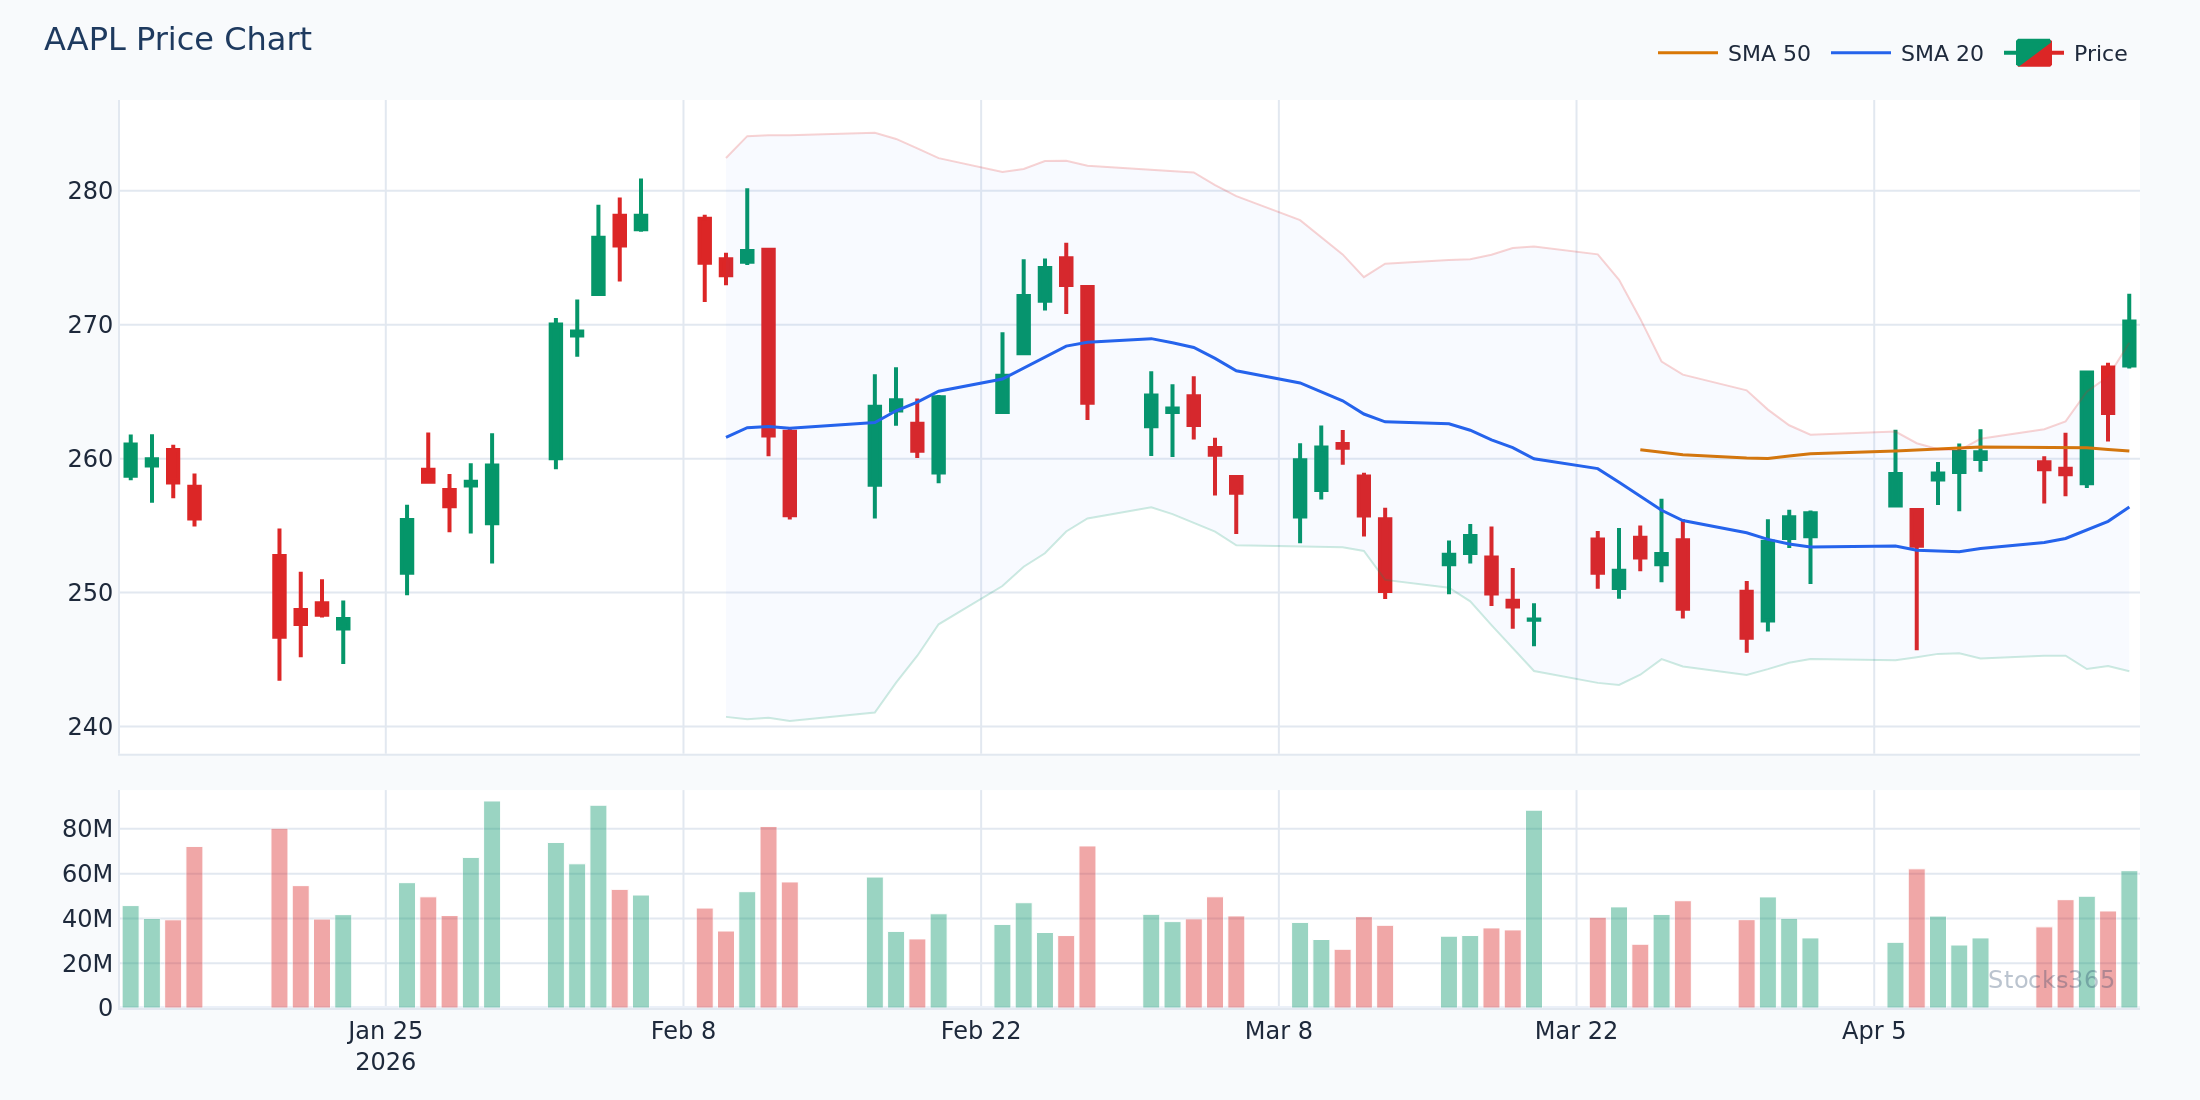
On this AAPL daily chart, price tags the upper Bollinger Band after a multi-day rally, then forms a bearish candle — a classic "Band Touch + Rejection" setup. When price closes back inside the band on the following session, the middle band (20-SMA) becomes the next key target. The setup fails if price continues closing above the upper band for two or more consecutive sessions, signaling a genuine breakout rather than a mean-reversion opportunity.
The Three Core Bollinger Band Setups
Knowing how to add the indicator is the easy part. Here are the setups that actually produce edge.
Setup 1: The Bollinger Squeeze Breakout
When the bands compress to their narrowest point in weeks, price is about to move hard. This is the squeeze. The play: wait for a candle to close outside the band with volume surging above the 20-period average. Enter in the direction of the break. The target is the opposite band. Stop goes just inside the most recent swing low (for longs) or swing high (for shorts).
Watch the width. When band width drops below the 20th percentile of its recent range, you're in squeeze territory.
Setup 2: Band Touch Mean Reversion
In ranging markets, price bounces between the upper and lower bands like a rubber ball. When price touches the upper band, it's statistically overextended. When it touches the lower band, it's oversold. The mean-reversion play targets a return to the middle 20-SMA.
Don't trade this in trending markets. A stock in a strong uptrend walks along the upper band for days. That's not a short signal — it's a continuation signal.
Setup 3: The Double Bottom on the Lower Band (W Pattern)
Price tags the lower Bollinger Band, bounces, pulls back — but the second low stays above the lower band. This divergence shows selling pressure exhausting. When price then crosses back above the middle band (20-SMA), that's your entry trigger. Combine with RSI moving off oversold levels for higher-probability confirmation.
For a deeper dive into RSI confirmation signals, read our guide on RSI Overbought and Oversold Levels: Master the Signals.
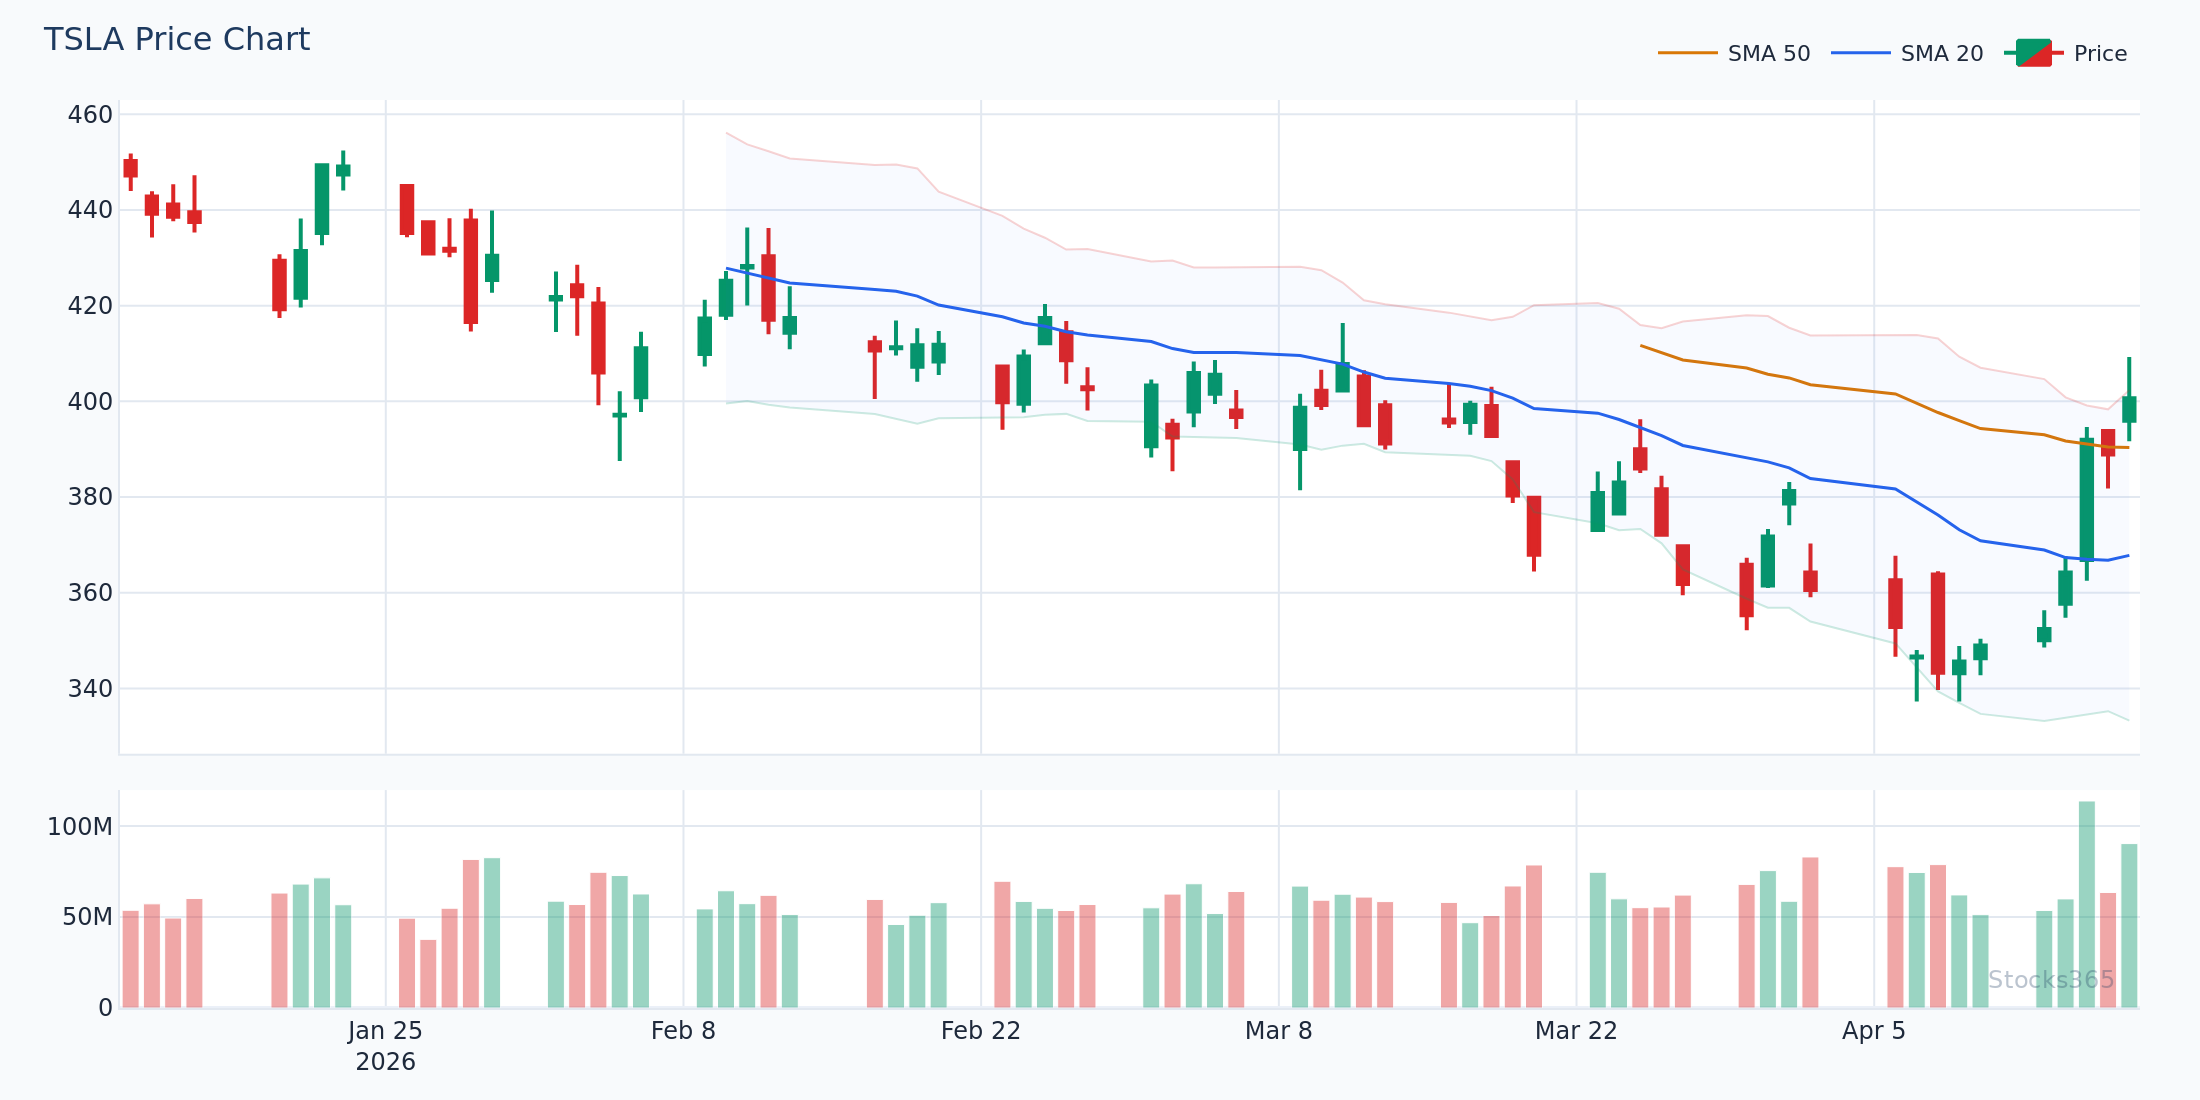
This TSLA chart illustrates a textbook W-pattern: the first low tags the lower band, price rebounds to the 20-SMA, then pulls back — but the second trough holds above the lower band. This is the key: the band is no longer being touched, signaling diminishing bearish momentum. Entry triggers when price closes above the 20-SMA. Invalidation occurs if price breaks below the first low with the lower band once again being tagged.
Here's What Most Traders Get Wrong About Bollinger Bands
Most traders treat a touch of the upper Bollinger Band as an automatic sell signal. It isn't. In a trending market, price can hug the upper band for an extended period — sometimes weeks. Every touch looks like a short setup. Every short fails. The real edge isn't selling the touch; it's waiting for price to break back inside the band after a touch. That re-entry below the upper band is the mean-reversion signal. The touch alone is just a volatility reading, not a reversal trigger.
The same logic applies in reverse on the lower band. Don't buy because price touched the lower band. Buy when price closes back above the lower band after the touch — that's when sellers are actually stepping back.
Combining Bollinger Bands with RSI on TradingView
Bollinger Bands show where price is relative to volatility. RSI shows momentum. Used together, they filter out the noise that kills single-indicator traders.
The combination works like this: price tags the lower Bollinger Band (volatility extreme) AND RSI drops below 30 (momentum extreme) at the same time. That confluence is a high-conviction oversold signal. Similarly, price at the upper band with RSI above 70 flags an overbought extreme worth watching for reversal.
New to RSI? Our complete beginner's guide to RSI breaks down everything from scratch.
For advanced confirmation, watch for RSI divergence at band extremes. When price makes a new low touching the lower band but RSI makes a higher low, that hidden strength is a powerful signal. We cover this in detail in our guide on RSI Divergence: Bullish and Bearish Signals.
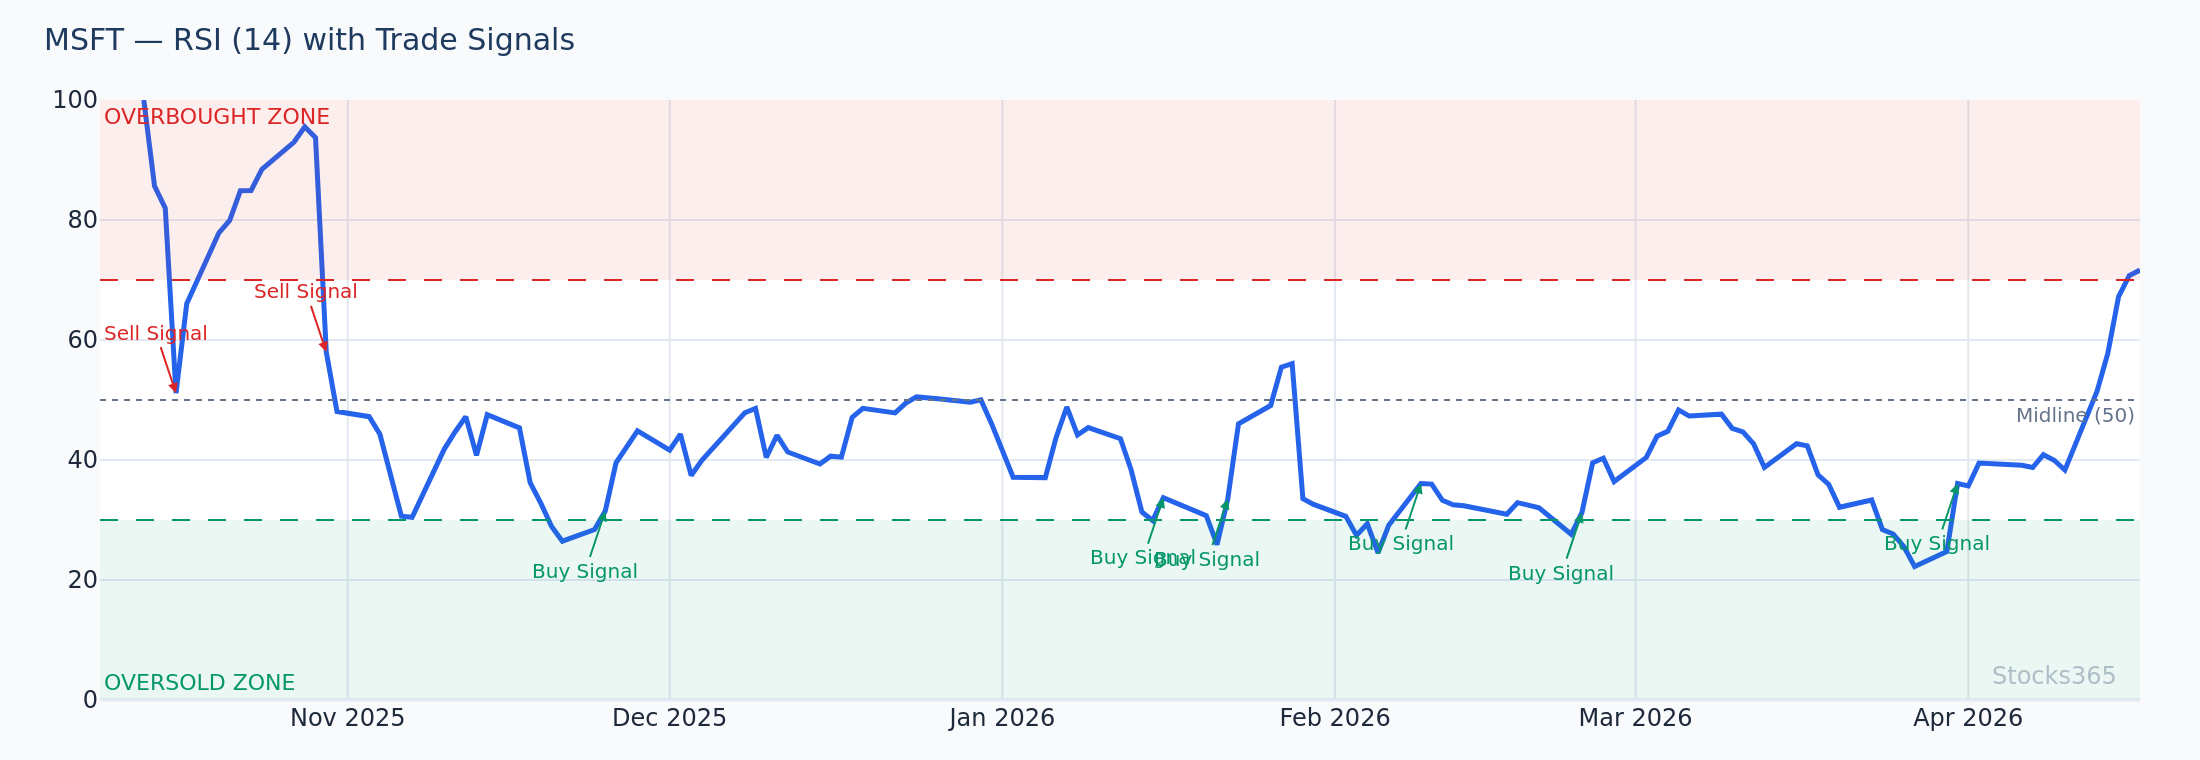
This MSFT chart shows a classic confluence: price compressing toward the lower Bollinger Band while RSI simultaneously dips below 30. The dual extreme creates a higher-probability mean-reversion setup than either signal alone. Confirmation arrives when price closes back inside the lower band and RSI crosses back above 30. If price continues falling with RSI staying below 30 and no divergence forming, the setup is invalidated and the downtrend is likely accelerating.
What the Data Actually Says About Bollinger Band Signals
It's worth being honest about what Bollinger Band signals deliver in practice. Our analysis of 14,266 Bollinger Squeeze Breakout signals across equities, crypto, forex, and commodities found a win rate of 49.5% with a profit factor of 1.03 over a 10-day holding period. The best-performing asset class was crypto at 51.8%, while forex lagged at 47.1%. Explore the full dataset at Stocks365 Insights.
A profit factor of 1.03 isn't glamorous — but it tells you the strategy has a genuine edge over random chance. More importantly, it confirms that the squeeze breakout is not a coin flip. The edge is real. The key is proper execution: waiting for confirmation, not jumping the gun on the squeeze setup before the break.
Bollinger Band signals work best as part of a confluence system, not as standalone triggers. Combine with volume, RSI, or trend filters to push your win rate higher.
Bollinger Bands Settings for Different Trading Styles
Day Trading (Intraday Charts: 1m, 5m, 15m)
- Length: 10–14
- StdDev: 1.5–2.0
- Best use: Squeeze breakouts on opening range, band-touch reversals after news spikes
Swing Trading (Daily Charts)
- Length: 20 (default)
- StdDev: 2.0
- Best use: W-pattern setups, squeeze breakouts, RSI confluence entries
Position Trading (Weekly Charts)
- Length: 20–50
- StdDev: 2.0–2.5
- Best use: Major trend reversals, macro volatility compression setups
For a deeper look at optimizing indicator periods for your strategy, check out our guide on RSI Settings: Mastering the Best Period — the same logic applies to Bollinger Band length selection.
Bollinger Bands vs. Other Volatility Indicators on TradingView
TradingView offers dozens of volatility indicators. Bollinger Bands are the most widely used — but how do they compare?
Bollinger Bands vs. Keltner Channels: Both plot dynamic envelopes around price. Keltner Channels use ATR for band width rather than standard deviation. Keltner Channels are smoother and less sensitive to brief volatility spikes. When Bollinger Bands compress inside Keltner Channels, that's the "Squeeze" signal popularized by John Carter — an even tighter coiling pattern.
Bollinger Bands vs. ATR: ATR is a raw volatility number. Bollinger Bands contextualize volatility visually on the chart. Both measure volatility — ATR gives you a precise number, bands give you a visual range. Use them together.
If you're also using stochastic oscillators alongside Bollinger Bands, our comparison of RSI vs. Stochastic Oscillator explains which momentum tool pairs better with which setup.
Using Bollinger Bands on Stocks365 Signals
Stocks365 integrates Bollinger Band analysis directly into its signal feed. When you view a stock signal — for example, AAPL's live signal page — the platform displays current band positioning, squeeze status, and how Bollinger Band readings contribute to the overall trust score.
The Stocks365 dashboard surfaces squeeze setups across hundreds of instruments simultaneously, so you don't have to manually scan every chart. The platform does the screening. You focus on execution.
What to Watch For
- Bollinger Squeeze on tech stocks: When band width drops below the 20th percentile of its 52-week range on a daily chart, the next expansion typically produces a 2–3 ATR move. Wait for a confirmed close outside the band with volume surging above the 20-session average before entering.
- Upper Band Walk in uptrending large-caps: When price closes above the upper band for three or more consecutive sessions, this is a momentum signal — not a reversal. Don't short it. Trail a stop under the 20-SMA instead and ride the trend.
- W-Pattern at lower band + RSI divergence: When price forms a second low above the lower band while RSI makes a higher low, look for a break above the 20-SMA as the entry trigger. This confluence setup has historically preceded sharp bounces across equities and crypto.
- Bollinger Band squeeze breakouts on crypto: Crypto shows the highest win rate on squeeze breakouts relative to other asset classes. Watch for squeezes forming on major crypto assets after periods of sideways consolidation exceeding two weeks.
- Band contraction before earnings: Bollinger Bands often compress in the days before a major earnings release as the market waits. The post-earnings gap frequently produces a clean squeeze breakout. Confirm with the direction of the move on the opening candle before entering.
How Stocks365 Uses This
🔍 How Stocks365 Integrates Bollinger Bands
Bollinger Bands are one of 12+ technical indicators feeding the Stocks365 Trust Score system. The platform tracks three specific Bollinger Band conditions in real time: band position (where price sits relative to upper, middle, and lower bands), squeeze status (whether band width is in a compression zone), and breakout confirmation (whether a squeeze has produced a directional close outside the bands with volume confirmation).
These readings contribute to both the volatility regime score (is the market quiet or explosive?) and the indicator agreement score (how many signals align in the same direction?). When Bollinger Bands flag a squeeze breakout and RSI, volume, and trend filters agree, the trust score rises — surfacing only the highest-conviction setups to traders on the Stocks365 dashboard. Bollinger Band signals alone carry limited edge; inside the trust score framework, they become part of a corroborating evidence system that has been validated across tens of thousands of historical signals.
Key Takeaways
📌 Key Takeaways: Bollinger Bands on TradingView
- Add Bollinger Bands via the Indicators menu — search "Bollinger Bands" and click to apply.
- Default settings (20-period SMA, 2.0 StdDev) work well for swing trading on daily charts.
- The squeeze breakout is the highest-conviction Bollinger Band setup — wait for confirmation with volume before entering.
- Don't sell every upper band touch in a trending market. Wait for price to close back inside the band.
- Combine Bollinger Bands with RSI for confluence signals — double extremes produce higher-probability setups than either indicator alone.
- Squeeze breakouts on crypto historically outperform other asset classes based on Stocks365 signal research across 14,266 setups.
- Use the Stocks365 dashboard to scan for squeezes and breakouts across multiple assets simultaneously.