
What Are Bollinger Bands? A Beginner's Foundation
Bollinger Bands are one of the most widely used technical indicators in trading. Developed by John Bollinger in the 1980s, they consist of three lines plotted directly on a price chart: a middle band (a 20-period simple moving average), an upper band (2 standard deviations above the SMA), and a lower band (2 standard deviations below it).
The bands expand and contract automatically based on market volatility. Wide bands signal high volatility. Narrow bands signal low volatility — and often, a big move brewing beneath the surface.
For beginners, that dynamic is everything.
Unlike fixed support or resistance levels, Bollinger Bands adapt to market conditions in real time. That's what makes them powerful — and what makes them easy to misuse.
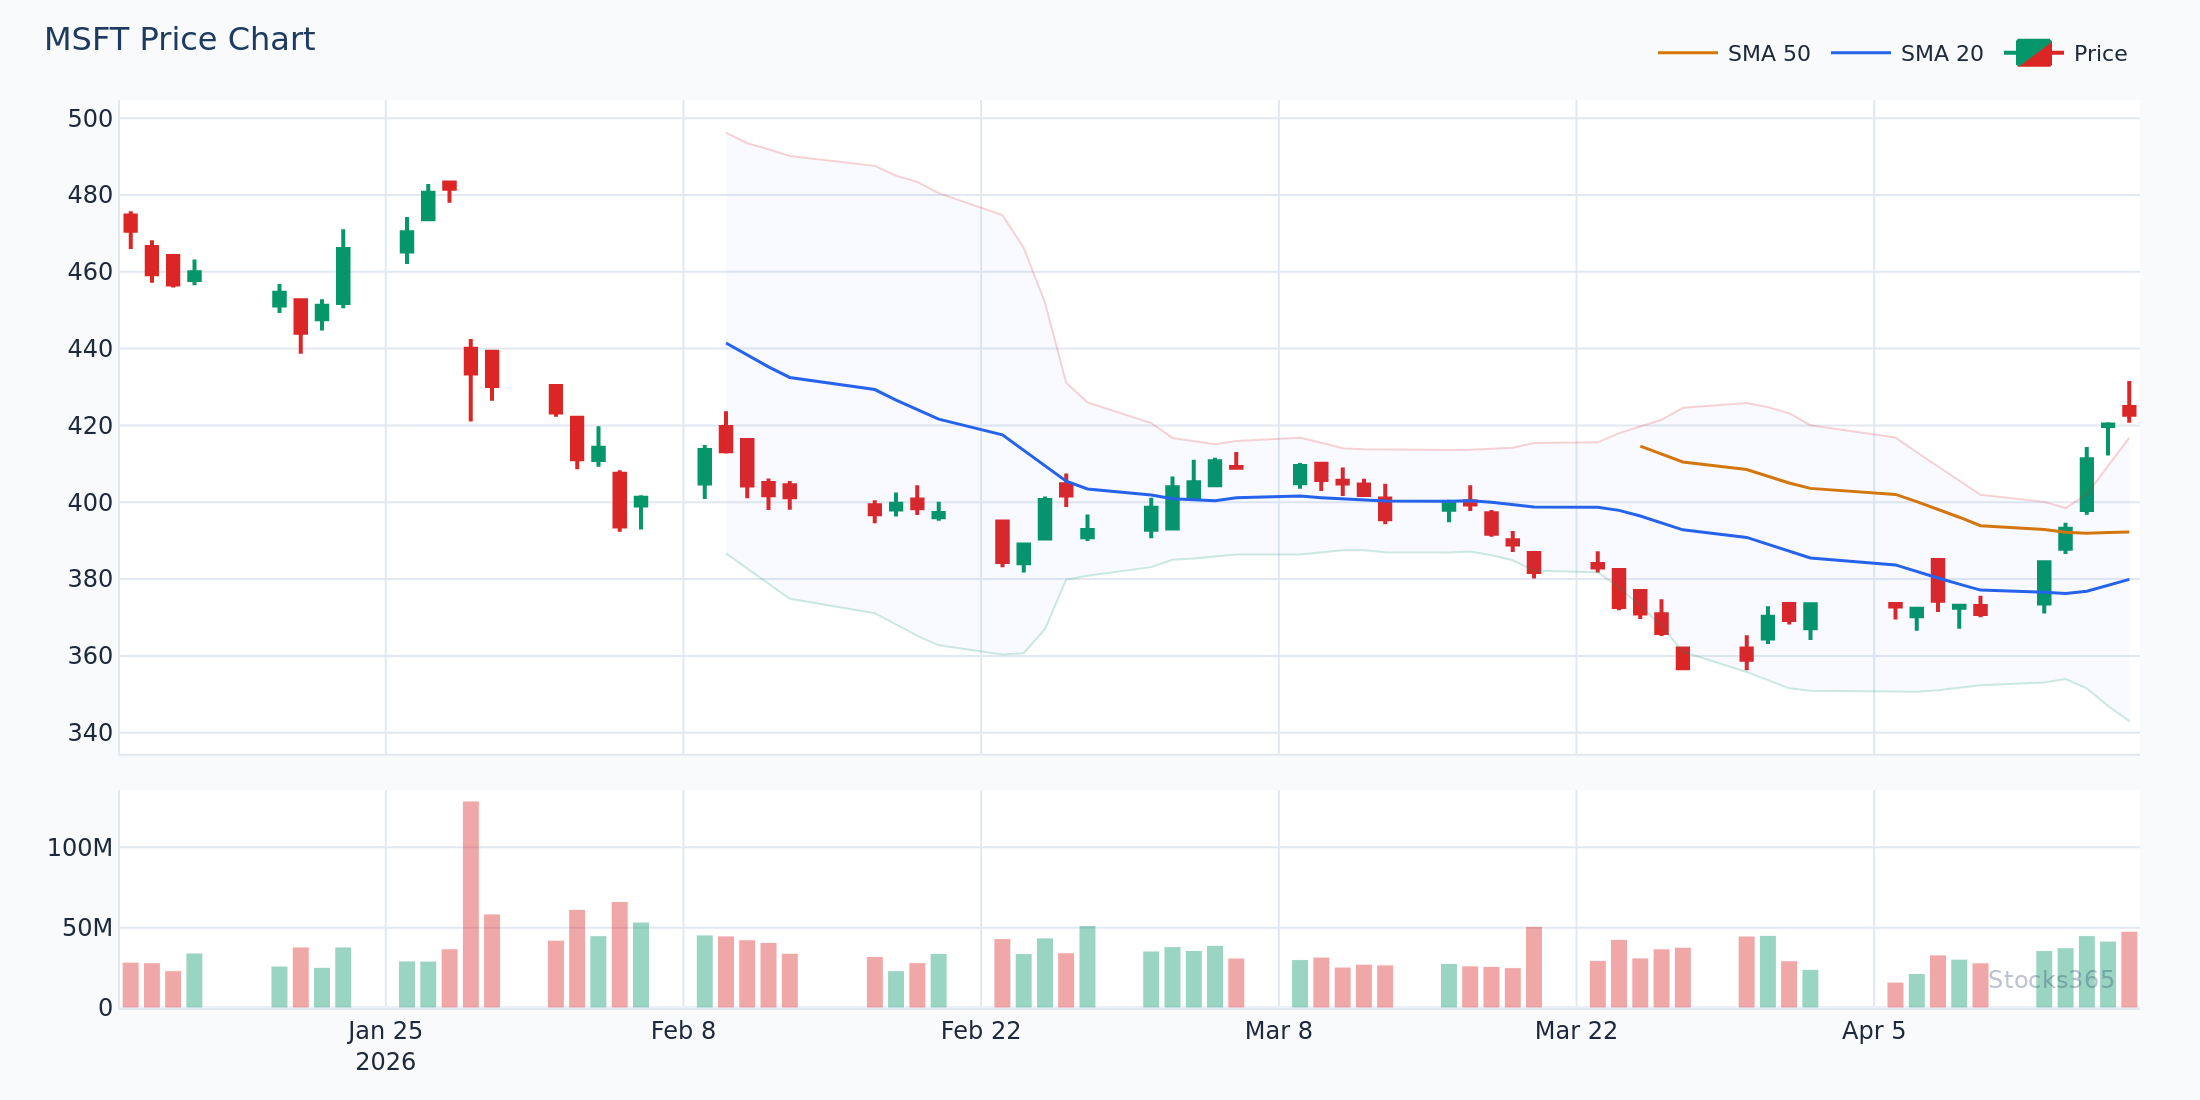
This chart shows a typical Bollinger Band cycle on a large-cap equity. Notice how price oscillates between the upper and lower bands during ranging conditions, then breaks cleanly outside the bands when volatility expands. When price returns inside the bands after a breakout, watch for momentum to fade. A failure to hold outside the bands — combined with a reversal candle — often marks the end of the short-term move.
How Bollinger Bands Actually Work (The Mechanics)
Understanding the math behind the bands makes you a smarter trader. The middle band is simply a 20-period SMA. The upper and lower bands sit at plus or minus two standard deviations from that average.
Standard deviation measures how spread out price data is from the mean. When price moves are small and consistent, standard deviation is low — bands tighten. When price moves are large and erratic, standard deviation rises — bands widen.
Statistically, roughly 95% of price action falls within the bands under normal conditions. That single fact drives most Bollinger Band strategies.
The Three Key Zones Every Beginner Must Know
- Upper Band Zone: Price at or above the upper band suggests strong bullish momentum — or an overextended move ripe for reversal.
- Middle Band Zone (20-SMA): Acts as dynamic support in uptrends and dynamic resistance in downtrends. This is the reset level.
- Lower Band Zone: Price at or below the lower band suggests strong bearish momentum — or a deeply oversold condition.
Knowing which zone price is in — and what it means in context — is the entire game.
The 5 Rules for Trading Bollinger Bands Safely
Rule 1: Never Trade Band Touches in Isolation
Price touching the upper band is not a sell signal. Price touching the lower band is not a buy signal. Full stop.
Here's what most traders get wrong: they see price hit the upper band and immediately short, assuming a reversal is guaranteed. In a strong uptrend, price can ride the upper band for days — sometimes weeks — as momentum carries it higher. The band touch tells you where price is relative to volatility. It does not tell you direction.
The safe approach is confirmation. Wait for a candlestick reversal pattern at the band (a bearish engulfing, a shooting star, a doji), volume confirmation, or a secondary indicator signal before acting. A band touch without confirmation is just noise.
Pair Bollinger Bands with RSI to add that confirmation layer. When price tags the upper band and RSI simultaneously crosses back below 70, the probability of a short-term pullback increases meaningfully. Learn more about reading those RSI signals in our guide to RSI Overbought and Oversold Levels.
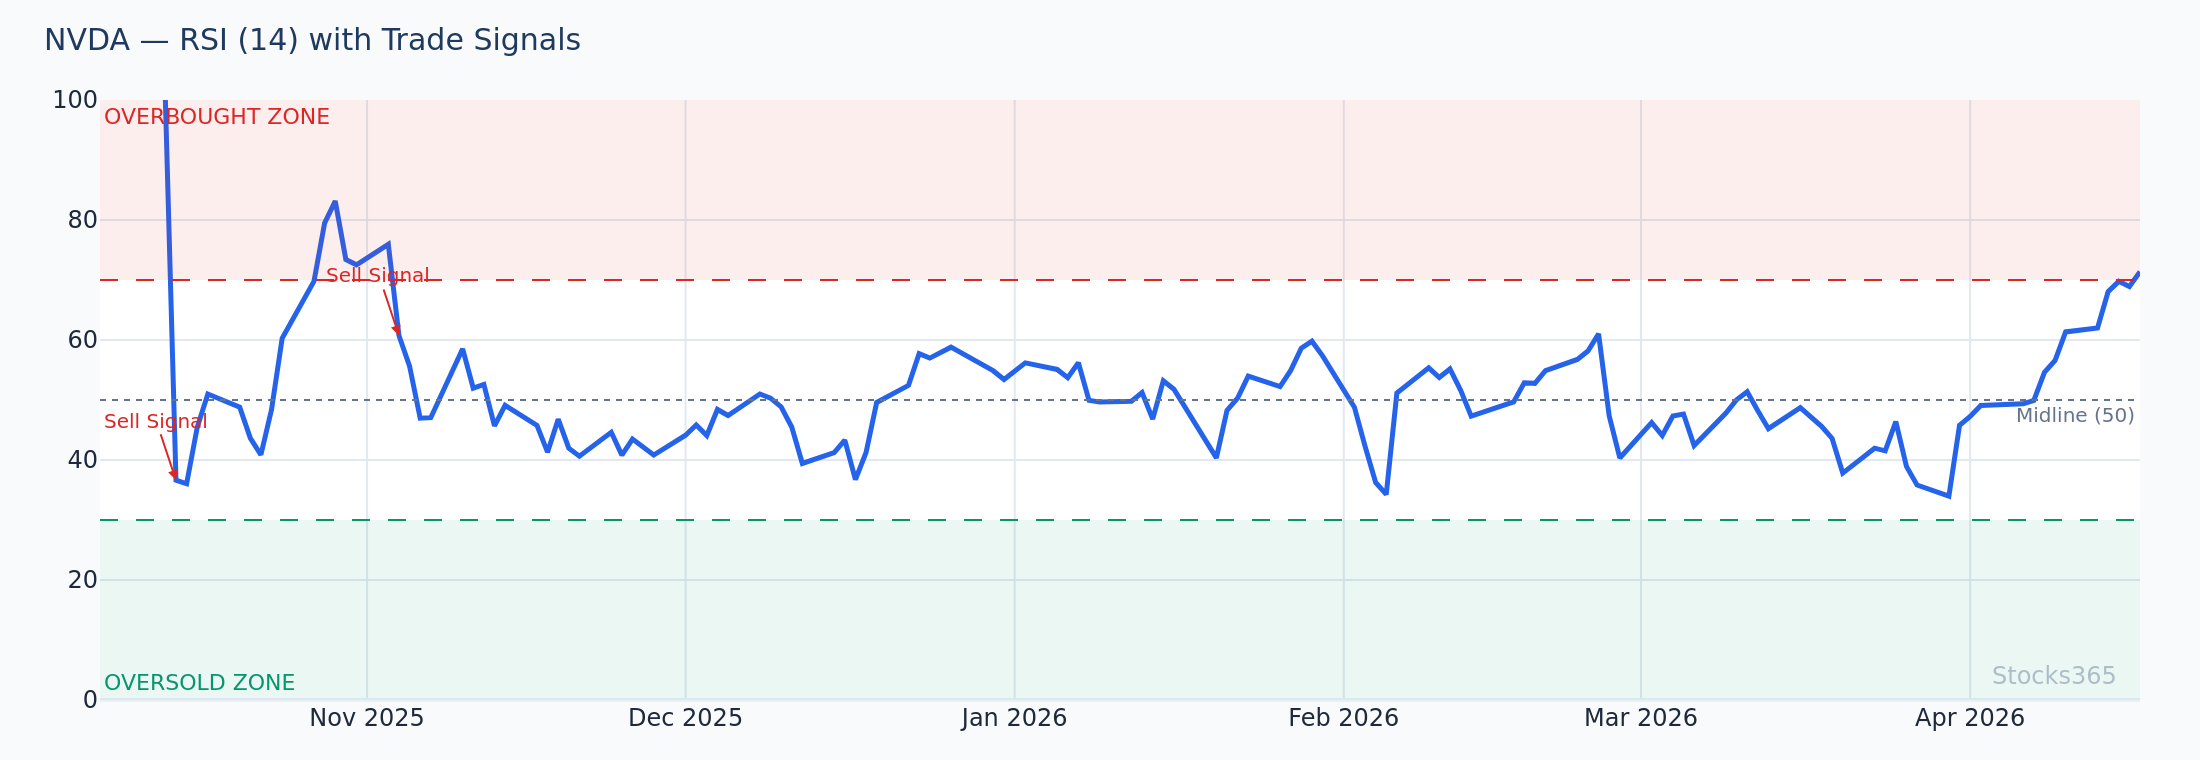
This chart pairs RSI with price action at the upper band. When price extends above the upper band while RSI reads above 70, watch for RSI to hook back below 70 as the first warning sign. That RSI rollover — not the band touch itself — is the signal. If RSI stays elevated and price pulls back only to the middle band before bouncing, the uptrend remains intact and the band touch was continuation, not reversal.
Rule 2: Respect the Bollinger Squeeze
The Bollinger Squeeze is the single most reliable setup the indicator produces. When the bands contract to unusually narrow width — often visible as the upper and lower bands running nearly parallel — it signals that volatility has compressed. Energy is building. A breakout is coming.
The squeeze itself doesn't tell you direction. That's the catch. Price can break up or down from a squeeze, and both are valid. The rule is: wait for the breakout candle, then trade in that direction.
A confirmed squeeze breakout looks like this: bands tighten over multiple sessions, then a strong candle closes decisively above the upper band (bullish) or below the lower band (bearish) on volume that exceeds the recent average. That's your entry trigger.
Our analysis of 14,266 Bollinger Squeeze Breakout signals found a profit factor of 1.03 over a 10-day holding period — one of the few Bollinger Band setups with a positive edge at scale. Crypto performed best at 51.8%, while forex trailed at 47.1%. See the full dataset at Stocks365 Insights.
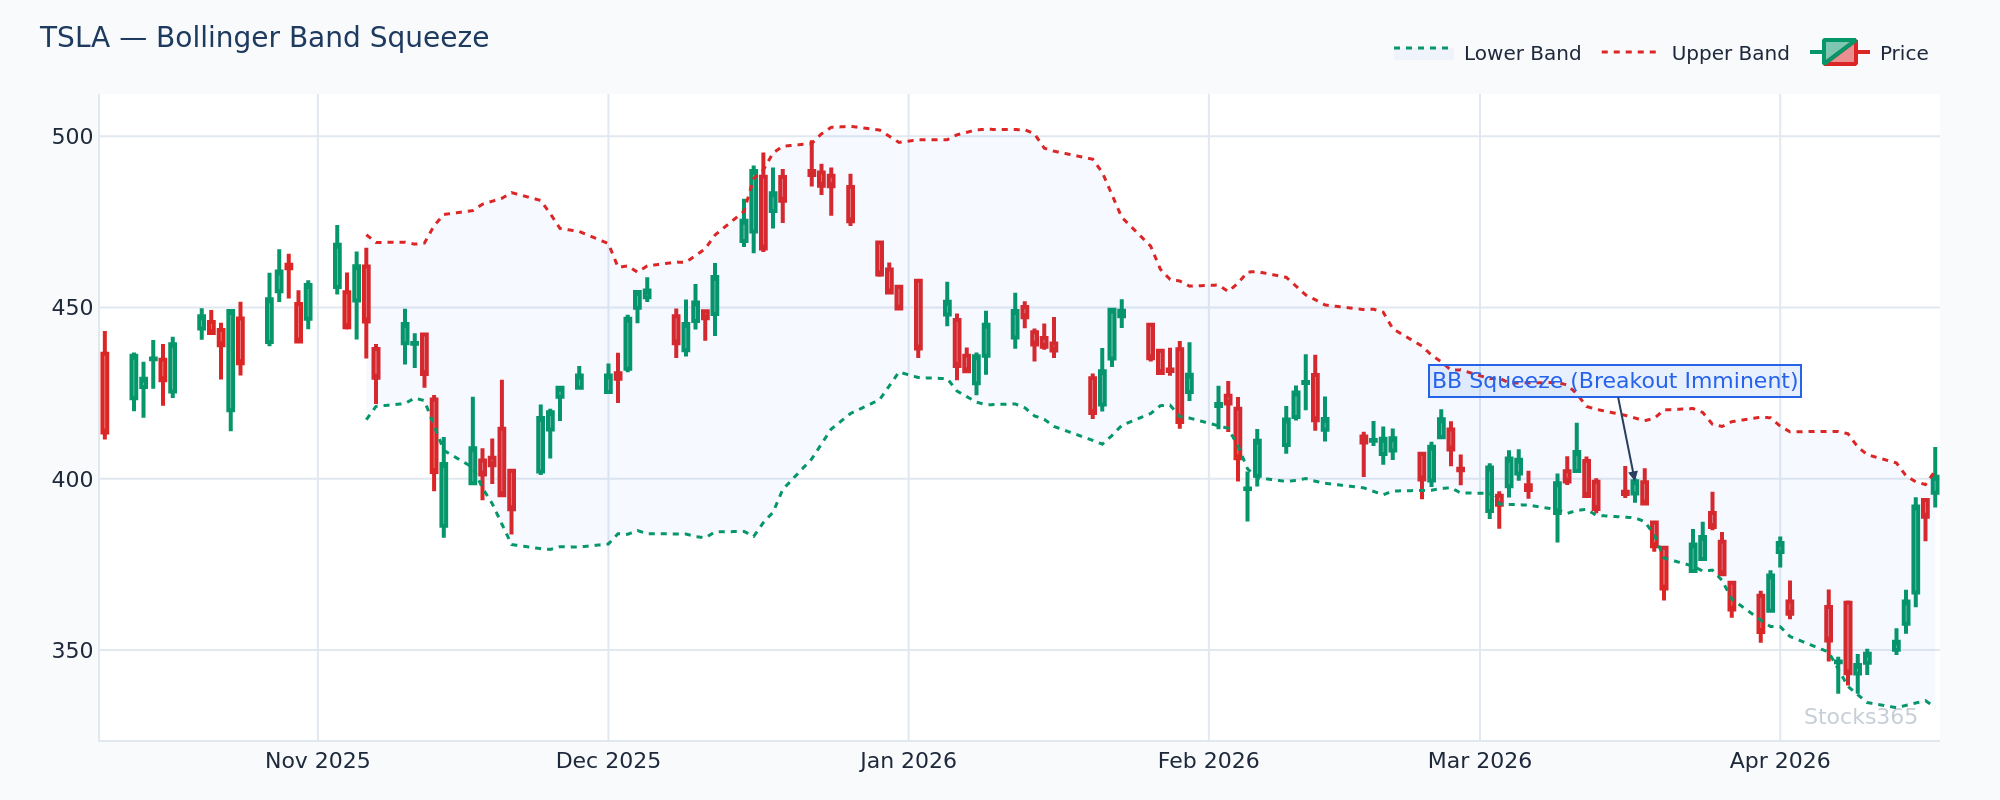
Here the bands narrow visibly over a consolidation period before price breaks sharply higher on elevated volume. The breakout candle closes well above the upper band — that's confirmation. What invalidates this setup: price breaks above the upper band but immediately reverses and closes back inside the bands on the same or next session. That false breakout is a trap. Reduce size or stay out until a clean retest confirms direction.
Rule 3: Use the Middle Band as Your Trend Filter
The 20-SMA middle band is underrated. Most beginners ignore it and focus entirely on the upper and lower bands. That's a mistake.
In an uptrend, price consistently closes above the middle band, and pullbacks to it are buying opportunities. In a downtrend, price stays below the middle band, and bounces to it are shorting opportunities. The middle band tells you the trend context — and context determines which signals you act on.
Simple rule: if price is above the middle band, only take long setups. If price is below it, only take short setups. This single filter eliminates a large percentage of losing counter-trend trades.
Rule 4: Combine With a Momentum Indicator
Bollinger Bands measure volatility. They do not measure momentum. That gap needs to be filled by a second indicator.
RSI is the most natural companion. RSI tells you whether momentum supports the band signal. A lower band touch with RSI below 30 is a much stronger potential reversal setup than a lower band touch with RSI at 55. The alignment matters.
The Stochastic Oscillator is another effective pairing. When both Bollinger Bands and the Stochastic show overbought conditions simultaneously, the setup has confluence — two independent systems agreeing. Confluence reduces false signals.
Whichever momentum indicator you choose, the principle is the same: Bollinger Bands identify the location of price within its volatility range. Momentum indicators confirm whether the energy behind that move supports the trade. Never use one without the other.
Rule 5: Size Down During High Volatility Expansions
Wide Bollinger Bands mean high volatility. High volatility means larger swings in both directions — including against your position.
When bands are wide and expanding, stop losses need to be wider to avoid being shaken out by normal price noise. Wider stops mean more capital at risk per trade. The solution is not to skip risk management — it's to reduce position size so that a wider stop doesn't breach your per-trade loss limit.
This is mechanical discipline, not guesswork. If your normal stop is 1 ATR and current volatility requires a 2.5 ATR stop, cut your position size proportionally. The math keeps your risk constant even as market conditions shift.
Ignoring this rule is how beginners blow up during earnings seasons and major macro events — exactly when Bollinger Bands widen most aggressively.
Common Bollinger Band Setups That Actually Work
The W-Bottom Reversal Pattern
One of the most reliable Bollinger Band patterns for beginners is the W-Bottom. Here's how it forms: price drops to or below the lower band (first low), rebounds toward the middle band, then pulls back again to make a second low — but this time, the second low does not breach the lower band.
That second low staying above the lower band signals weakening selling pressure. When price then breaks above the middle band on the rally from the second low, the pattern confirms. Entry is on the middle band breakout. Stop goes below the second low.
Check RSI during this setup: if RSI makes a higher low on the second price low (bullish divergence), the reversal signal strengthens considerably. Our full guide on RSI Divergence covers how to spot this precisely.
The M-Top Reversal Pattern
The M-Top is the mirror image. Price pushes to or above the upper band (first high), pulls back toward the middle band, then rallies again to a second high that fails to reach the upper band.
That failure signals weakening buying pressure. When price breaks below the middle band, the pattern confirms bearish. Entry short on the middle band breakdown. Stop above the second high.
Again, RSI divergence — in this case a lower RSI reading on the second price high — makes this setup significantly stronger.
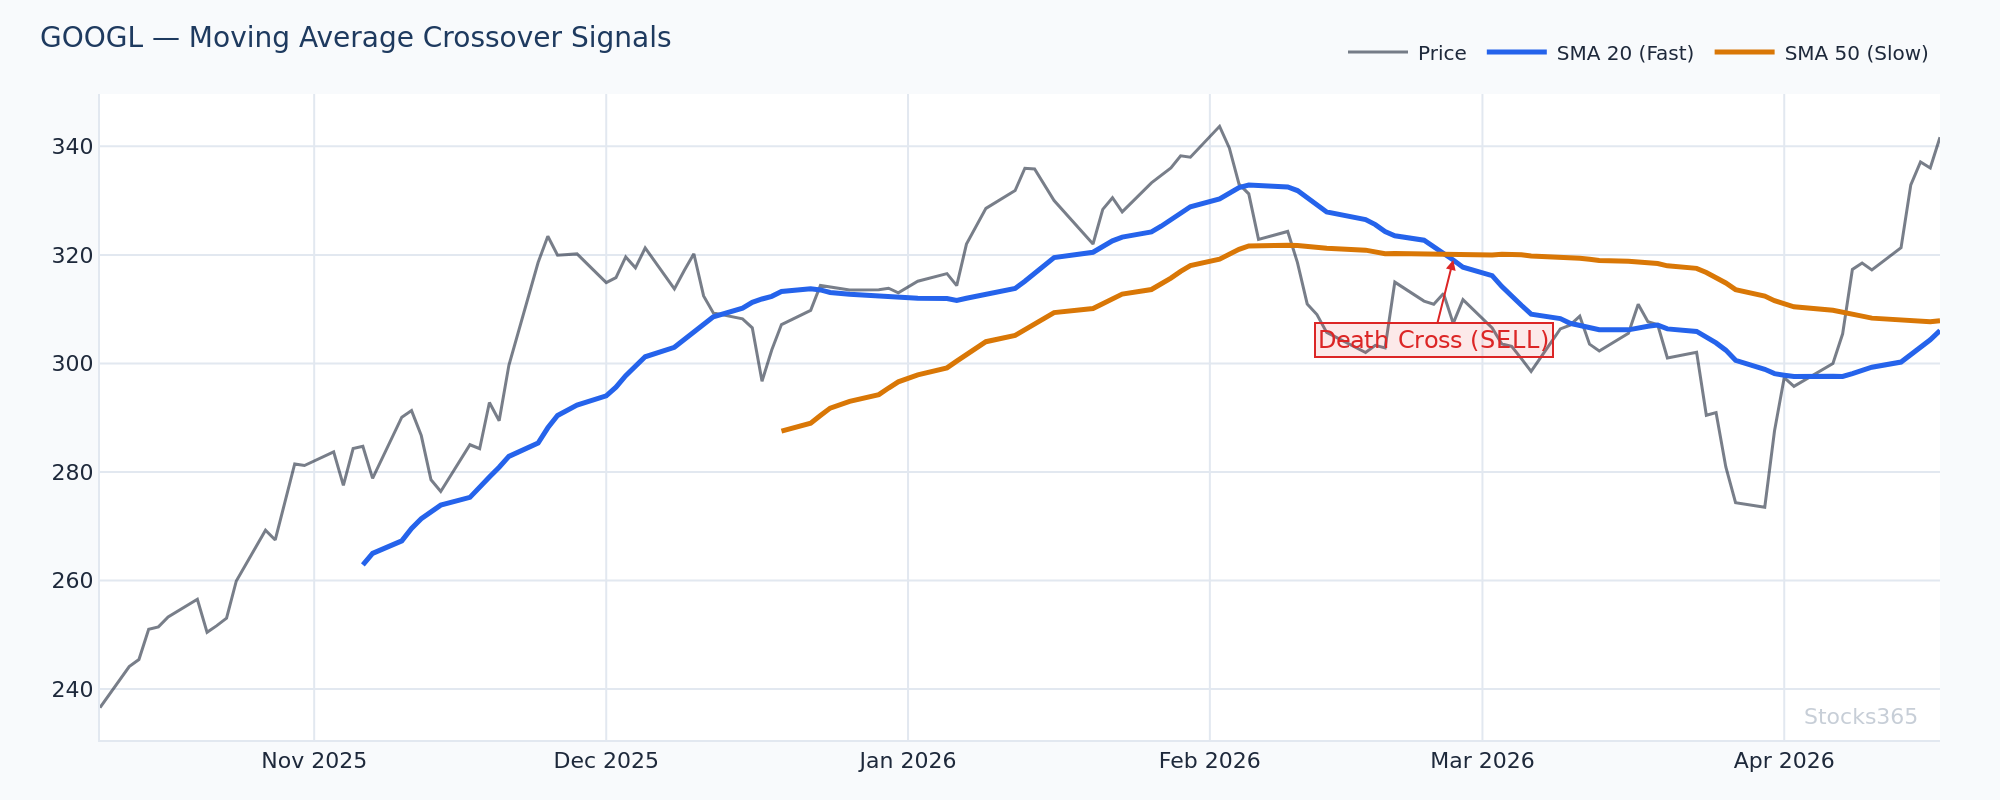
This chart shows a textbook M-Top structure. The first peak tags the upper band with strong momentum. The second peak fails to reach the upper band while price appears similar — that divergence between price and the bands is the tell. Confirmation arrives when price closes below the 20-SMA middle band. The pattern is invalidated if price breaks above the first peak's high with volume, as that signals the uptrend has resumed rather than reversed.
What the Data Actually Says About Bollinger Band Signals
Raw band touches underperform more than most beginners expect. Stocks365 research across 3,255 upper band touch signals found a win rate of just 49.6% with a profit factor of 0.88 over a 10-day holding period — meaning the average upper band touch trade loses more than it gains. Crypto was the exception at 56.7%, while commodities dragged the average down at 41.5%. Full breakdown available at Stocks365 Insights.
That data point is not a reason to abandon the indicator. It's a reason to use it correctly. Band touches in isolation carry negative edge. Band touches combined with momentum confirmation, pattern recognition, and trend context is a different story entirely.
Edge doesn't come from the indicator. It comes from how you filter the indicator's signals.
How to Apply Bollinger Bands Across Different Markets
Equities
On individual stocks, Bollinger Bands work best on the daily timeframe. Squeeze setups ahead of earnings or product announcements can be particularly explosive — but remember, you don't know the direction. Always wait for the break and confirmation. Check live setups on the Stocks365 signals dashboard or drill into specific stocks like AAPL signals for real-time band analysis.
Crypto
Crypto markets are more volatile by nature, which means bands expand and contract more dramatically. The squeeze breakout setup performs best in crypto — consistent with the data above. Longer consolidation periods in crypto (sometimes spanning weeks) tend to precede the most powerful breakouts.
Forex
Forex pairs trend more consistently than equities, which makes the middle band trend filter especially valuable. Use it strictly: only trade in the direction of the middle band's slope. Counter-trend band touches in forex have the lowest edge of any major asset class according to the squeeze breakout data above.
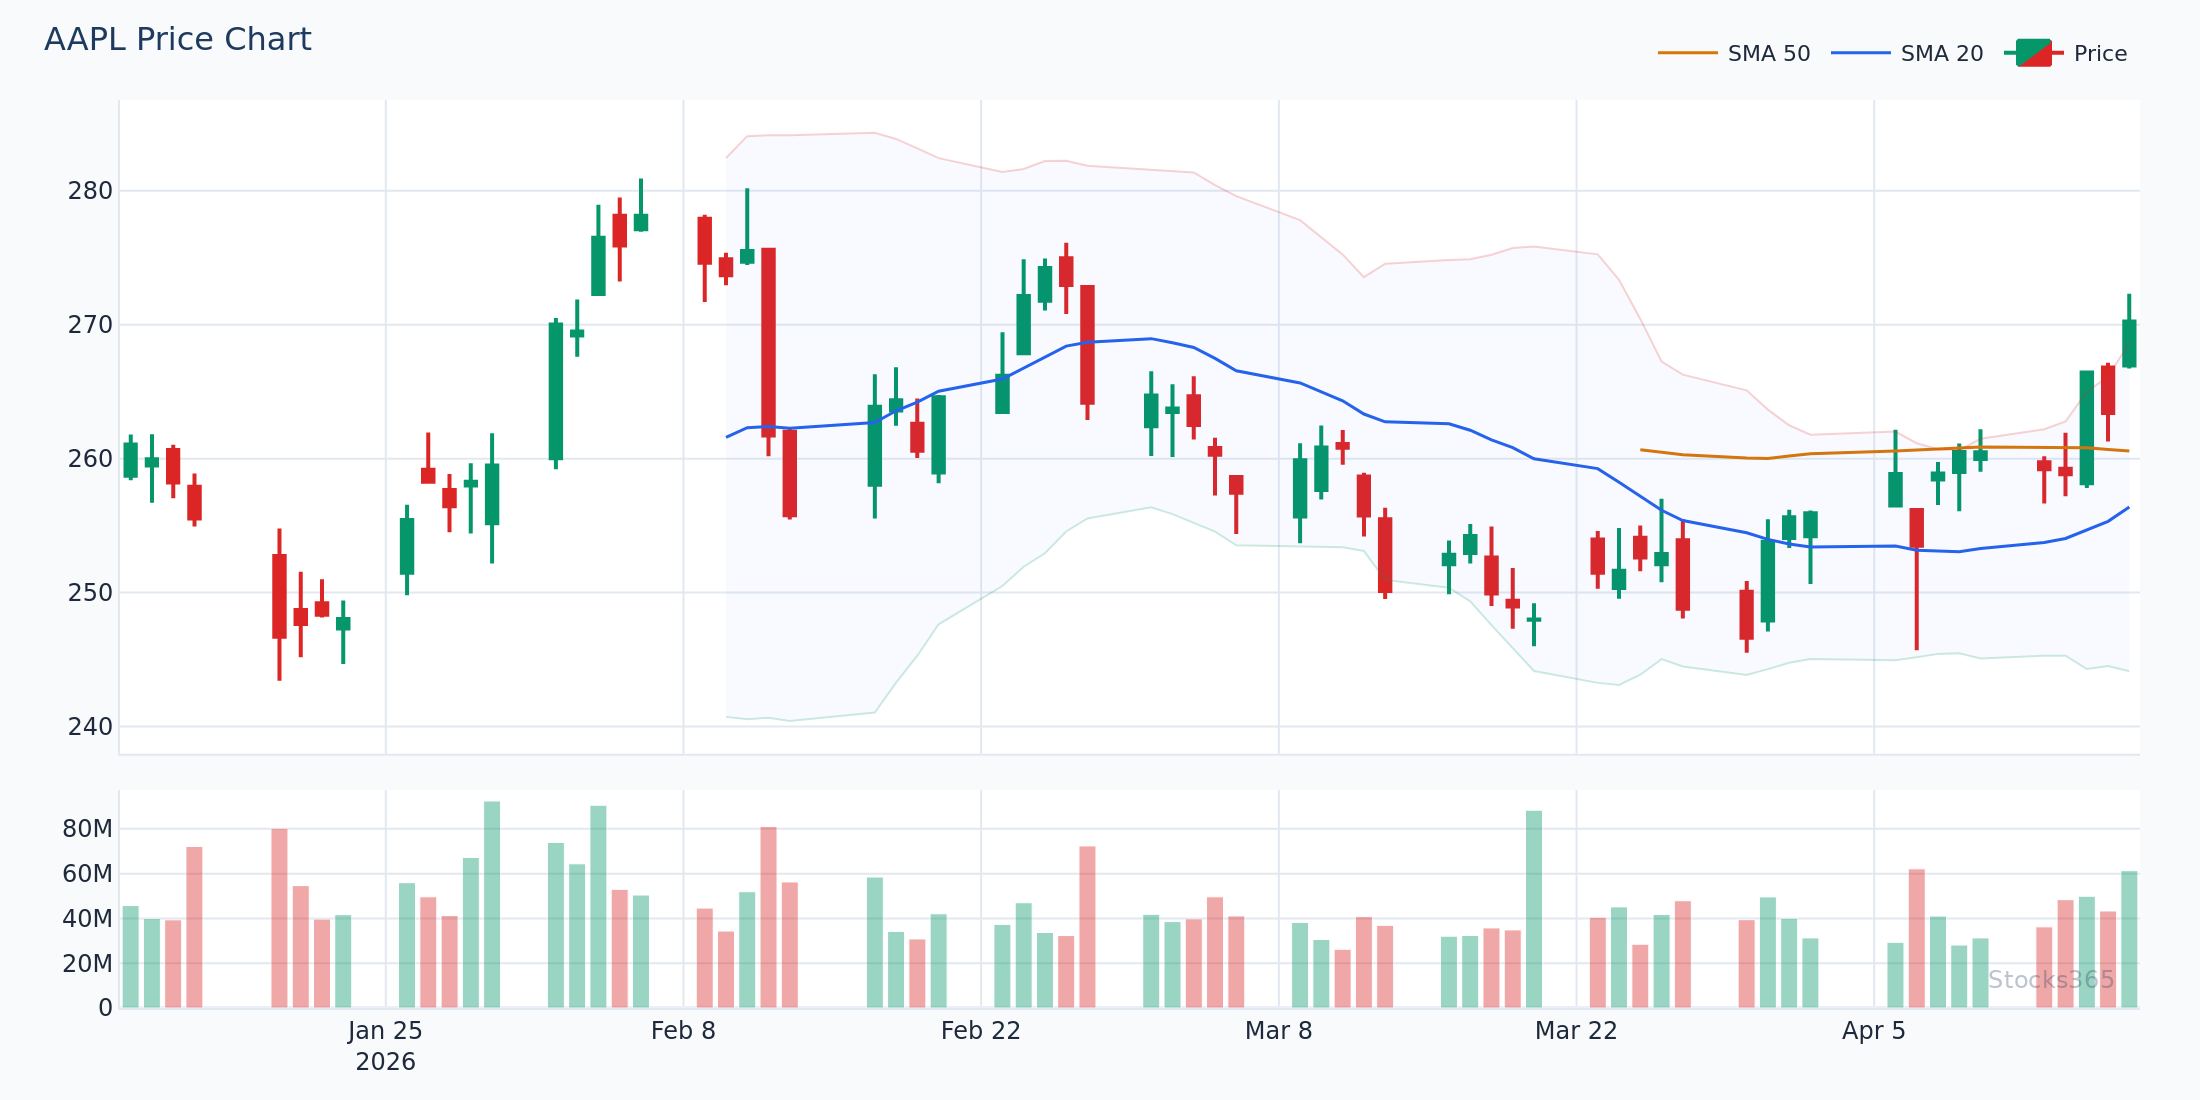
This chart illustrates the middle band functioning as dynamic support during an established uptrend. Price repeatedly pulls back to the 20-SMA and bounces, with each bounce producing a fresh leg higher. The setup breaks down when price closes decisively below the middle band on elevated volume — that's the signal the trend has shifted and long bias should be abandoned.
What to Watch For
- Bollinger Squeeze setups on tech stocks and large-cap crypto: When band width drops into the lowest 20th percentile of its recent range, the subsequent expansion frequently produces a 2–3 ATR directional move. Position for the breakout direction after the first confirmed close outside the bands.
- W-Bottom formations at the lower band following a 15–20% drawdown: When the second low holds above the lower band and RSI shows bullish divergence simultaneously, the probability of a meaningful bounce increases. The middle band breakout is the entry trigger.
- Upper band rides in strong uptrends: When price closes above the upper band for three or more consecutive sessions with the middle band sloping sharply upward, this is a momentum continuation pattern — not an immediate short. Wait for price to close back below the upper band before considering reversal trades.
- False breakouts from squeezes: When price breaks outside the bands on a squeeze but immediately reverses back inside within one to two sessions on declining volume, treat this as a false breakout signal in the opposite direction — the failed breakout often produces a move of equal magnitude the other way.
- RSI divergence at band extremes on lower timeframes: On the 4-hour or 1-hour chart, when price makes a new low below the lower band but RSI prints a higher low, the short-term reversal setup has confluence. Combine with a structured RSI entry approach for best results.
How Stocks365 Uses This
Bollinger Bands in the Stocks365 Trust Score System
Stocks365 integrates Bollinger Band signals as one of 12+ technical indicators within its proprietary trust score system. Band width feeds directly into the platform's volatility scoring layer — helping calibrate signal confidence based on current market conditions. During Bollinger Squeeze phases, the trust score flags low-volatility setups for heightened attention, as these historically precede significant directional moves. Band position (upper, middle, or lower zone) contributes to the regime scoring component, which determines whether the platform classifies current conditions as trending, ranging, or transitional. When multiple indicators — including band position, RSI state, and volume — align in the same direction, the trust score rises, filtering out lower-quality signals automatically. Explore real-time trust score data for any instrument on the Stocks365 signals dashboard.
Key Takeaways
- Bollinger Bands measure volatility — not direction. Always combine them with a momentum indicator like RSI.
- Band touches are not automatic signals. Confirmation from candlestick patterns, volume, or secondary indicators is required before acting.
- The Bollinger Squeeze is the highest-probability setup — wait for a confirmed breakout candle outside the bands with elevated volume.
- Use the middle band (20-SMA) as a trend filter. Only take long setups above it, short setups below it.
- Size down in high-volatility environments — wide bands require wider stops, so reduce position size to keep risk constant.
- W-Bottom and M-Top patterns at the band extremes, especially when combined with RSI divergence, produce the cleanest reversal setups.
- Raw band touch signals carry negative edge in most asset classes. Context, confirmation, and confluence are what create the edge.