
Bollinger Bands Cheat Sheet: Everything You Need in One Place
Bollinger Bands are one of the most widely used technical indicators on the planet. Yet most traders misread them daily. They see price touch the upper band and immediately sell. They see a squeeze and freeze, unsure which direction to play. They mix up signals, miss setups, and wonder why their results are inconsistent.
This Bollinger Bands cheat sheet cuts through that confusion.
Stocks365 backtested 14,266 Bollinger Squeeze Breakout signals across equities, crypto, forex, and commodities — and found a profit factor of 1.03 with crypto leading at 51.8% win rate. Here's what those numbers mean for your trading, and exactly how to apply this indicator in 2026.
Bollinger Bands Basics: The Fast Refresher
Before the cheat sheet, a quick structural overview. Bollinger Bands consist of three lines drawn around price:
- Middle Band: A 20-period Simple Moving Average (SMA)
- Upper Band: Middle Band + 2 standard deviations
- Lower Band: Middle Band − 2 standard deviations
The bands expand when volatility rises. They contract when volatility falls. That expansion and contraction cycle is the engine behind every Bollinger Bands setup. If you want a deeper breakdown of the math, How Bollinger Bands Work: Master the Math Behind It walks through every calculation step by step.
Standard settings: 20-period lookback, 2 standard deviations. These work across most timeframes and assets. Advanced traders sometimes adjust to 10-period or 50-period for scalping or swing trading — but master the defaults first.
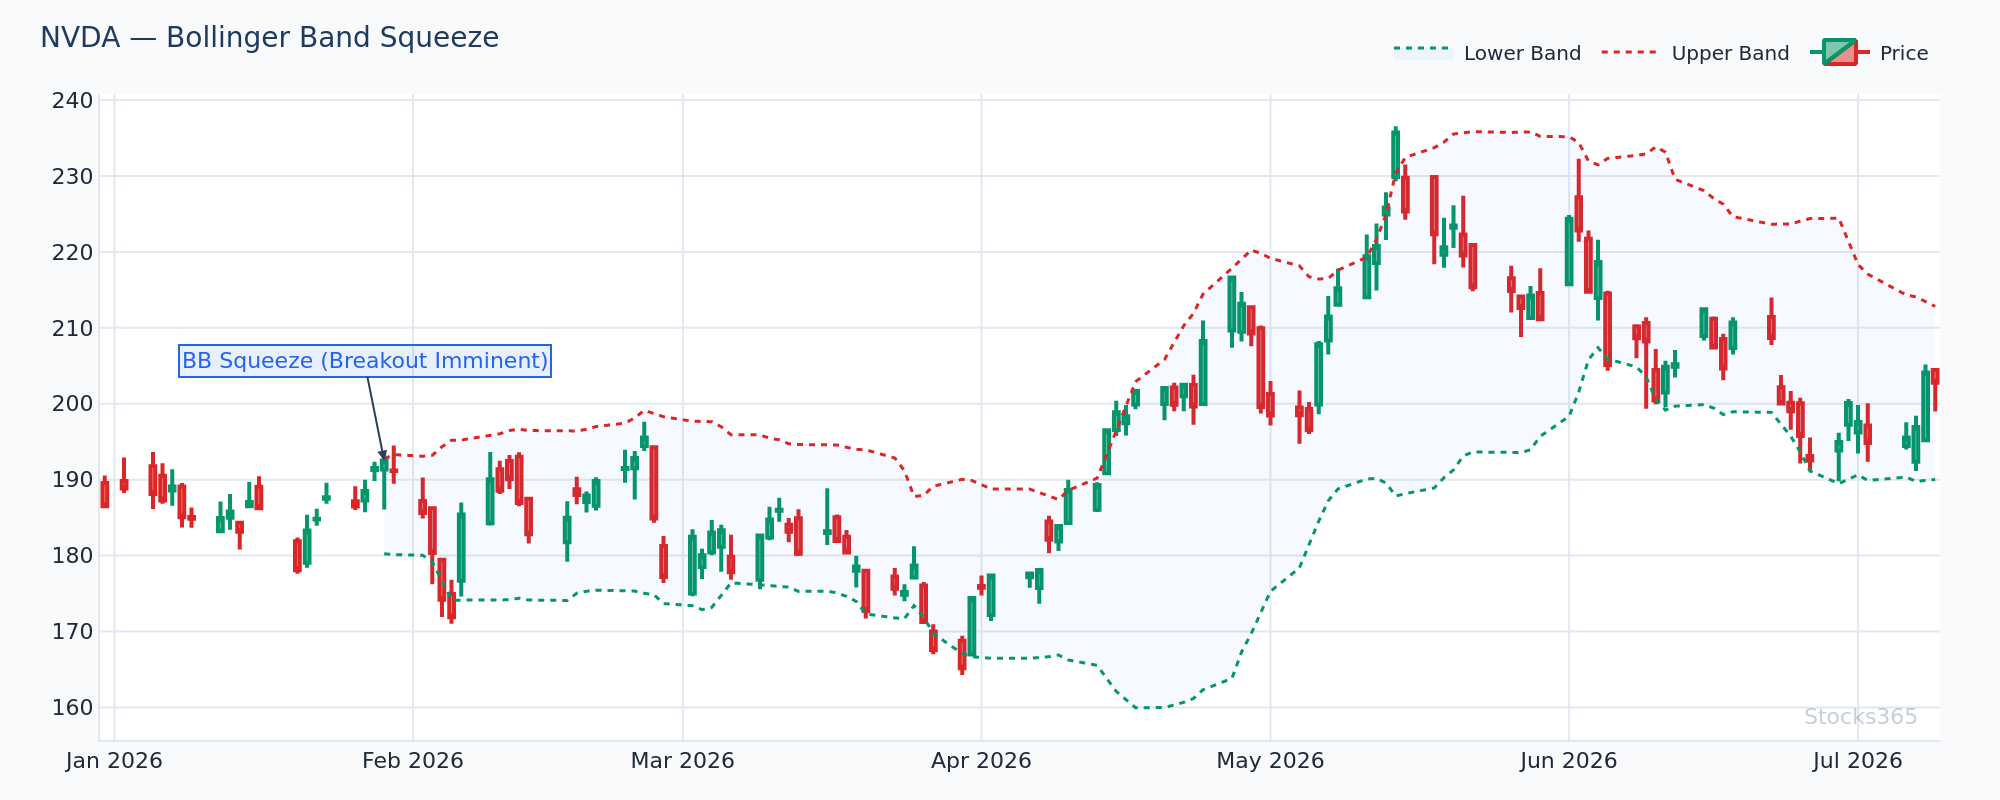
This chart shows band width at a multi-week low, with price coiling tightly inside the bands. When this compression resolves, the resulting move typically covers 2–3 ATR in the breakout direction. The pattern confirms when price closes decisively outside the bands on elevated volume — and invalidates if price continues to chop inside the squeeze without a directional close.
Bollinger Bands Cheat Sheet: The Core Setups
1. The Squeeze Breakout
What it is: Band width contracts to a 20th-percentile low (or lower) relative to recent history. Price consolidates. Then: explosion.
Setup criteria:
- Band width drops below its 20-period percentile rank
- Price is hugging the middle band (20-SMA)
- Volume is declining during the squeeze phase
- Volume surges 1.5–2x average on the breakout candle
Entry trigger: A candle closes above the upper band (bullish) or below the lower band (bearish) on expanding volume.
Invalidation: Price closes back inside the bands on the next session after the breakout candle.
The squeeze is the highest-probability setup Bollinger Bands offer. It doesn't tell you the direction — that's the challenge. Use momentum indicators or volume analysis to bias your direction before the breakout happens.
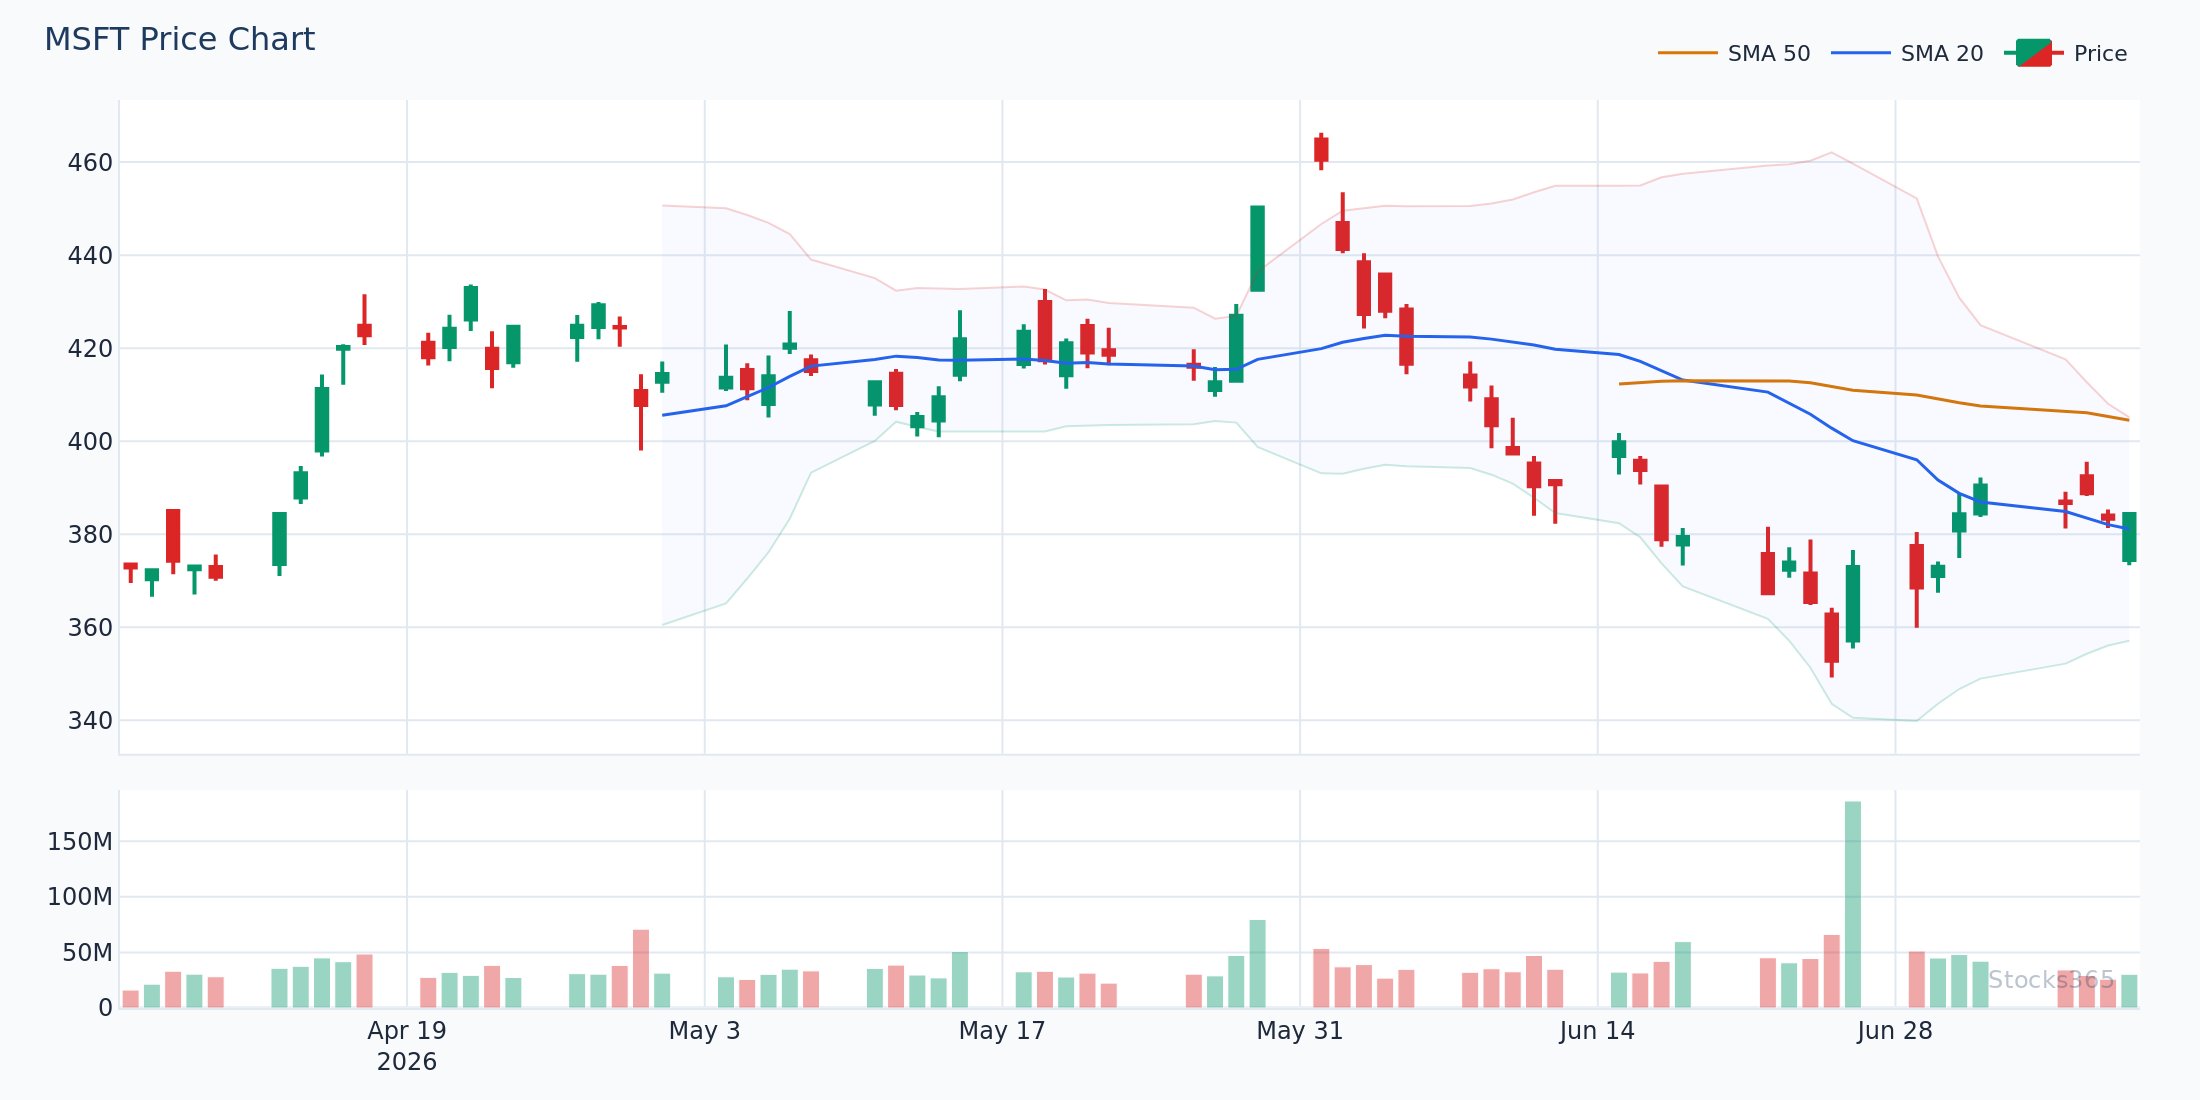
Here, MSFT coiled in a tight range for 12 sessions before price closed above the upper Bollinger Band on a volume surge. The middle band held as support on the retest. Confirmation comes from a second close above the 20-SMA after a brief pullback — failure looks like price immediately reversing back through the lower band within two sessions.
2. Upper Band Touch (Mean Reversion)
What it is: Price reaches or closes above the upper band in a non-trending, range-bound market.
Setup criteria:
- Price closes at or above the upper band
- No sustained trend in place (ADX below 25)
- RSI is above 65 but not in a confirmed momentum breakout
- Volume is average or below — no surge
Entry trigger: Next candle opens inside the upper band (pull back into range).
Target: Middle band (20-SMA) is the natural mean reversion target.
Invalidation: Price continues to close above the upper band for 3+ consecutive sessions — that's a trend, not a reversion setup.
Here's what most traders get wrong: they treat every upper band touch as a sell signal. In a strong trending market — think a momentum breakout on a tech stock or a crypto asset in a bull cycle — price can walk along the upper band for days or weeks. The upper band touch only works as a mean reversion signal when the broader context is range-bound. Trend first. Signal second. Always.
Our analysis of 3,255 upper band touch signals found a 49.6% win rate with a profit factor of 0.88 — but in crypto specifically, that climbs to 56.7%. Context is everything.
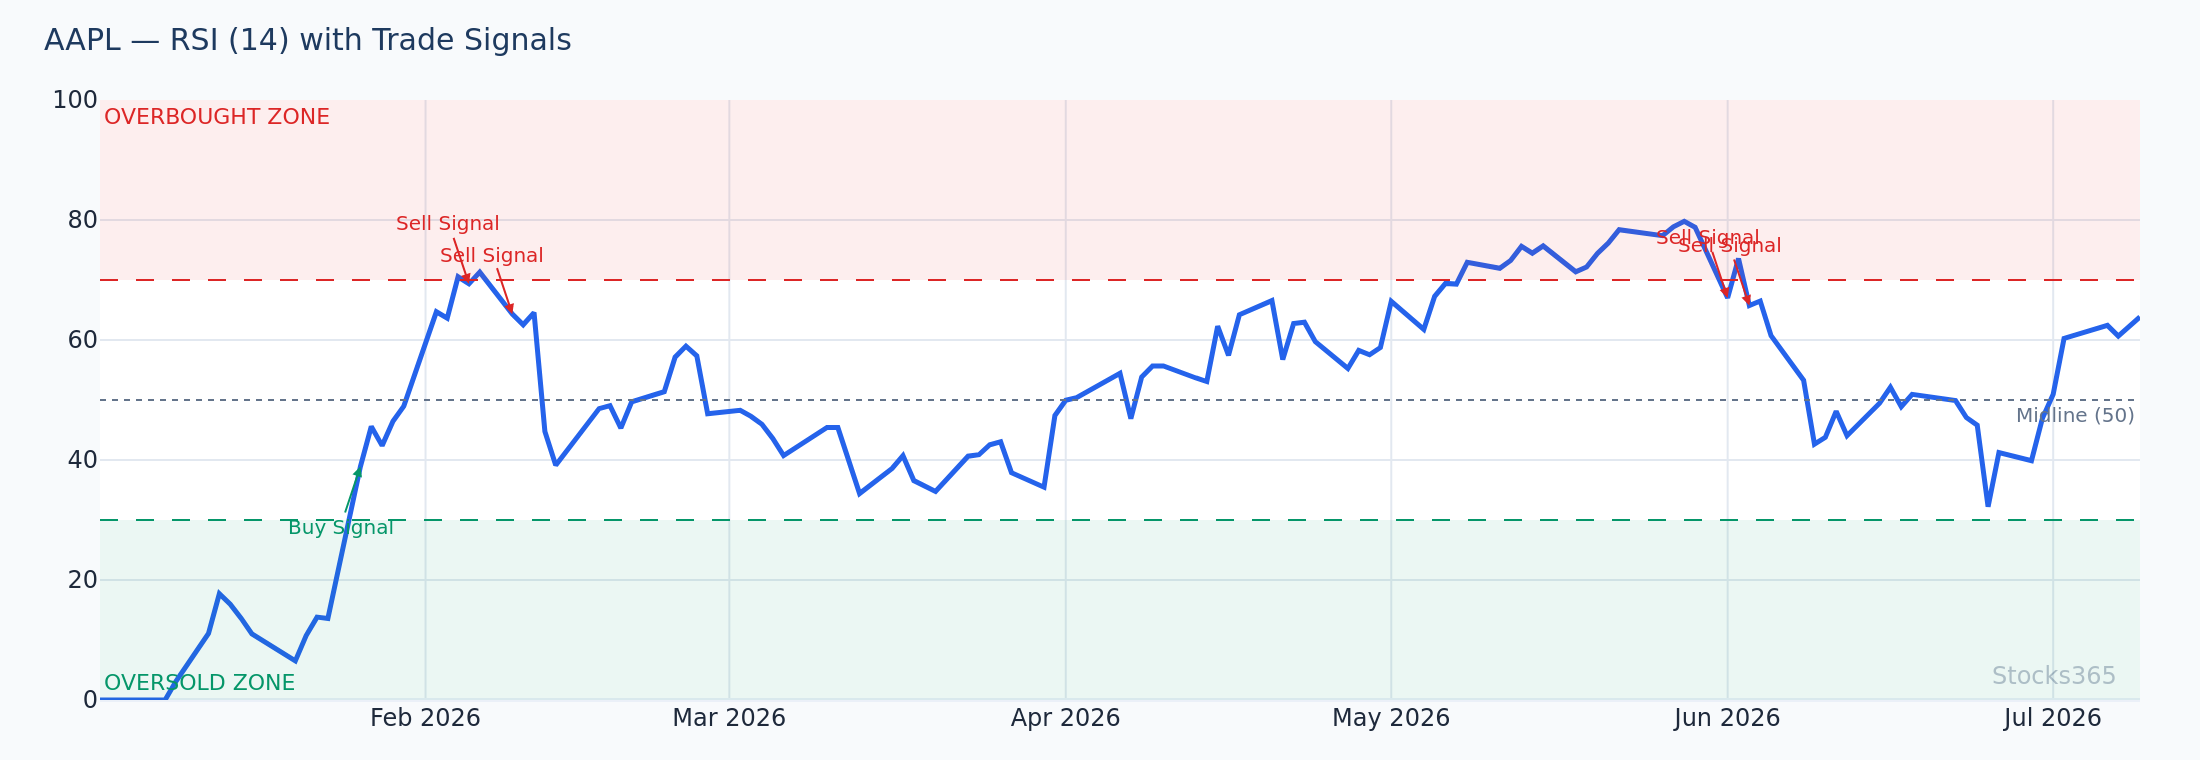
This chart shows price tagging the upper Bollinger Band while RSI prints a lower high — classic divergence. This combination strengthens the mean reversion case significantly. When RSI rolls below 60 while price is still near the upper band, the probability of a middle-band retest increases. The setup fails if RSI holds above 65 and price continues to expand away from the upper band on volume.
3. Lower Band Touch (Bounce Setup)
What it is: Price reaches or closes below the lower band in a range-bound or mildly declining market.
Setup criteria:
- Price closes at or below the lower band
- RSI is below 35 (oversold condition confirming the extreme)
- No confirmed downtrend (ADX below 25 or declining)
- Preferably, a bullish reversal candle forms (hammer, engulfing)
Entry trigger: Price closes back inside the lower band.
Target: Middle band (20-SMA) — same as the upper band setup, just the opposite direction.
Invalidation: Price continues closing below the lower band. That's distribution, not a bounce.
4. Band Width Expansion (Trend Confirmation)
What it is: After a squeeze, band width starts expanding rapidly. This confirms a new trend is underway.
How to use it: Don't fade the move. Add to positions in the trend direction. Trail stops using the middle band (20-SMA) as your dynamic exit level.
When bands expand, the middle band becomes a trailing stop. Price staying above the 20-SMA in a bullish expansion = stay long. Price crossing below the 20-SMA = exit or reduce.
5. The Double Bottom (W-Pattern) at the Lower Band
What it is: Price touches the lower band, bounces toward the middle band, pulls back again — but the second low stays inside the lower band. That's a W-pattern. That's strength.
Entry trigger: Price crosses above the middle band (20-SMA) on the second bounce.
Why it works: The second low holding inside the bands means selling pressure is exhausting. Bulls are absorbing at higher prices on the second dip.
Bollinger Bands Cheat Sheet: Combining With Other Indicators
Bollinger Bands alone are useful. Combined with the right confirmation tools, they become powerful.
Bollinger Bands + RSI
The most natural pairing. RSI measures momentum; Bollinger Bands measure volatility and price extremes. When both agree — price at lower band AND RSI below 30 — you have a high-conviction oversold signal. When price is at the upper band but RSI shows divergence, that's a high-conviction reversion setup.
For a full RSI breakdown, see the RSI Indicator: The Complete Trading Guide for 2026. And for combining RSI with volume confirmation, RSI and Volume Analysis: Master Two Indicators Effectively is essential reading.
Bollinger Bands + Stochastic
The Stochastic Oscillator adds a second layer of cycle timing. When price hits the upper band AND Stochastic is above 80, you have a double overbought signal. Our backtesting of 3,026 such signals found a 49.9% win rate overall — but crypto signals in this configuration hit 58.0%, while commodities lagged at 40.7%.
The asset class matters. Apply this combo aggressively in crypto. Be cautious in commodities. To understand Stochastic mechanics in detail, read How to Read the Stochastic Oscillator: Step-by-Step.
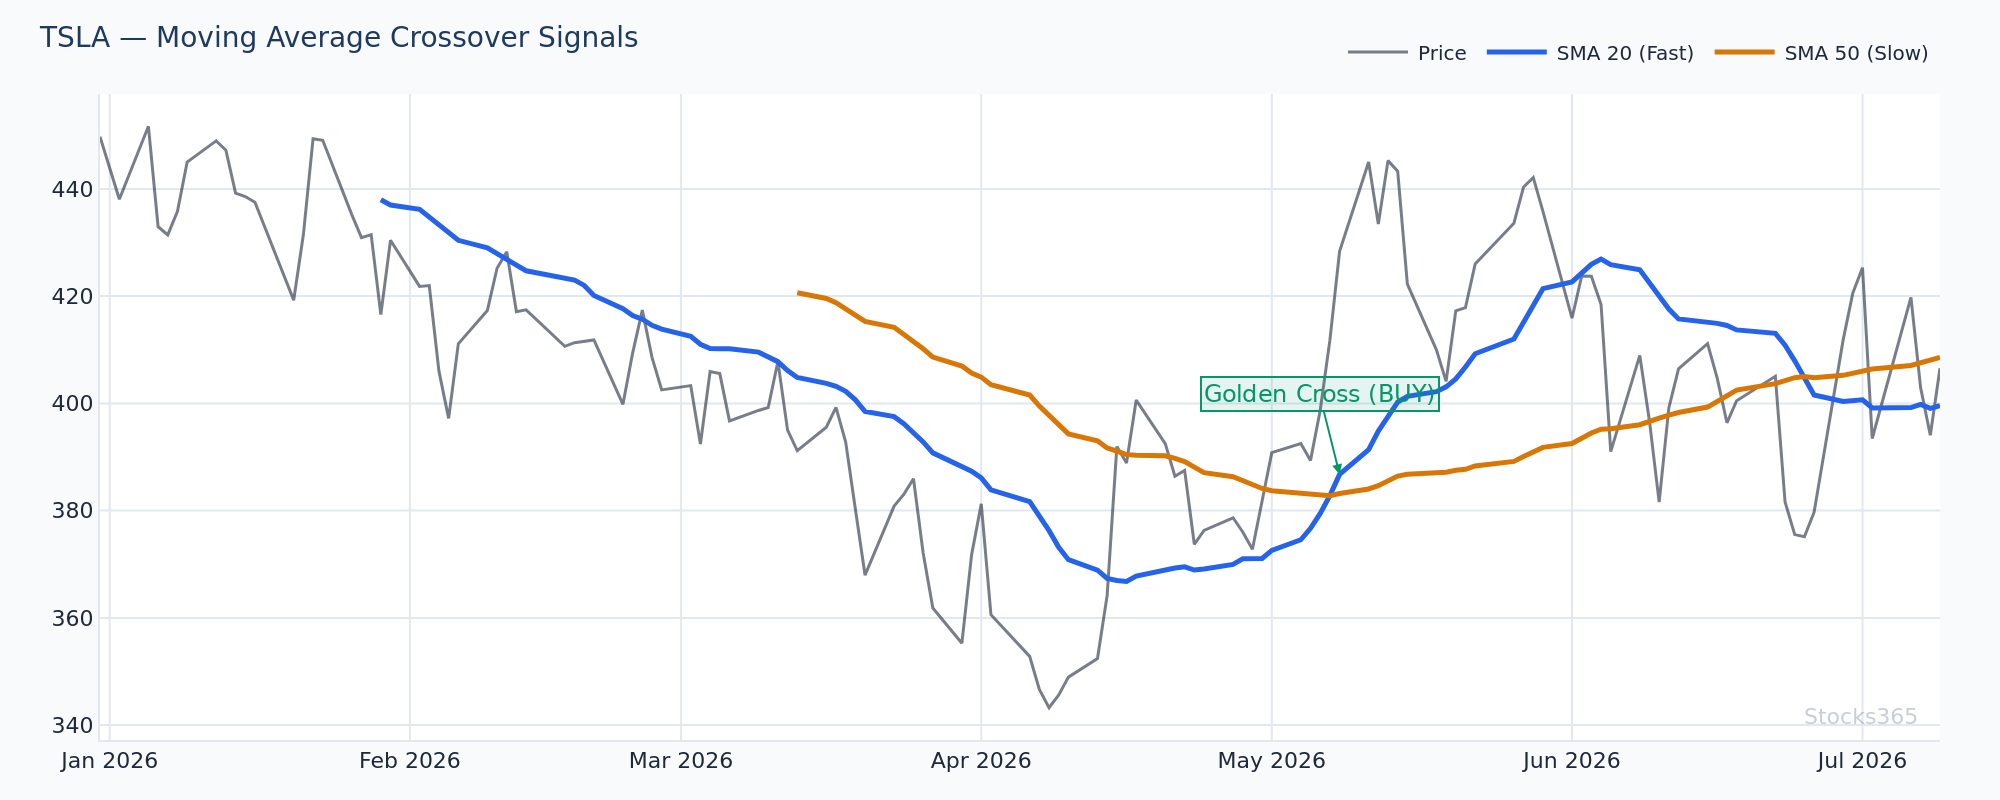
Bollinger Bands + Moving Averages
The middle band IS a moving average (20-SMA). But layering in a 50-SMA or 200-SMA helps define the broader trend context. If price is above the 200-SMA and touches the lower Bollinger Band, that's a much stronger bounce setup than if price is below the 200-SMA. Trend context filters out the noise.
For deeper context on moving average strategies, Moving Average Crossover Strategy: Complete Trading Guide covers the key systems used by professional traders in 2026.
This chart shows TSLA's lower Bollinger Band touch occurring while price remains above the 200-SMA — a bullish structural context. The 20-SMA is the immediate target on any bounce from this zone. The setup invalidates cleanly if price breaks below the 200-SMA on a closing basis, which would signal a structural shift rather than a tactical pullback.
When Bollinger Bands Work — And When They Fail
No indicator works in all conditions. Bollinger Bands are no exception.
When They Work Best
- Range-bound markets: Mean reversion setups (upper/lower band touches) are highly reliable when price oscillates between defined levels
- After low-volatility periods: Squeeze breakouts produce their strongest moves after extended compression
- Crypto markets: Across our backtested data, crypto consistently outperforms other asset classes on Bollinger Band setups due to higher volatility cycles
- Trending markets with pullbacks: Lower band touches in an uptrend produce excellent risk/reward long entries
When They Fail
- Strong trending markets: Price walks along the upper band in a bull trend — upper band touches are not sell signals here
- News-driven gaps: A band break on earnings or macro news often continues, not reverts
- Commodities in momentum moves: Our backtesting shows commodities have the worst performance on band-touch setups — 41.5% win rate on upper band touches specifically
- Low-liquidity instruments: Bands on thinly traded assets generate false breakouts frequently
The lesson: context beats mechanics. Know what market regime you're in before applying any setup from this cheat sheet.
For crypto-specific Bollinger Bands application — including how Bitcoin and altcoins behave differently around band extremes — see Bollinger Bands for Crypto Trading: Bitcoin & Altcoins.
Bollinger Bands Quick Reference Table
Use this as your go-to Bollinger Bands cheat sheet summary:
- Upper Band Touch + ADX <25 + RSI <70: Mean reversion sell — target middle band
- Lower Band Touch + ADX <25 + RSI >30: Mean reversion buy — target middle band
- Squeeze (band width <20th percentile) + Volume surge: Breakout trade — direction confirmed by candle close
- W-Pattern at lower band + price crosses 20-SMA: High-conviction long entry
- Band width expanding + price above 20-SMA: Trend continuation — trail stop at 20-SMA
- Upper band touch + RSI divergence: Strongest mean reversion setup — high confluence
- Walking the upper band + ADX >30: Strong uptrend — do NOT fade, look for pullbacks to 20-SMA instead
Timeframe Considerations for Bollinger Bands
The same setups work across timeframes — but the reliability shifts.
Intraday (5-minute to 1-hour)
Squeezes and band touches happen frequently. More signals, more noise. Require additional confluence — volume, momentum, higher timeframe alignment. False breakouts are common without confirmation.
Daily Charts
The sweet spot for most swing traders. Setups are more reliable, signals are cleaner, and the 20-day SMA holds significant psychological weight with institutional participants.
Weekly Charts
Fewer signals, but very high reliability. A weekly lower band touch with RSI divergence in an uptrend is one of the strongest long setups available to long-term investors. For context on long-term entry timing, Moving Averages for Long-Term Investors: Master Entry Points pairs naturally with weekly Bollinger Band analysis.
What to Watch For
- Bollinger squeeze on tech stocks — when band width drops below the 20th percentile and volume has been declining for 5+ sessions, the next expansion typically produces a 2–3 ATR move. Watch for the first candle to close outside the bands with volume above the 20-period average as your trigger.
- Lower band touch in an established uptrend (price above 200-SMA) with RSI dropping below 35 — this combination in large-cap equities has historically produced high-probability bounces back toward the middle band within 5–8 sessions.
- BB + Stochastic double overbought on crypto assets — when price closes above the upper band AND Stochastic crosses above 80 simultaneously, watch for a bearish engulfing candle as confirmation before entering a short-term mean reversion trade. The edge is in the confirmation candle, not the initial signal.
- Watch for false squeeze breakouts in forex pairs during low-liquidity sessions — band width compression during Asian session hours often resolves with a fake break before the real move initiates in London or New York. Wait for session overlap volume to confirm direction.
- RSI divergence forming at the upper Bollinger Band on weekly charts — when weekly RSI makes a lower high while price makes a higher high at the upper band, this combination on weekly timeframes has preceded notable intermediate-term pullbacks historically.
How Stocks365 Uses This
Stocks365 Bollinger Bands Integration
Bollinger Bands are one of 12+ technical indicators built into the Stocks365 Trust Score system. Specifically, band position and band width contribute to two scoring dimensions: volatility regime classification (squeeze vs. expansion phase) and indicator agreement scoring (whether Bollinger Band signals align with RSI, volume, and momentum readings).
When a stock or crypto asset shows a squeeze breakout that aligns with bullish RSI momentum and above-average volume, the Trust Score reflects higher signal agreement — giving you a clearer, faster read on setup quality without manually checking each indicator.
You can see live Trust Scores and Bollinger Band-based signals for any asset on the Signals Dashboard, or check individual setups like the AAPL signal page for real-time band positioning and confluence scoring. Our research dashboard also surfaces the backtest data behind each signal type so you understand the edge before you trade it.
Key Takeaways
Bollinger Bands Cheat Sheet — Summary
- The squeeze breakout is the highest-probability setup — confirm direction with volume before entering
- Upper and lower band touches are mean reversion signals ONLY in range-bound markets — in trends, price walks the bands
- Bollinger Bands work best when combined with RSI, Stochastic, or volume analysis for confluence
- Crypto markets consistently outperform other asset classes on Bollinger Band setups based on Stocks365 backtested data
- The middle band (20-SMA) is both a target for mean reversion trades and a trailing stop for trend trades
- The W-pattern at the lower band — with the second low staying inside the band — is one of the most reliable reversal signals available
- Context first: identify market regime (trend vs. range) before applying any setup from this cheat sheet