
Moving Averages for Long-Term Investors: How to Time Entry Points That Actually Matter
Most long-term investors ignore moving averages entirely. That's a mistake. Not because short-term price action defines long-term outcomes — it doesn't — but because entry timing affects your cost basis, your drawdown tolerance, and your ability to hold through volatility without panic-selling.
Getting in at a structurally sound price is not market timing in the pejorative sense. It's discipline.
Stocks365 backtested over 3,300 signals across multiple asset classes and found that even simple moving average setups produce measurable, repeatable edges when applied correctly. The nuance is knowing which setup to apply, on which asset class, and during which market regime. That's what this guide covers.
Why Moving Averages Work for Long-Term Investors
Moving averages are not magic lines. They are aggregated price memory — a mathematical representation of where price has been over a defined period. For long-term investors, that memory is valuable context.
When price is consistently above a rising 200-day SMA, institutions are accumulating. When price drifts below a flattening 50-day SMA, distribution is likely underway. These signals don't predict the future with certainty, but they describe the present with clarity.
There are two primary types long-term investors use:
- Simple Moving Average (SMA): Equal weight to every price in the lookback period. Slower to react. Better for identifying macro trend direction.
- Exponential Moving Average (EMA): More weight to recent prices. Faster signal. More useful when you need to catch early-stage trend shifts before they fully develop.
For long-term investing specifically, the 50-day, 100-day, and 200-day SMAs are the workhorses. They cut through daily noise and reveal whether a stock is in a structural uptrend, a transition phase, or a prolonged decline.
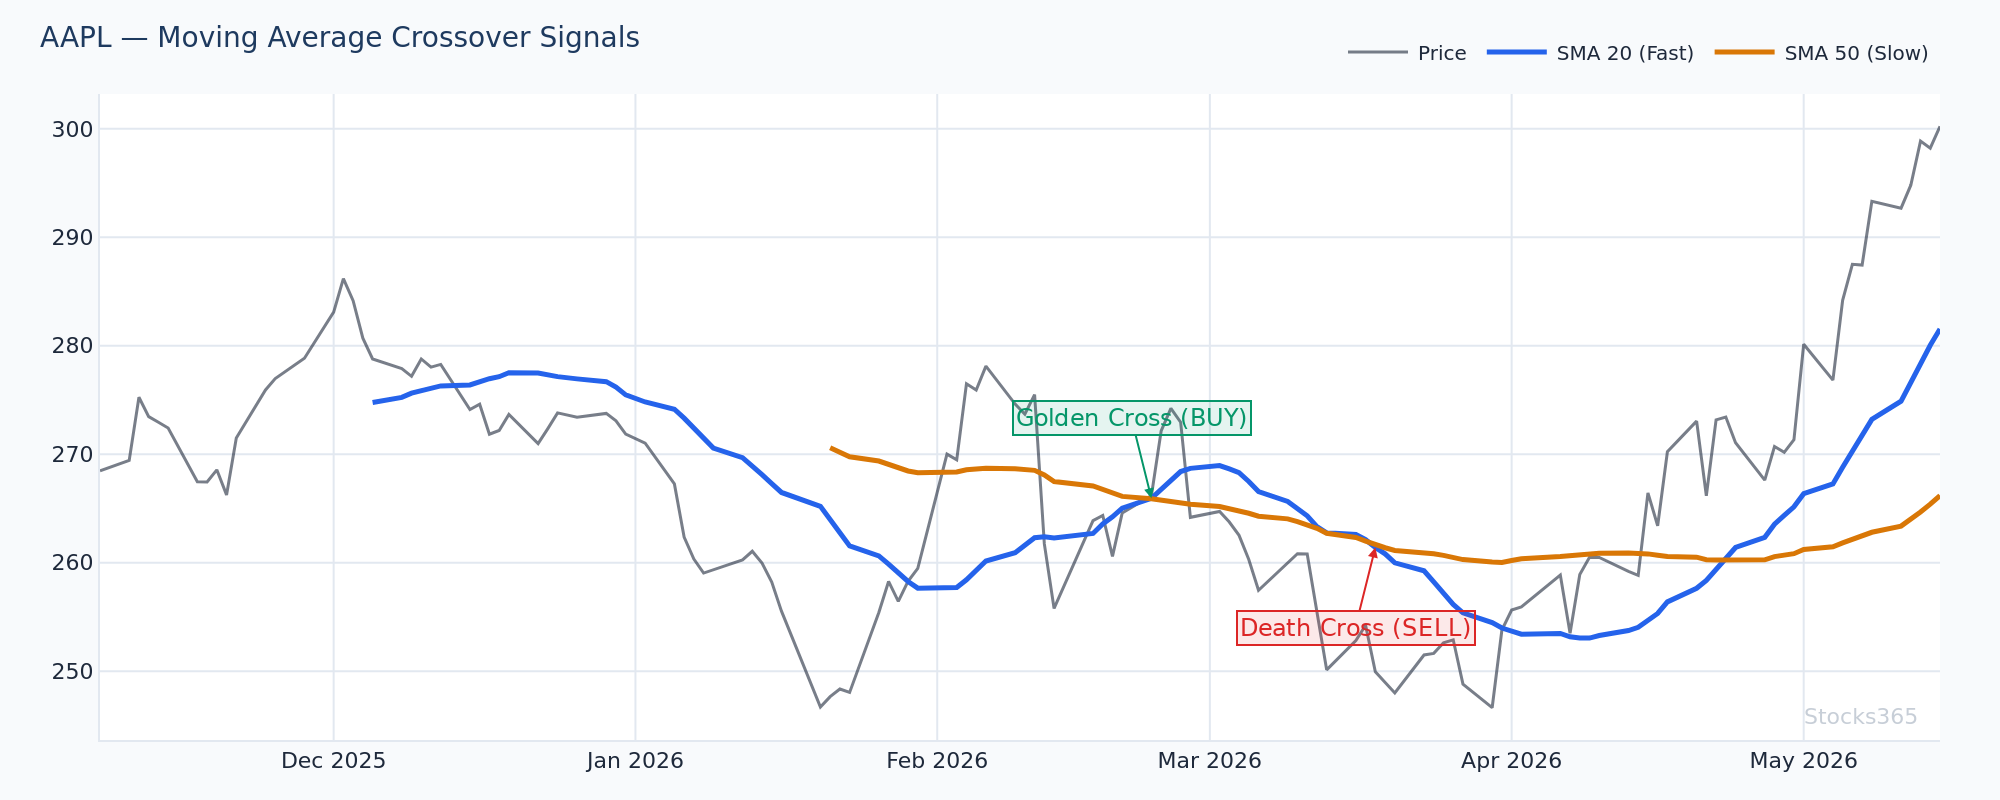
This chart shows AAPL's price relationship with both the 50-day and 200-day SMAs. When the 50-day crosses above the 200-day — the classic "Golden Cross" — it confirms a macro trend shift from bearish to bullish. Price holding above both moving averages after the cross is the confirmation signal. A close back below the 50-day within two weeks of the cross typically invalidates the setup.
The Golden Cross and Death Cross: Long-Term Entry Signals Explained
The Golden Cross (50-day SMA crossing above the 200-day SMA) is the most watched moving average signal for long-term investors. The Death Cross is its inverse — the 50-day crossing below the 200-day.
These signals are lagging by design. They're not built to catch the exact bottom. They're built to confirm that a trend has changed before you commit significant capital.
Setting Up a Golden Cross Entry
The setup isn't just the crossover itself — it's what happens in the days that follow:
- Price breaks above the 200-day SMA ahead of the crossover (early signal)
- Volume on up days exceeds volume on down days during the base formation
- The 50-day SMA slope turns positive — it's no longer flattening, it's rising
- Price holds above both SMAs on the first pullback after the cross
That first pullback test is critical. It separates genuine trend reversals from bear market bounces. If price reclaims both SMAs after testing them, you have institutional support. If it collapses through both, the cross was a false signal.
Here's what most traders get wrong:
Most long-term investors wait for the Golden Cross to appear on the chart before acting — and then buy immediately at the crossover candle. That's exactly backwards. By the time the 50-day SMA crosses the 200-day, price has often already moved 15–25% off its lows. The better approach is to track price's relationship with the 200-day SMA in real time and start building a position when price reclaims the 200-day with volume confirmation — before the formal cross appears. The Golden Cross then becomes your signal to add to an existing position, not initiate one from scratch.
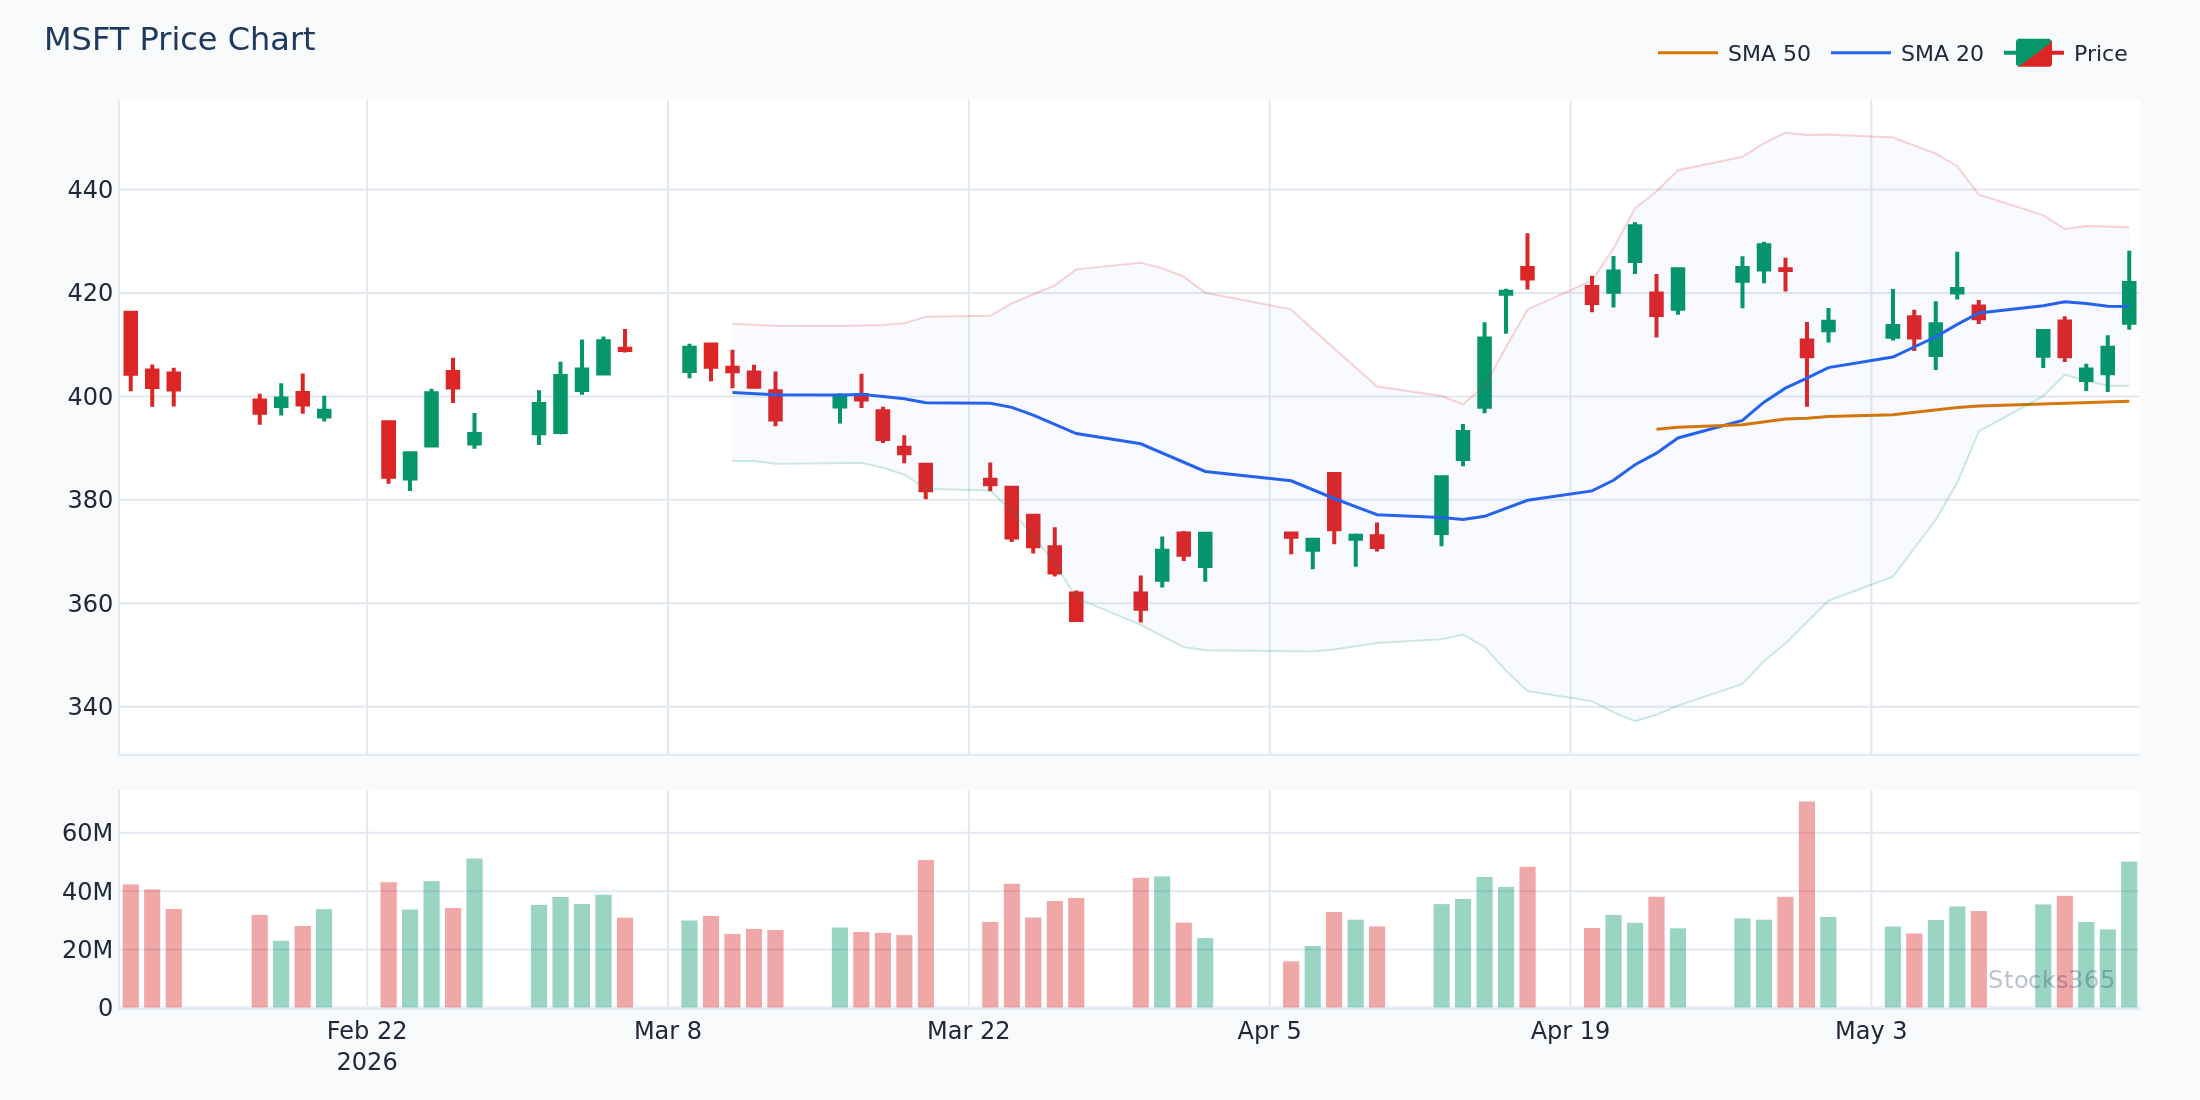
This chart illustrates a textbook entry zone: price dips below the 200-day SMA, consolidates tightly for several sessions, then closes back above it on expanding volume. The tight consolidation below the 200-day is the compression phase — the setup. The high-volume reclaim is the trigger. If price immediately fails back below the 200-day on the next session, the move is likely a false breakout and the setup is invalidated.
Using the 50-Day SMA as a Pullback Entry in an Uptrend
In a confirmed long-term uptrend — price above a rising 200-day SMA — the 50-day SMA becomes your primary entry tool on pullbacks.
This is one of the cleanest setups in long-term investing.
When a strong stock pulls back to touch the rising 50-day SMA after an extended move higher, you're buying a healthy correction within a healthy trend. You're not catching a falling knife. You're adding to a winner at a structurally sound price.
What a High-Quality 50-Day Pullback Looks Like
- Price has been above the 200-day SMA for at least 3–4 months
- The pullback is orderly — lower volume on down days, decreasing selling pressure
- Price reaches the 50-day SMA and either gaps up the next session or forms a tight base
- RSI on the daily chart drops toward the 40–50 zone (not oversold, just reset)
- The 50-day SMA itself is still sloping upward — not flattening or turning down
Pair this setup with the RSI trendline strategy for additional confirmation. When RSI forms a higher low on the pullback — even as price tests the 50-day — you have momentum divergence supporting the long case.
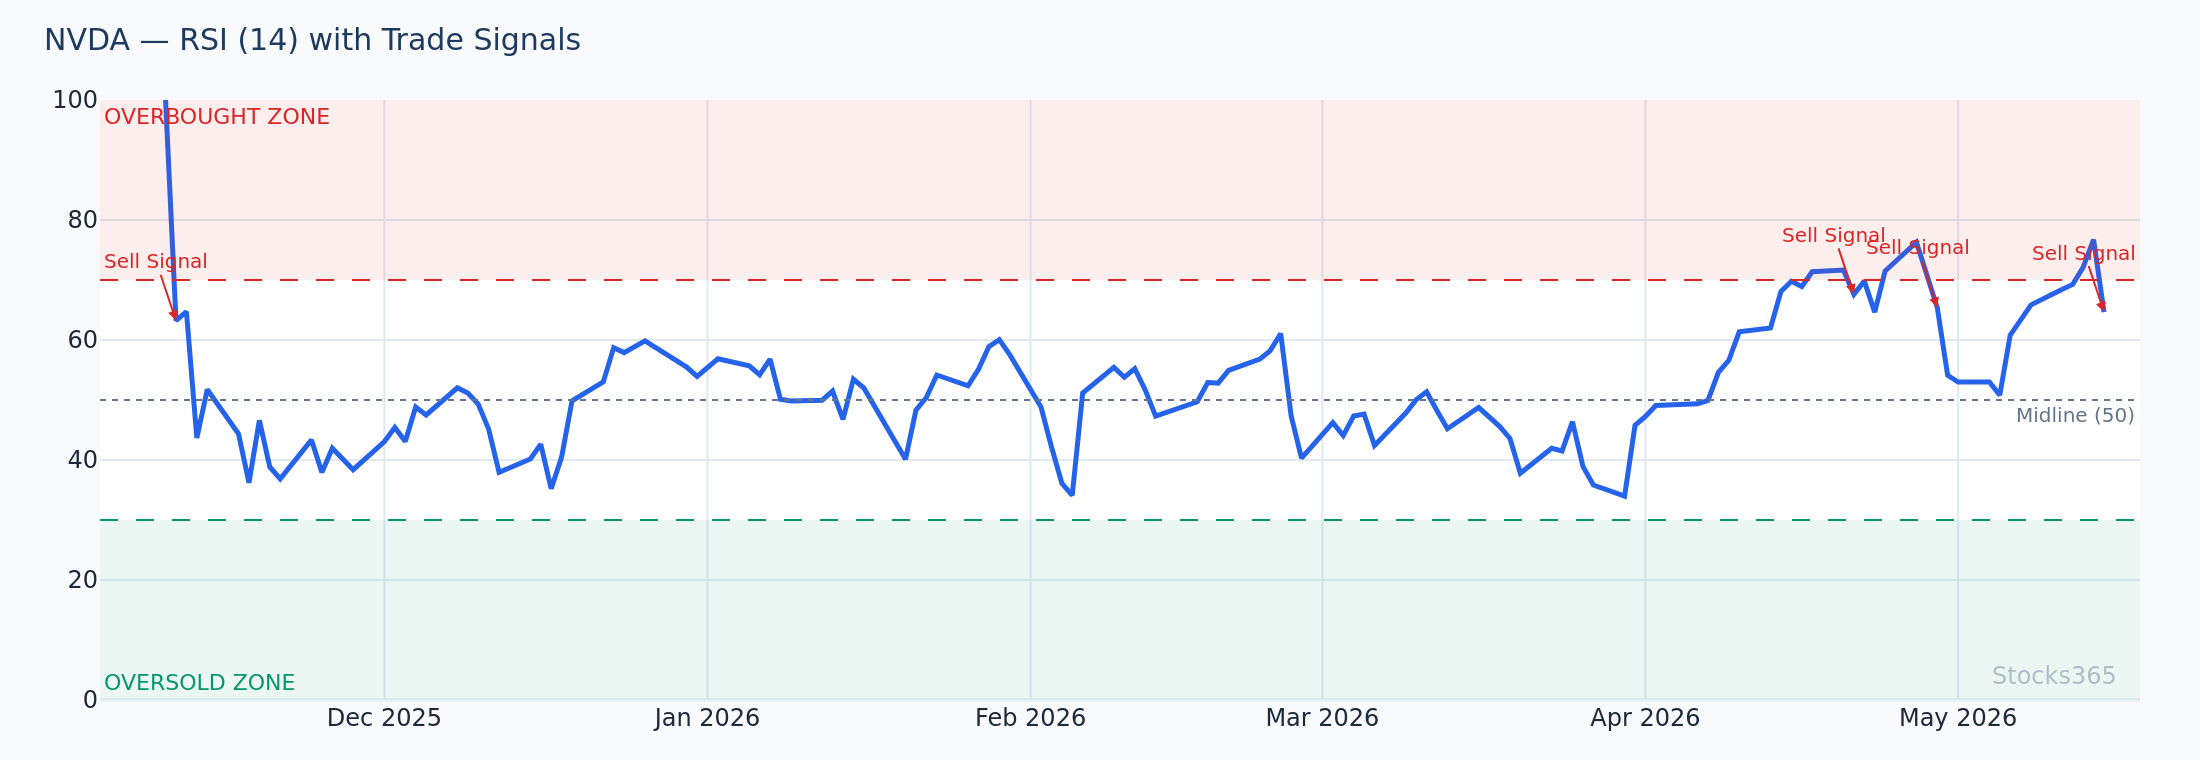
This RSI chart shows NVDA during a 50-day SMA pullback. RSI drops to the 42–48 range — a momentum reset, not an oversold condition. A higher low on RSI while price tests the 50-day SMA is a bullish divergence signal. RSI recrossing above 50 from that level is the entry trigger. If RSI breaks below 40 and continues falling, the pullback has become a breakdown and the 50-day is likely to fail as support.
The 200-Day SMA: Your Long-Term Compass
No moving average matters more for long-term investors than the 200-day SMA.
Legendary fund managers, institutional desks, and systematic strategies all use it as a regime filter. Price above a rising 200-day SMA means you're in a bull market phase. Price below a declining 200-day SMA means you're not — and building large long-term positions in that environment demands exceptional selectivity.
The 200-day SMA won't save you from every bear market. But it will keep you out of the worst ones if you respect it as a filter. When a stock that's been in a multi-year uptrend breaks decisively below its 200-day SMA on high volume, that's not a buying opportunity. That's a warning.
Regime Filtering: What the 200-Day Tells You
Use the 200-day SMA as a binary regime indicator before you do anything else:
- Price above rising 200-day: Accumulation regime. Add on pullbacks to the 50-day.
- Price below falling 200-day: Distribution regime. Reduce exposure. Wait for reclaim.
- Price oscillating around a flat 200-day: Transition phase. Reduce position size. Increase confirmation requirements.
For multi-indicator confirmation in transition phases, the Triple Moving Average Strategy adds a third time frame (typically the 20-day or 100-day) to filter out whipsaws and identify genuine trend resumptions with higher probability.
When Moving Average Strategies Work — and When They Don't
This is the part most guides skip. Understanding where a strategy fails is more valuable than celebrating where it succeeds.
Our analysis of 3,289 Price Crosses Above SMA 20 signals shows a 48.3% win rate overall — but the breakdown by asset class tells the real story. Stocks outperform at 52.3%, while crypto dramatically underperforms at just 36.9% for this specific setup. That's not a small variance. That's a structural difference in how price behaves relative to moving averages across different market types. You can explore the full methodology and asset-class breakdowns on our research dashboard.
Moving averages work best when:
- The asset is in a clear, sustained trend (up or down)
- Volume confirms price movement at key MA levels
- The broader market index (S&P 500, Nasdaq) is also in an uptrend above its own 200-day SMA
- The holding period aligns with the MA timeframe (don't use a 200-day MA for a 2-week trade)
Moving averages fail when:
- The market is choppy and range-bound — MAs produce constant false crossovers
- A stock is in a news-driven, gap-heavy phase — price jumps over MAs without touching them
- You're applying short-term MAs (20-day) to make long-term investment decisions
The fix for choppy conditions is to require more confirmation before acting. Layer in the Moving Average Crossover Strategy with volume filters, or combine with momentum indicators like RSI to reduce false signals during low-conviction periods.
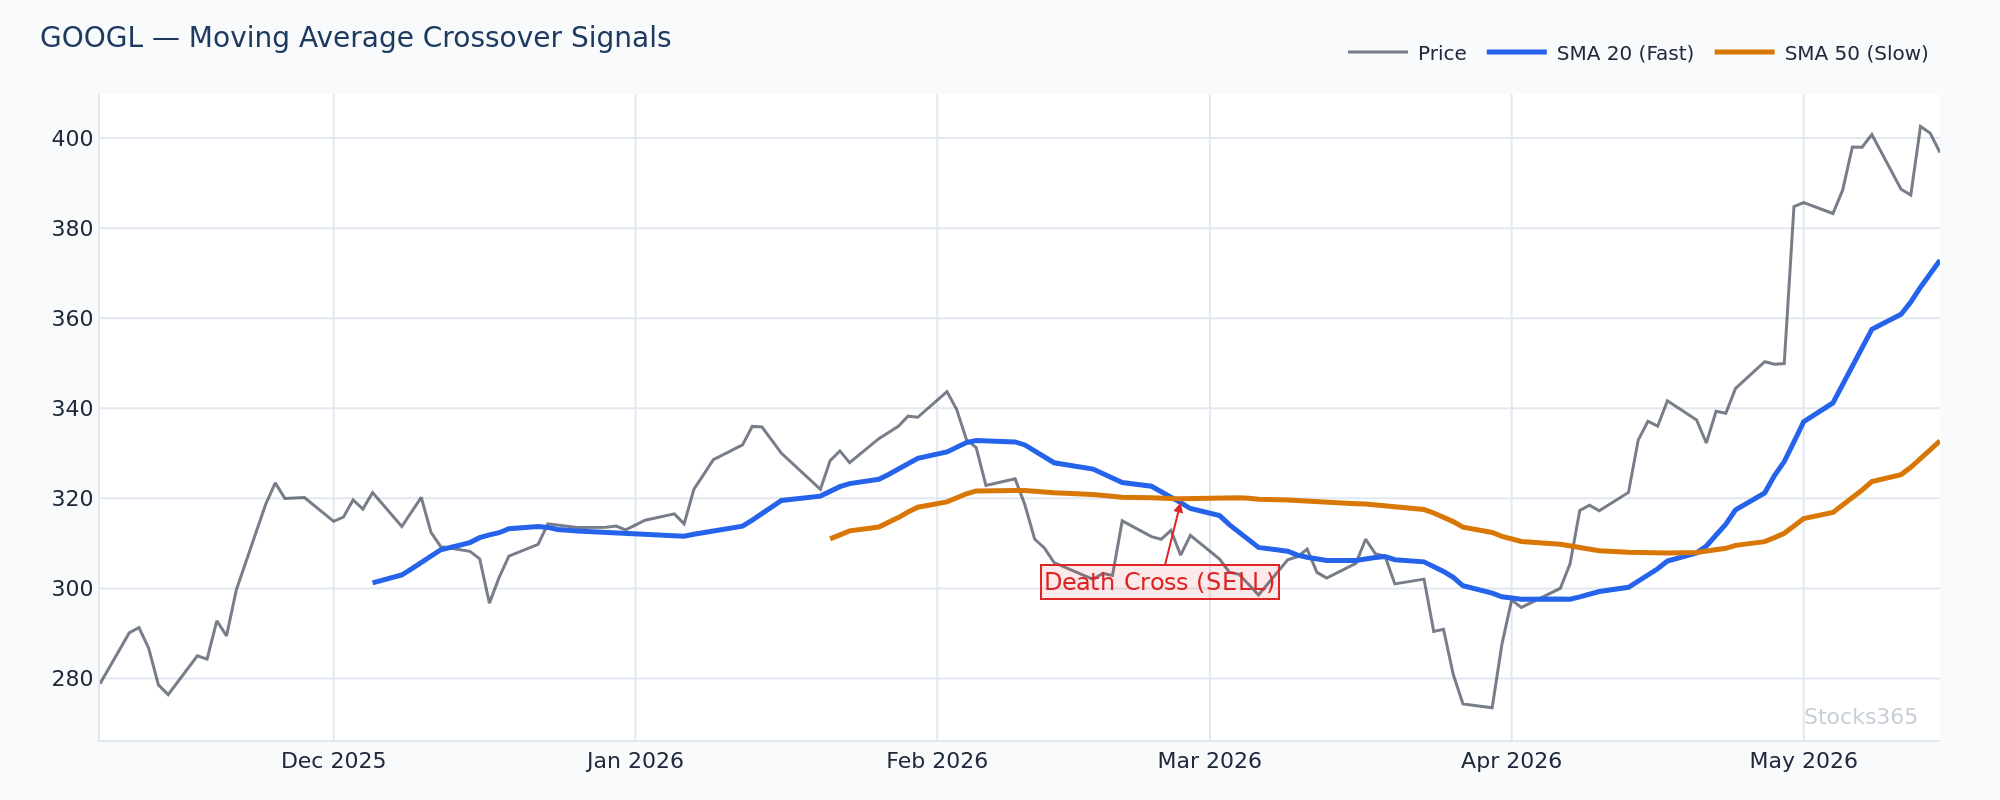
This chart displays GOOGL's 50-day and 200-day SMAs alongside price action across a full market cycle. Note how the gap between the two SMAs expands during strong trending phases and compresses during consolidation. A narrowing gap combined with flattening slope on both MAs signals an impending transition — either a breakdown or a new accumulation phase. The first decisive directional move away from this compression typically sets the tone for the next 6–12 months of price action.
Combining Moving Averages with Momentum Indicators
Moving averages tell you where price is relative to its history. Momentum indicators tell you how fast it's moving and whether that speed is accelerating or fading. Together, they're a powerful combination for long-term entry timing.
Moving Averages + RSI
The ideal long-term entry combines a moving average trigger with an RSI confirmation:
- Price reclaims the 200-day SMA (MA trigger)
- RSI crosses back above 50 from below (momentum confirmation)
- RSI shows a bullish divergence on the weekly chart — higher lows on RSI while price makes lower lows
This combination dramatically reduces false entries compared to using moving averages alone. For advanced practitioners, hidden RSI divergence during a pullback to the 50-day SMA is one of the highest-probability setups available to long-term investors.
Moving Averages + MACD
MACD adds another dimension: the relationship between two EMAs expressed as a histogram. When MACD turns positive as price reclaims its 200-day SMA, you have three-dimensional confirmation — price structure, trend direction, and momentum alignment. The MACD framework for forex applies equally well to equities on higher timeframes.
Building a Position Using Moving Average Levels
Long-term investors don't buy everything at once. Smart position building uses moving average levels as tranches.
Here's a practical framework:
- Tranche 1 (25% of full position): Price reclaims the 200-day SMA on above-average volume
- Tranche 2 (35% of full position): Golden Cross confirmed, price holds above both SMAs on first pullback
- Tranche 3 (40% of full position): Price breaks to new 52-week highs above prior resistance — trend fully confirmed
This approach lowers average cost basis compared to all-in entries and allows you to abandon the thesis cheaply if Tranche 1 fails quickly. Use the Stocks365 signals dashboard to monitor MA levels across your watchlist in real time, with trust score overlays that factor in whether price action is confirming or diverging from the moving average signal.
For individual stock analysis, the AAPL signal page shows real-time moving average positioning alongside the full trust score breakdown — a faster way to evaluate setup quality without building every chart manually.
Patience is the edge. Most investors buy before the confirmation arrives.
What to Watch For
- Watch for price reclaiming the 200-day SMA on weekly close with volume 1.5x the 20-day average — this is a high-conviction signal that institutional buyers are returning. A single intraday cross doesn't count. You need the weekly candle to close above it.
- Watch for the 50-day SMA slope turning positive after a prolonged flat or declining phase — this transition from distribution to accumulation often precedes a Golden Cross by 4–6 weeks, giving early-entry investors a meaningful timing advantage.
- Watch for tight price consolidation (low ATR, inside bars) directly on top of the 200-day SMA — when volatility compresses at a major moving average rather than immediately bouncing or breaking, the eventual resolution tends to be sharp and directional.
- Watch for RSI holding above 50 on the weekly chart while price retests the 50-day SMA on the daily chart — this multi-timeframe alignment means the weekly trend is intact while the daily is offering a lower-risk add point.
- Watch for stocks where the 20-day, 50-day, and 200-day SMAs are stacked bullishly (20 above 50 above 200, all rising) — this triple alignment, particularly after a shallow pullback to the 20-day, represents a trend continuation setup with historically strong follow-through in large-cap equities.
Key Takeaways
Summary: Moving Averages for Long-Term Investors
- The 200-day SMA is your primary regime filter — don't build large long-term positions below a declining 200-day SMA.
- The Golden Cross (50-day crossing above 200-day) is a confirmation tool, not an initiation signal. Build your position as price reclaims the 200-day, before the cross appears.
- The 50-day SMA pullback in an established uptrend is one of the cleanest, most repeatable entry setups available to long-term investors.
- Combine moving averages with RSI and MACD for multi-dimensional confirmation — MA structure + momentum alignment dramatically reduces false entries.
- Asset class matters. Moving average signals on stocks outperform the same signals on crypto or forex. Match the setup to the asset type.
- Position building in tranches using MA levels as triggers lowers cost basis and protects capital if the thesis fails early.
- The Stocks365 trust score system integrates moving average positioning as one of 12+ indicators — use it to quickly assess whether a setup meets multi-indicator confirmation criteria.
How Stocks365 Uses This
Stocks365 Trust Score Integration: Moving AveragesMoving average positioning is one of 12+ indicators that feed into the Stocks365 Trust Score system. Specifically, the Trust Score evaluates whether price is above or below the 20-day, 50-day, and 200-day SMAs simultaneously — and weights these signals based on slope direction and volume confirmation. A stock where price sits above all three rising SMAs receives a higher "trend agreement" component in its Trust Score, reflecting that multiple time horizons are aligned. When the 50-day and 200-day SMAs form a Golden Cross configuration while price holds above both, the Trust Score's regime indicator shifts to "bullish structural," triggering heightened signal sensitivity for long setups. Conversely, a Death Cross with price below both SMAs suppresses long signals regardless of short-term momentum readings. This prevents chasing bounces in downtrends — one of the most common and costly mistakes long-term investors make. Visit the signals dashboard to see Trust Scores updated in real time across your watchlist.