
Why RSI Volume Analysis Is the Edge Most Traders Are Missing
Most retail traders treat RSI and volume as separate tools — checking one, then glancing at the other as an afterthought. Professional traders know better. RSI volume analysis — the deliberate, systematic combination of the Relative Strength Index with volume data — is one of the most reliable methods for filtering high-probability trade setups from the noise.
Alone, RSI tells you about momentum and price strength. Alone, volume tells you about participation and conviction. Together, they create a picture of whether a move is real or a trap. In 2026, with algorithmic trading accounting for the majority of daily market volume, understanding which signals are backed by genuine participation has never been more critical.
If you're new to the RSI itself, start with our foundational guide: What Is RSI? The Complete Beginner's Guide. Once you understand the basics, this article will show you how to take your analysis to the next level by layering in volume confirmation.
Understanding the Two Pillars: RSI and Volume
What RSI Measures and Why It Matters
The Relative Strength Index is a momentum oscillator that moves between 0 and 100, measuring the speed and magnitude of price changes over a given lookback period (typically 14 periods). It answers a simple but powerful question: Is this asset being bought or sold more aggressively than usual?
Traditional RSI interpretation flags readings above 70 as overbought and below 30 as oversold. For a deeper dive into those thresholds, see our article on RSI Overbought and Oversold Levels: Master the Signals. But here's the catch: an RSI reading alone doesn't tell you how many market participants are behind the move. That's exactly where volume steps in.
What Volume Tells You That Price Cannot
Volume represents the total number of shares, contracts, or units traded during a given period. It is often described as the fuel behind a price move. High volume on an advancing price bar signals broad market participation — institutions, funds, and retail traders all moving in the same direction. Low volume on an advancing bar suggests the move may be driven by a small number of participants and is therefore more susceptible to reversal.
The key principle is straightforward: price moves on high volume are more trustworthy than price moves on low volume. When you combine this principle with RSI readings, you gain a two-dimensional view of market conviction that neither indicator can provide alone.
The Core Framework for RSI Volume Analysis
Rule 1: High Volume Confirms RSI Signals
The most fundamental rule of RSI volume analysis is that any RSI signal — whether a cross of the 50 midline, an overbought/oversold reading, or a divergence — carries significantly more weight when accompanied by above-average volume.
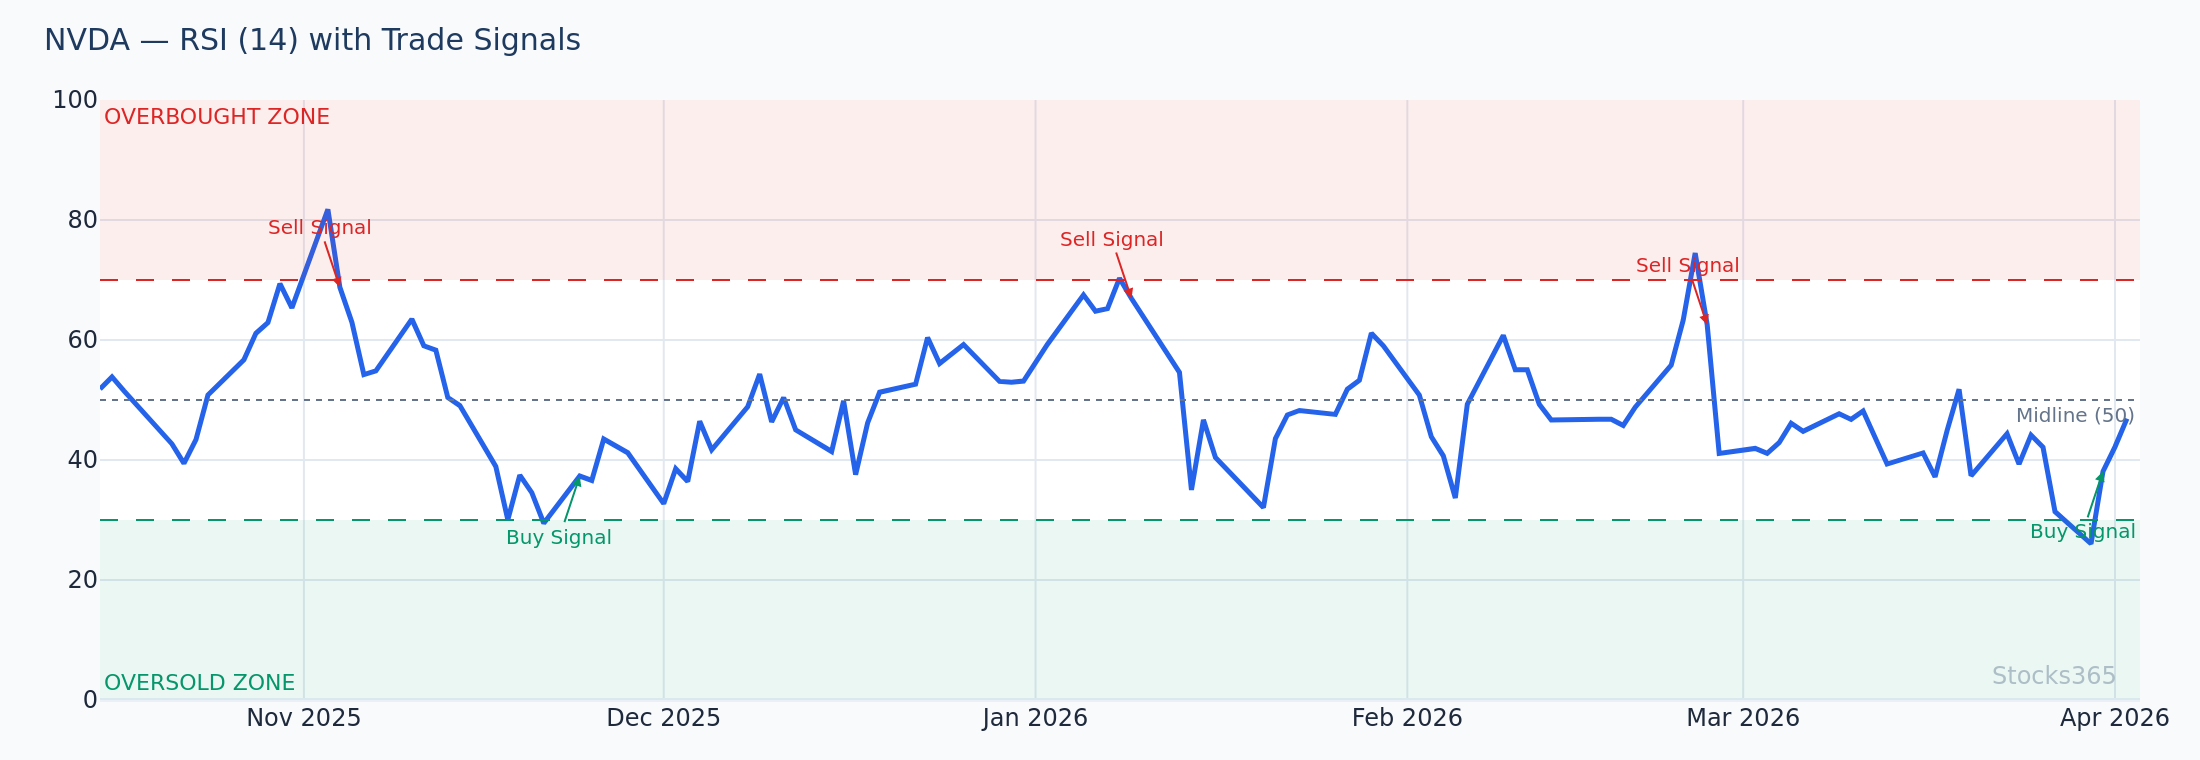
Consider a practical example. Imagine NVDA is trading at $142, and RSI crosses above 50 (signaling shifting bullish momentum) on a day when volume is 2.3x the 20-day average volume. That is a high-confidence signal. Now compare that to RSI crossing above 50 on a day when volume is only 0.6x the average — that signal deserves far more skepticism. The price move may simply reflect thin market conditions rather than genuine buying interest.
How to apply this in practice:
- Calculate the 20-day or 50-day average volume for your target asset
- Only act on RSI signals when volume exceeds 1.2x to 1.5x that average
- Treat low-volume RSI signals as provisional alerts, not confirmed entries
- Use volume spikes of 2x or more as potential trend-change confirmations
Rule 2: Divergence Becomes Powerful With Volume Confirmation
RSI divergence — where price makes a new high or low but RSI fails to confirm — is already a powerful signal. Add volume analysis and the signal becomes dramatically more reliable. For a full breakdown of divergence mechanics, see our guide on RSI Divergence Explained: Master Bullish & Bearish Signals.
Here's how volume enhances divergence signals:
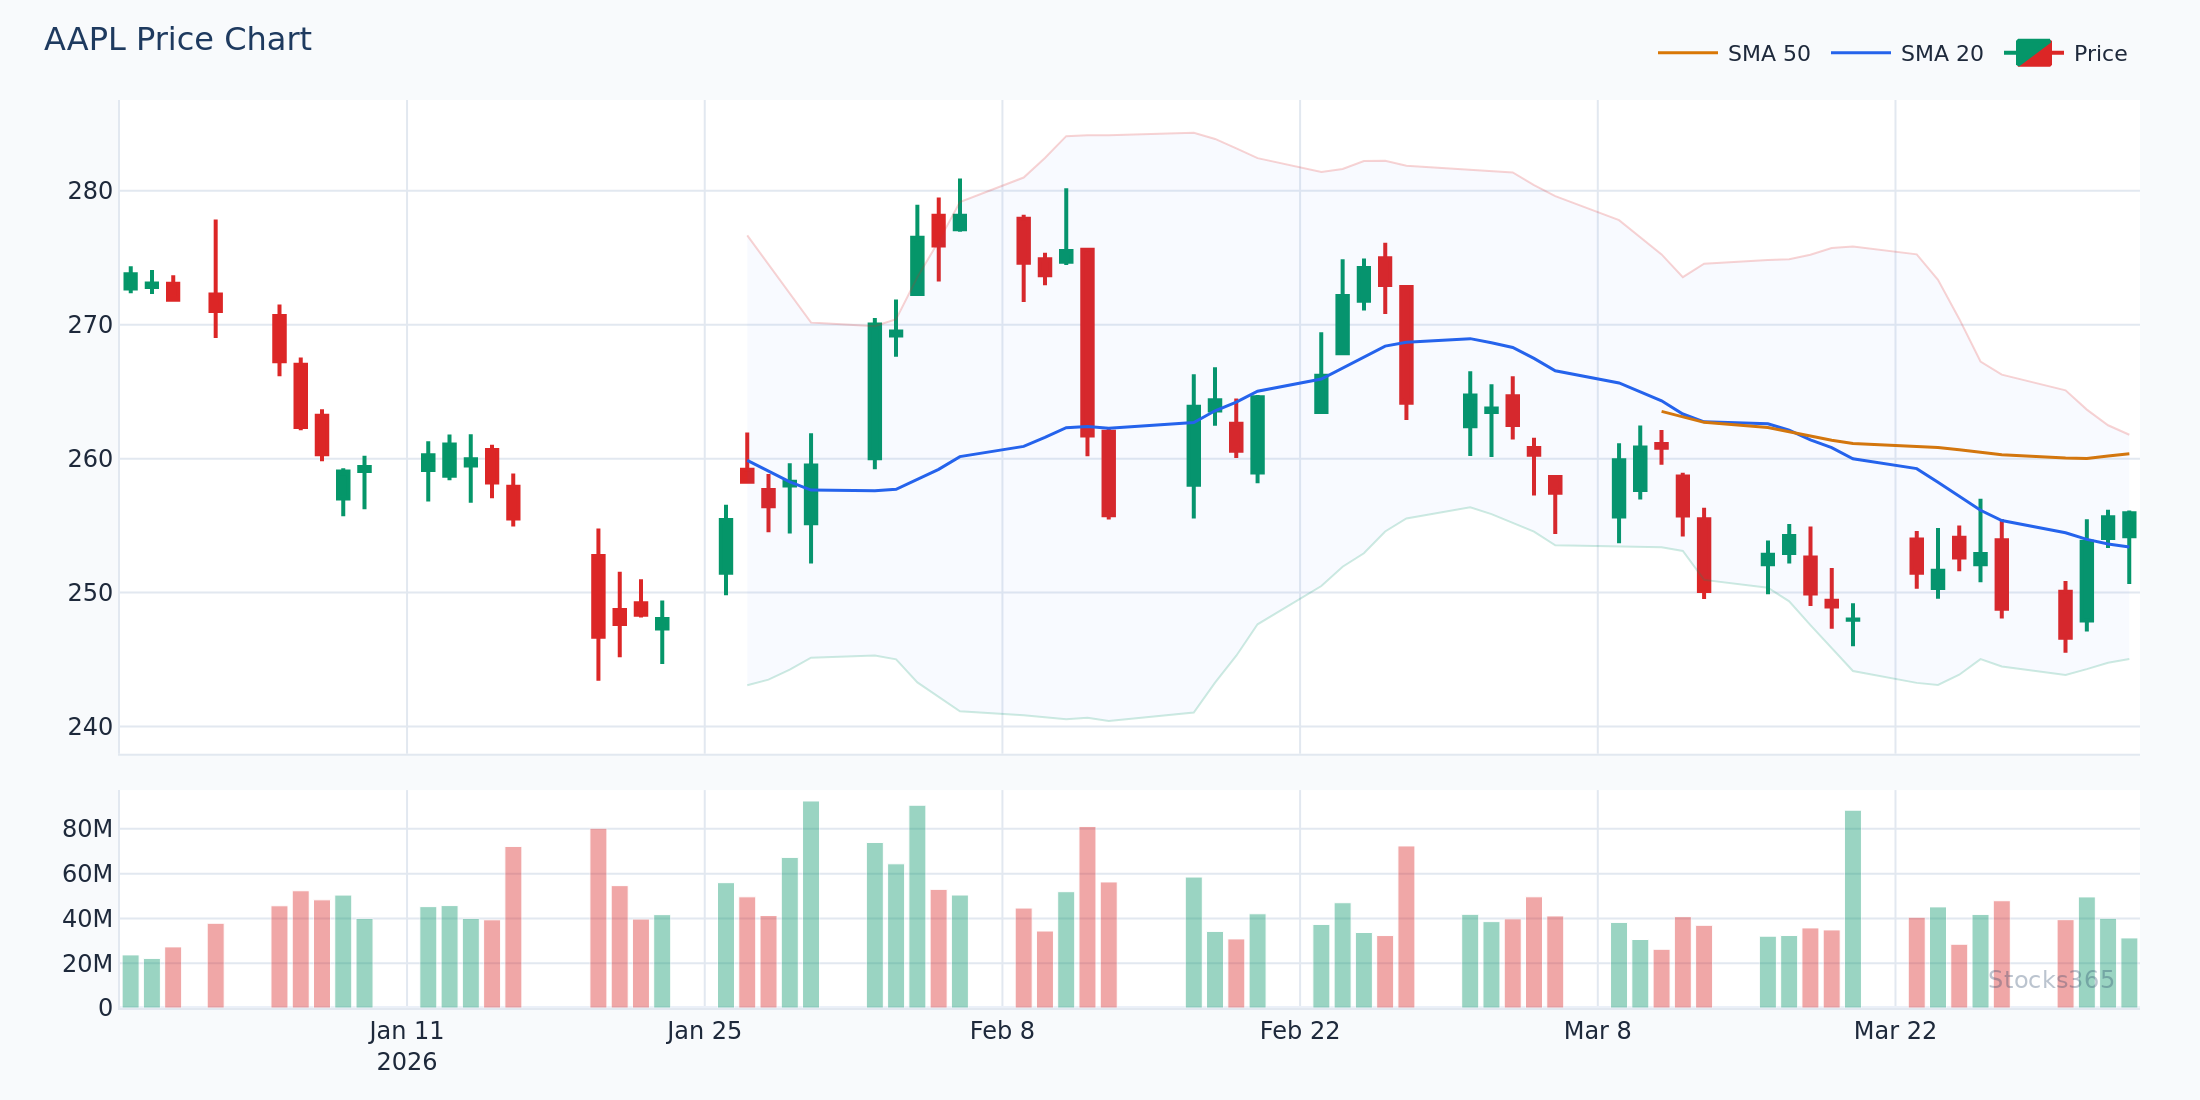
- Bearish divergence with declining volume on rallies: If AAPL is pushing to new highs at $248 but volume on each successive rally leg is decreasing — say 45M shares on the first push, 31M on the second, 22M on the third — while RSI is making lower highs, you have textbook distribution. Institutions are quietly selling into retail buying. This is one of the most reliable reversal setups in technical analysis.
- Bullish divergence with expanding volume on declines turning into expanding volume on bounces: If MSFT drops from $420 to $390, making a lower low with RSI making a higher low, and volume surges on the bounce off $390, that volume surge confirms institutional accumulation. The divergence is validated by money flowing in.
Rule 3: Volume Climax Events and RSI Extremes
A volume climax — an extraordinary spike in volume, often 3x to 5x average or more — combined with an RSI extreme (below 20 or above 80) frequently marks exhaustion points in a trend. This is sometimes called a selling climax (at lows) or a buying climax (at highs).
Practical example: Suppose TSLA has been in a downtrend and hits $195. Volume spikes to 4x the 20-day average as RSI drops to 18. The sheer volume of selling, combined with an extreme RSI reading, suggests that everyone who wanted to sell has already sold. The market is exhausted to the downside. Contrarian traders look for these setups as potential reversal entries, using the RSI volume combination to time their positioning.
Key characteristics of a volume climax to watch for:
- Volume 3x or more above the 20-day moving average
- RSI below 20 (selling climax) or above 80 (buying climax)
- A long price wick or reversal candle on the climax bar
- RSI beginning to curl back toward the midline in subsequent sessions
Advanced RSI Volume Analysis Strategies
The Volume-Weighted RSI Approach
Standard RSI, as described in our technical explainer on How RSI Is Calculated: Formula Explained Step by Step, uses raw price changes in its calculation. An advanced variation — sometimes implemented on platforms like Stocks365 — incorporates volume weighting so that price changes on high-volume sessions carry more influence in the RSI calculation than those on low-volume sessions.
The result is an RSI that is less susceptible to manipulation and thin-market noise. A stock that gaps up 3% on 20% of normal volume won't move the volume-weighted RSI nearly as much as the same move on 200% of normal volume. This naturally filters out low-conviction signals.
For traders who prefer to work with standard RSI settings but want to replicate this effect, one practical workaround is to overlay a volume indicator alongside standard RSI and manually apply the volume filter before acting on any RSI signal — which is essentially what we've described throughout this article.
RSI Volume Analysis Across Different Timeframes
One of the most powerful applications of RSI volume analysis is using it across multiple timeframes. The principle is to align RSI and volume signals on higher timeframes before timing your entry on lower timeframes.
For example:
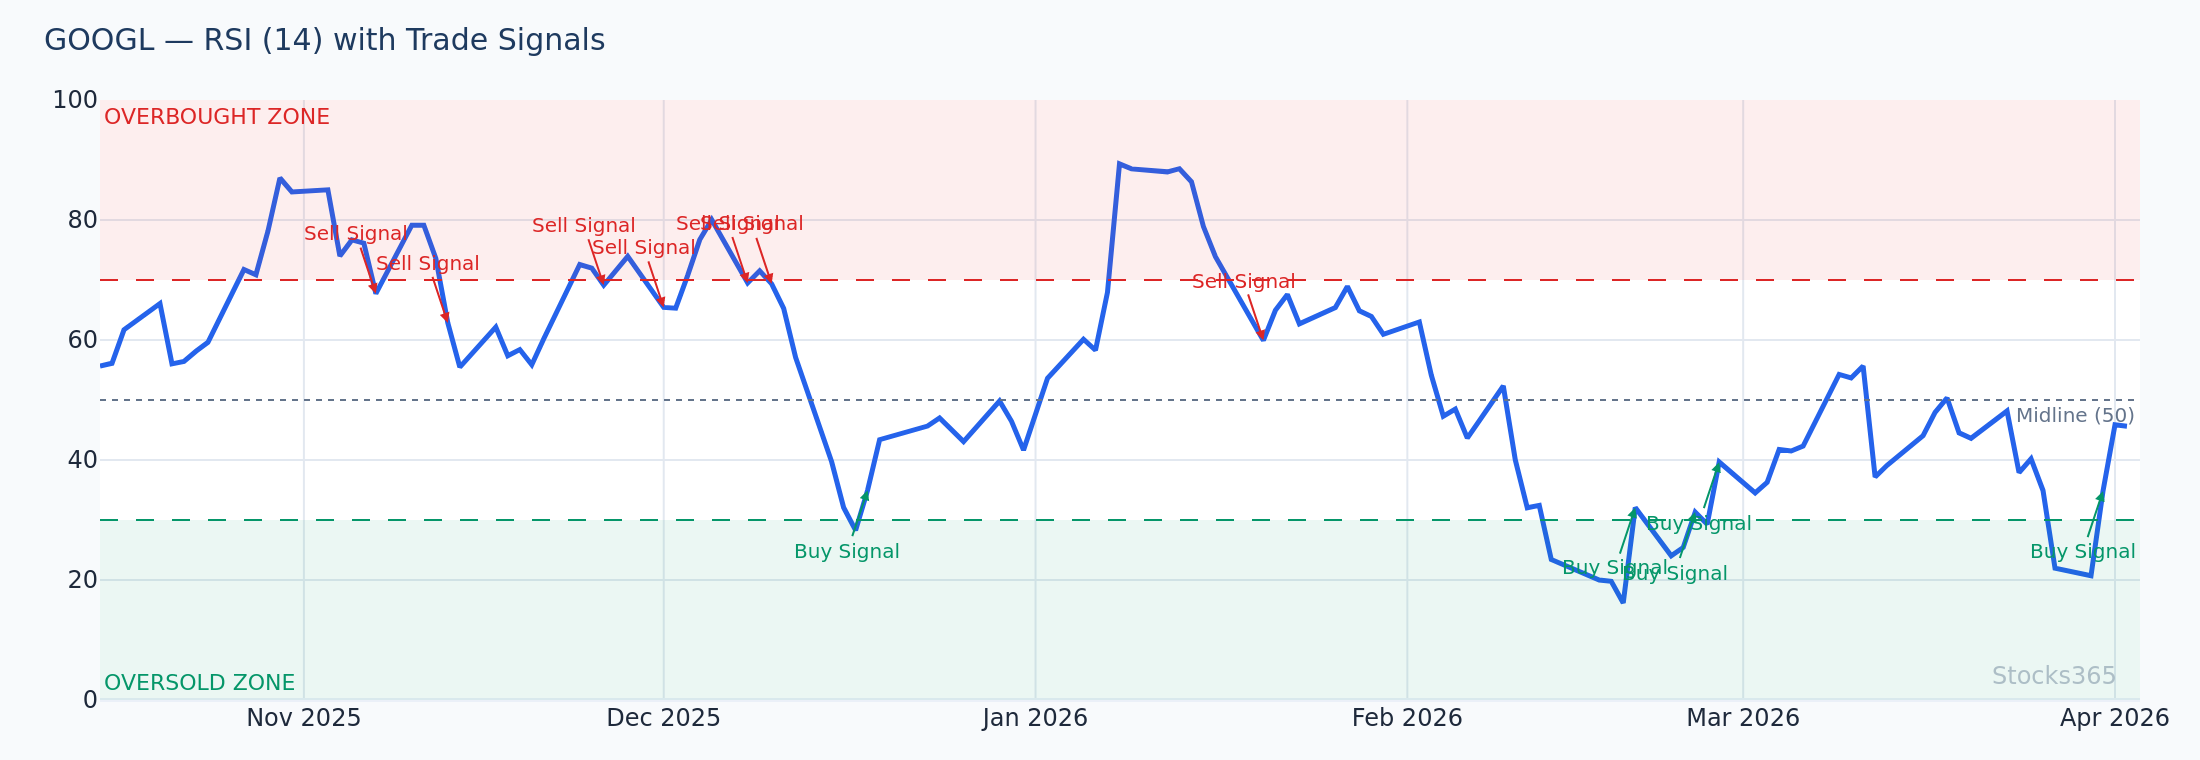
- Weekly chart: RSI is approaching the oversold zone (below 40) on GOOGL at $178, and volume over the past three weeks has been above average. This suggests institutional accumulation on the broader timeframe.
- Daily chart: RSI dips below 30, then crosses back above it on a day with 1.8x average volume. This is your entry signal — the higher timeframe context gives it conviction, and the volume confirms the daily reversal.
- Intraday chart (for active traders): The RSI crosses above 50 in the first hour on volume 2x the typical first-hour average. This is a momentum entry aligned with the daily and weekly bullish setup.
Multi-timeframe RSI volume alignment dramatically reduces false signals and improves the quality of your setups. You can explore optimal RSI period settings for different timeframes in our dedicated guide: RSI Settings: Master the Best Period for Your Strategy.
Volume Divergence From RSI: The Hidden Warning Signal
Beyond classical RSI price divergence, experienced traders also monitor volume-RSI divergence — a scenario where volume and RSI are moving in opposite directions from each other, independent of price.
For instance, if RSI is rising (suggesting improving momentum) but volume on each successive rally day is declining, you have a hidden warning: the momentum appears healthy on the surface, but fewer and fewer participants are powering it. This is a setup that frequently precedes a sharp correction even when price continues to creep higher.
This concept is related to but distinct from the hidden RSI divergence patterns covered in our advanced guide: Hidden RSI Divergence: The Advanced Signal Most Traders Miss. Both signal types reward the trader who looks beyond price alone.
Practical Trade Setup: RSI Volume Analysis in Action
Step-by-Step Entry Checklist
Here is a complete, actionable framework for applying RSI volume analysis to any trade setup:
- Step 1 — Identify the RSI signal: Look for RSI crossing 50 (trend), touching overbought/oversold levels, or forming divergence with price. Use the strategies in our guide on How to Use RSI in Trading: The Ultimate Step-by-Step Guide.
- Step 2 — Check the volume context: Compare current session volume to the 20-day average volume. Flag sessions where volume is above 1.2x average as potentially significant.
- Step 3 — Confirm the signal direction: Is volume expanding in the direction of the RSI signal? High volume on a bullish RSI cross = bullish confirmation. High volume on a bearish RSI rejection = bearish confirmation.
- Step 4 — Check the higher timeframe: Does the weekly or daily RSI context support the signal direction? Align your trade with the dominant trend on the higher timeframe.
- Step 5 — Evaluate the Stocks365 Trust Score: On the Stocks365 signals dashboard, the Trust Score aggregates multiple technical and fundamental factors to validate signal strength. A high Trust Score on a signal that also passes your RSI volume checklist significantly increases your confidence level before entry.
- Step 6 — Set your levels: Define your entry, stop loss (typically below the volume-climax bar's low for longs, or above it for shorts), and target based on the next significant resistance or support level.
Real-World Example: AMZN Bullish Setup
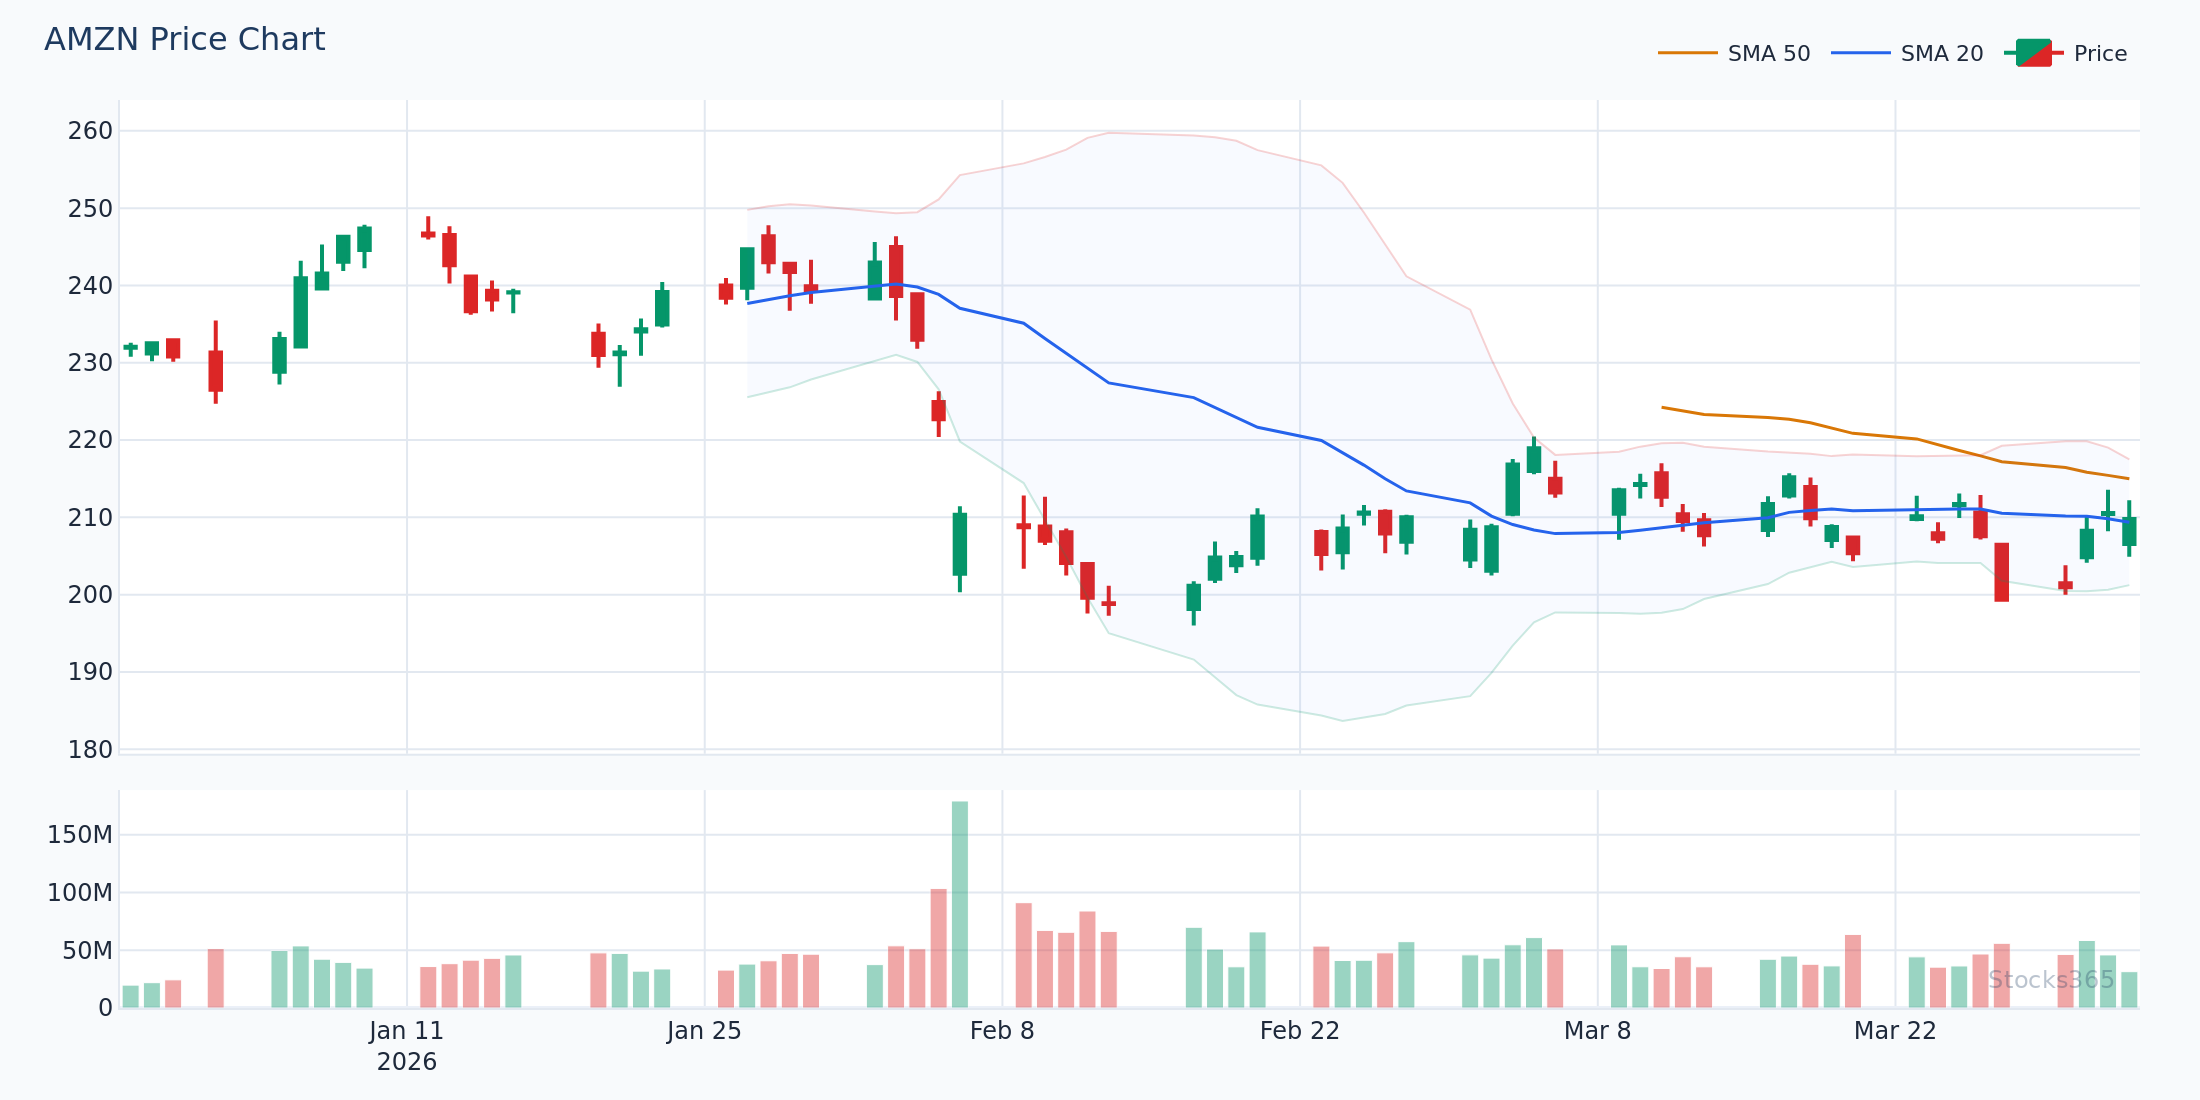
Let's walk through a hypothetical but technically realistic setup on AMZN:
AMZN has been consolidating between $198 and $212. RSI has been hovering between 42 and 55, showing indecision. Then, on a particular session, AMZN surges to $214 — breaking above the consolidation range — on volume of 2.6x the 20-day average. RSI simultaneously breaks above 60 and is heading toward 65.
This is a textbook RSI volume breakout confirmation. The volume expansion into new price territory tells you institutions are participating, not just retail momentum chasers. A breakout on thin volume would be suspect — this is not thin volume. An entry near $214-$215 with a stop below the breakout point (around $211) and a target at the next resistance zone ($228-$232) represents a favorable risk-reward setup backed by both indicators working in harmony.
You can track live signals for stocks like AMZN directly on Stocks365 — for example, see AAPL's signal page at /signal/AAPL for a template of how individual stock signals are analyzed and presented.
Common Mistakes in RSI Volume Analysis
Chasing Volume Without RSI Context
High volume alone is not a buy or sell signal. A stock can experience enormous volume on earnings announcements, news events, or index rebalancing — none of which necessarily indicate a sustainable directional move. RSI provides the momentum context that tells you whether the volume is pushing a trend forward or exhausting it.
Ignoring Volume on RSI Divergence
RSI divergence without volume confirmation fails more often than it succeeds, particularly in strong trending markets. Many traders have been burned going against a trend based solely on RSI divergence, only to watch the trend continue. Volume confirmation — specifically declining volume on the price extension and expanding volume on the reversal — is the filter that separates high-probability divergence plays from premature counter-trend bets.
Using RSI in Isolation on Low-Liquidity Assets
RSI can be heavily distorted on low-liquidity assets where individual large trades can move the price significantly. In these cases, volume analysis is even more critical — but so is understanding that volume data itself may be sparse or unreliable. Stick to liquid assets (large-cap stocks, major ETFs, highly traded futures) where both RSI and volume data are robust and representative of genuine market sentiment. For comparison with another momentum tool you might use alongside RSI, see our RSI vs Stochastic Oscillator: The Essential Guide.
Key Takeaways: RSI Volume Analysis
- RSI signals backed by above-average volume are significantly more reliable than those occurring on thin, low-participation days.
- RSI divergence + volume confirmation (declining volume on extensions, expanding volume on reversals) is one of the most powerful reversal setups available to technical traders.
- Volume climax events (3x+ average volume) at RSI extremes often mark exhaustion and potential trend reversals.
- Multi-timeframe alignment — confirming RSI volume signals on higher timeframes before entering on lower timeframes — dramatically improves signal quality.
- Volume-RSI divergence (RSI rising while volume declines) is a hidden warning signal that a move may be running out of steam.
- The Stocks365 Trust Score integrates multi-indicator analysis including volume and momentum factors, helping you quickly assess signal quality without manual calculation.
- Always combine RSI volume analysis with clear entry/stop/target levels for disciplined trade management.
Frequently Asked Questions
How do I combine RSI and volume for day trading?
For day trading, focus on intraday volume relative to the typical volume for that time of day (time-of-day normalized volume). When RSI crosses a key level (30, 50, or 70) during a high-volume period — such as the market open or midday surge — the signal carries more weight. Avoid acting on RSI signals during the midday lull when volume is naturally thin and RSI movements may be misleading.
What is the best volume indicator to use with RSI?
Several volume indicators pair well with RSI. Volume bars with a 20-day moving average overlay is the simplest and most widely used. On-Balance Volume (OBV) is excellent for confirming RSI trends over time. Volume-Weighted Average Price (VWAP) is particularly useful for intraday RSI volume analysis. Each adds a slightly different dimension, so choose based on your trading style and timeframe.
Can RSI volume analysis work in cryptocurrency markets?
Yes, with caveats. Cryptocurrency markets operate 24/7, so volume analysis requires careful normalization — comparing current volume to the same time-of-day or day-of-week average rather than a simple rolling average. RSI volume analysis is highly applicable to Bitcoin, Ethereum, and major altcoins, but be aware that volume data quality varies by exchange. Using aggregated volume across multiple exchanges provides the most reliable data.
How do I identify a volume climax with RSI?
A volume climax is typically identified when volume reaches 3x or more above the 20-day average volume, coinciding with an RSI reading below 25 (selling climax) or above 75 (buying climax). The climax bar often features a long wick or reversal candle pattern (hammer, shooting star, or engulfing). RSI beginning to curl back toward 50 in the sessions immediately following the climax is a secondary confirmation signal.
Does RSI volume analysis work in all market conditions?
RSI volume analysis performs best in trending and transitioning markets where momentum shifts are meaningful. In extremely choppy, low-volatility environments, both RSI and volume signals can generate false positives. During significant macroeconomic events or earnings releases, volume spikes may not carry their typical technical meaning and should be treated with caution. Adapting your RSI period settings for different market regimes — as covered in our RSI Settings guide — can help mitigate this challenge.