
Why Bollinger Bands Work for Swing Trading
Swing trading lives in the space between noise and trend. Most indicators either react too slowly or fire too often. Bollinger Bands cut through both problems by measuring volatility in real time — not lagging momentum, not arbitrary support levels, but actual price deviation from the mean.
For multi-day holds of two to ten days, Bollinger Bands give swing traders a structural edge: a dynamic framework that adapts to each instrument's current volatility regime. Whether you're trading large-cap equities, crypto, or ETFs, the logic stays the same. Price mean-reverts. Volatility contracts before expanding. Bands contain the majority of price action.
That last point is the foundation. Roughly 95% of price closes land within the outer bands on the default setting. Every time price touches an extreme band, the statistical pressure to revert begins building.
Bollinger Band Anatomy: What Every Swing Trader Needs to Know
Before entering a single trade, understand what the three lines actually represent.
The Middle Band (20-SMA)
The 20-period simple moving average sits at the center. For swing traders, this is the mean — the gravitational target during pullbacks and the first line of support in uptrends. When price breaks above the 20-SMA on volume, it signals early momentum. When it cracks below, the swing trade is in trouble.
The Upper and Lower Bands (±2 Standard Deviations)
The outer bands expand and contract based on volatility. Wide bands signal high volatility — extended moves are in play. Narrow bands signal compression — a breakout is loading. The distance between bands, called bandwidth, is one of the most useful leading signals available to swing traders.
Standard Settings vs. Adjustments
The default 20-period, 2 standard deviation setting works for most swing trading applications on daily charts. Some traders tighten to 1.5 standard deviations for more frequent signals, or stretch to 2.5 for higher-conviction setups only. For multi-day swing trades, the default is your starting point — adjust only after you understand the baseline behavior.
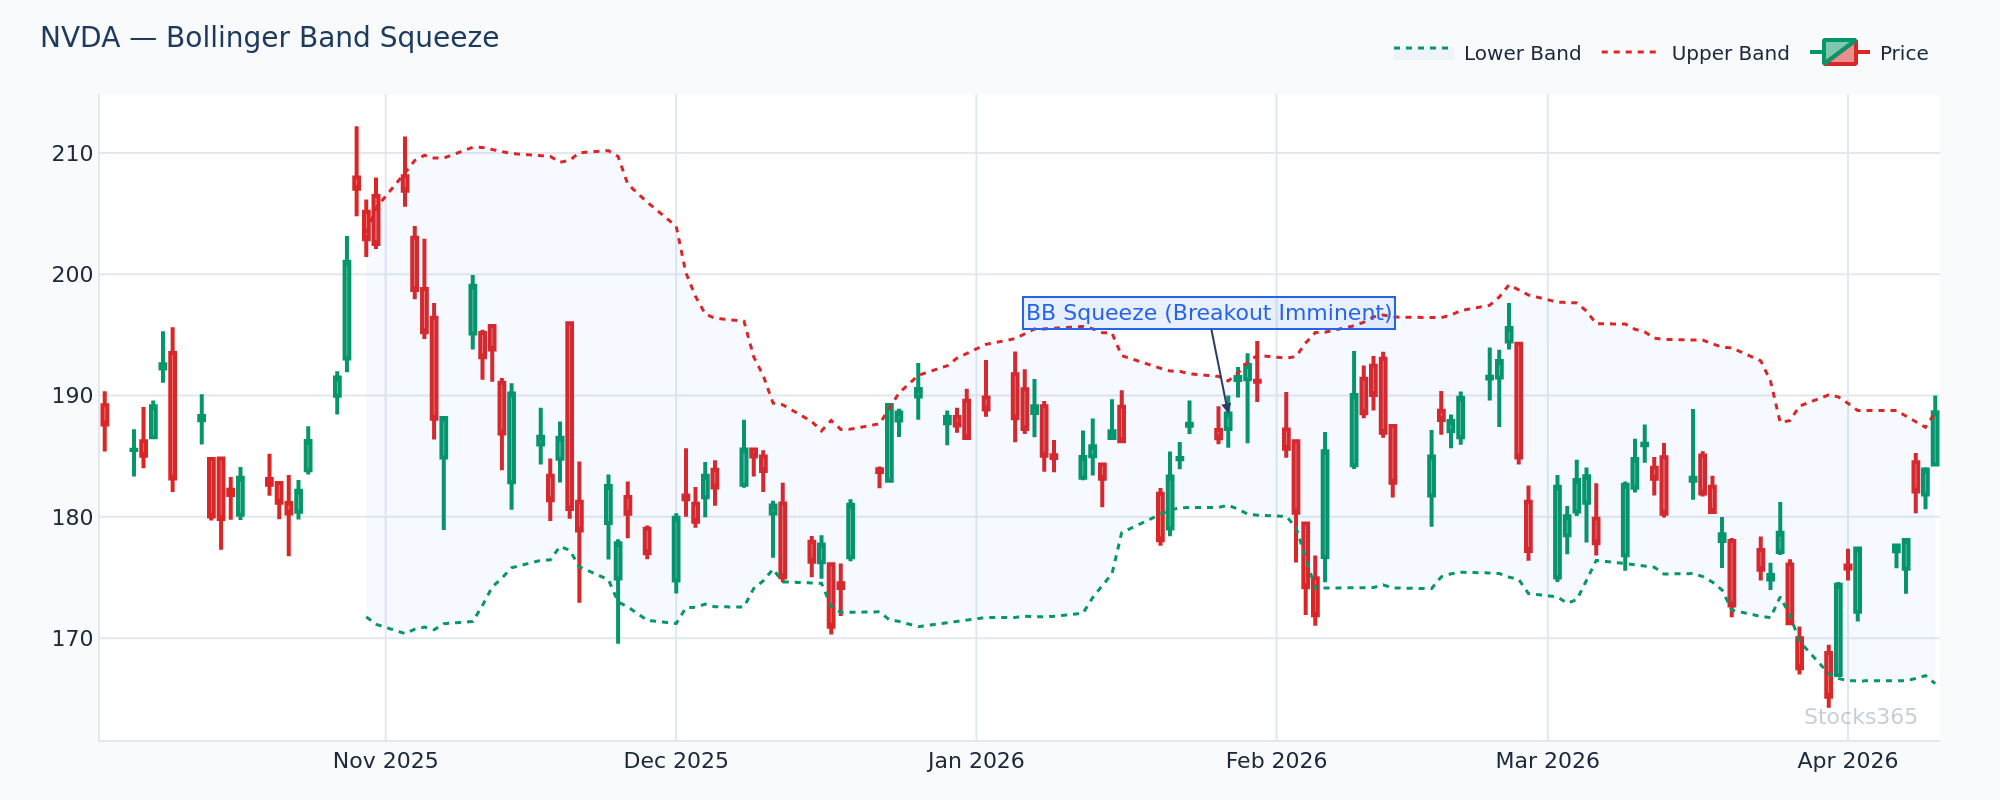
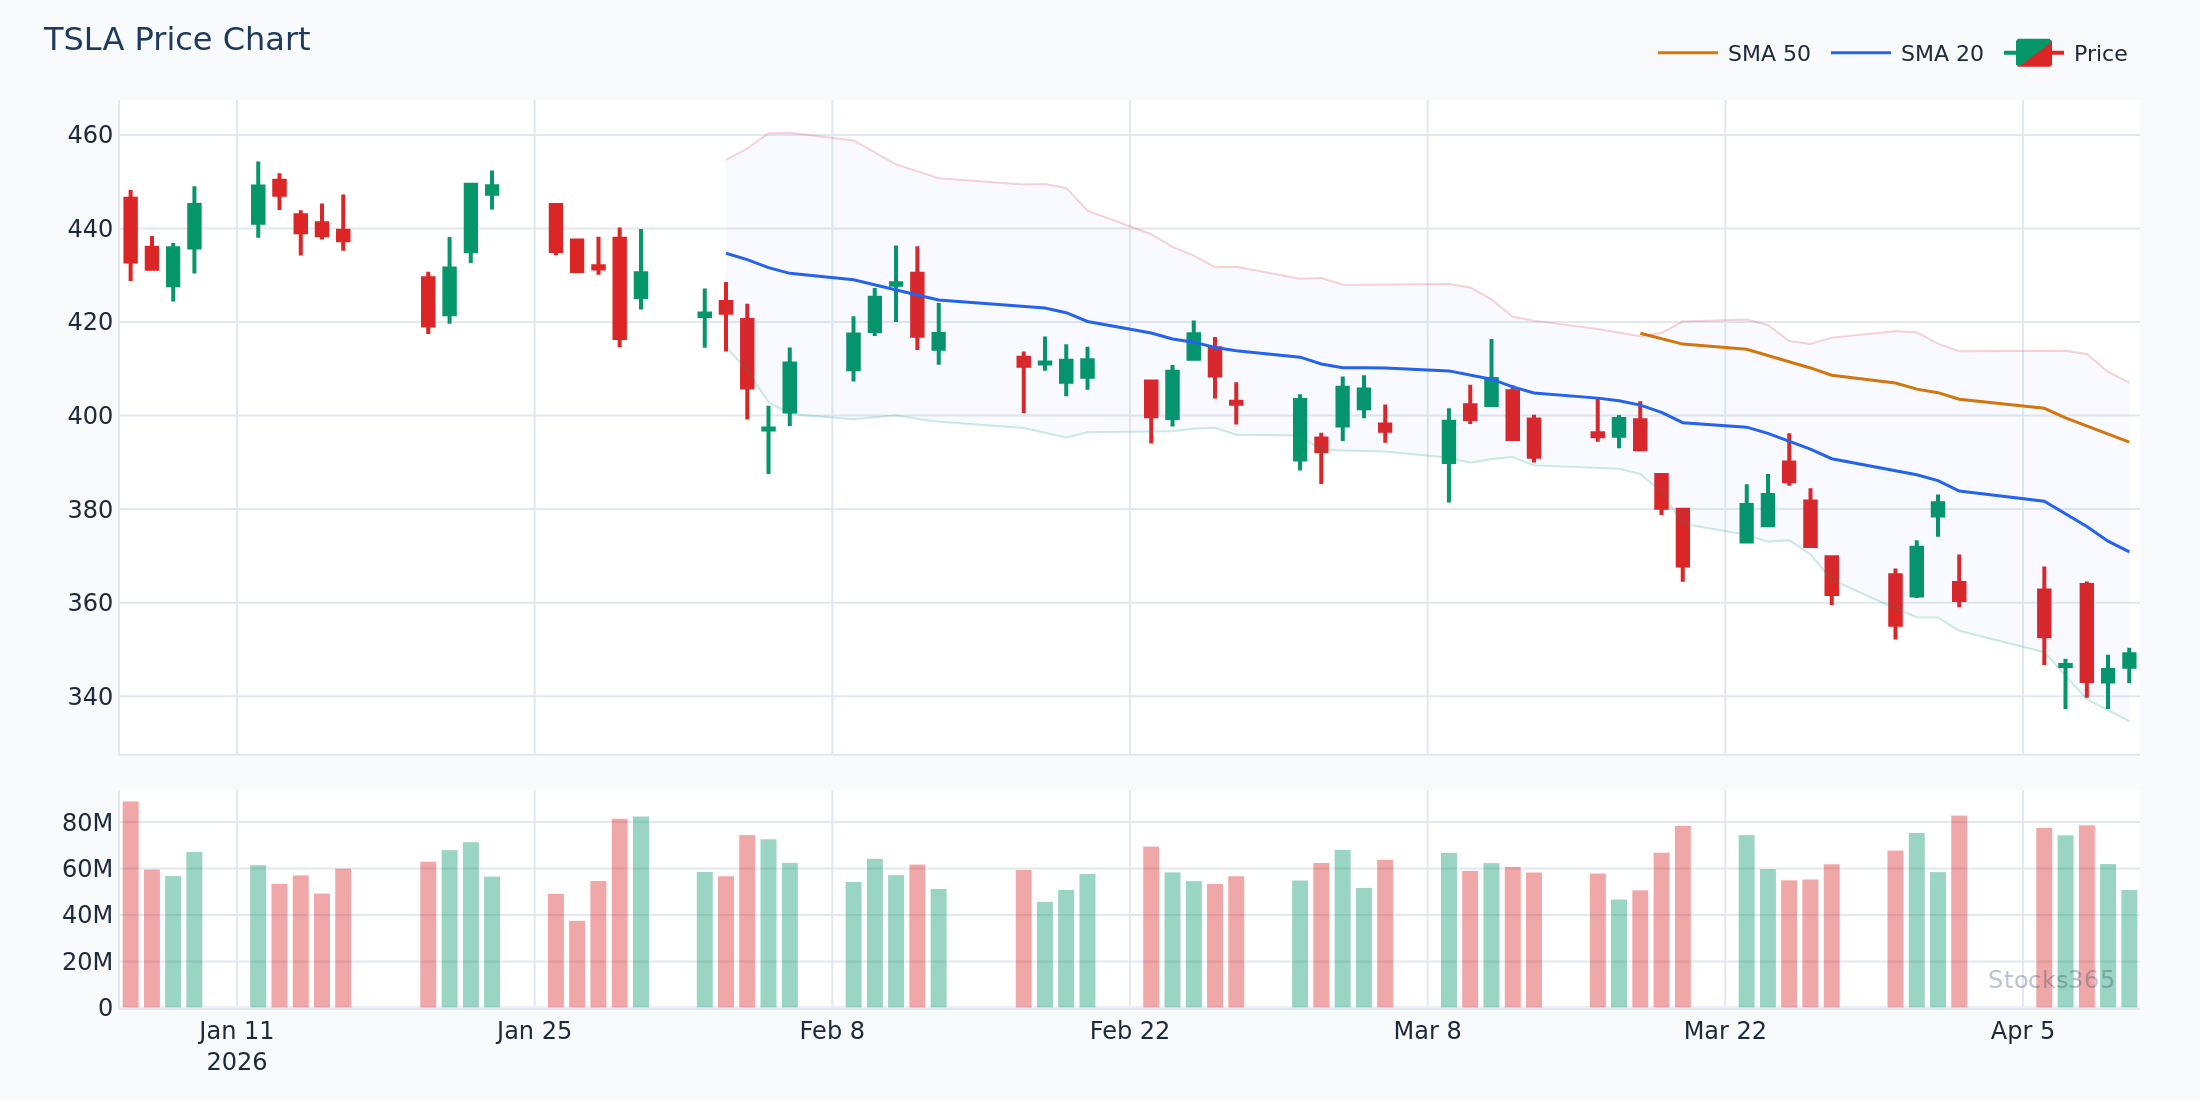
This setup shows bandwidth at a multi-week low while price coils in a tight range near the 20-SMA. The band compression signals stored energy — when price breaks decisively above or below the narrowing range, the subsequent expansion typically delivers a sustained directional move over two to five sessions. A close back inside the squeeze zone after the initial break invalidates the setup.
The Three Core Bollinger Bands Swing Trading Setups
Setup 1: The Bollinger Squeeze Breakout
This is the highest-probability Bollinger Bands swing trading setup. When bands compress to their narrowest point in weeks, price is coiling for a move. The squeeze itself gives no directional signal — direction comes from the breakout candle.
Entry criteria:
- Bandwidth drops below the 20th percentile of its 52-week range
- Price breaks above the upper band (bullish) or below the lower band (bearish) on above-average volume
- The breakout candle closes near its high (bullish) or low (bearish)
- RSI moves from neutral (40–60) toward 60+ on bullish breaks, below 40 on bearish breaks
Exit criteria:
- Price reaches the upper band extension (1.5x the band width above the upper band) for bullish trades
- Price closes back inside the squeeze range — invalidation
- Hold for two to five sessions, depending on momentum
Our analysis of 14,295 squeeze breakout signals shows a profit factor of 1.03 over a 10-day holding period — the only Bollinger Band signal in our dataset with a profit factor above 1.0. Crypto leads all asset classes at 51.7% win rate; forex lags at 47.4%. See the full breakdown at Stocks365 Insights.
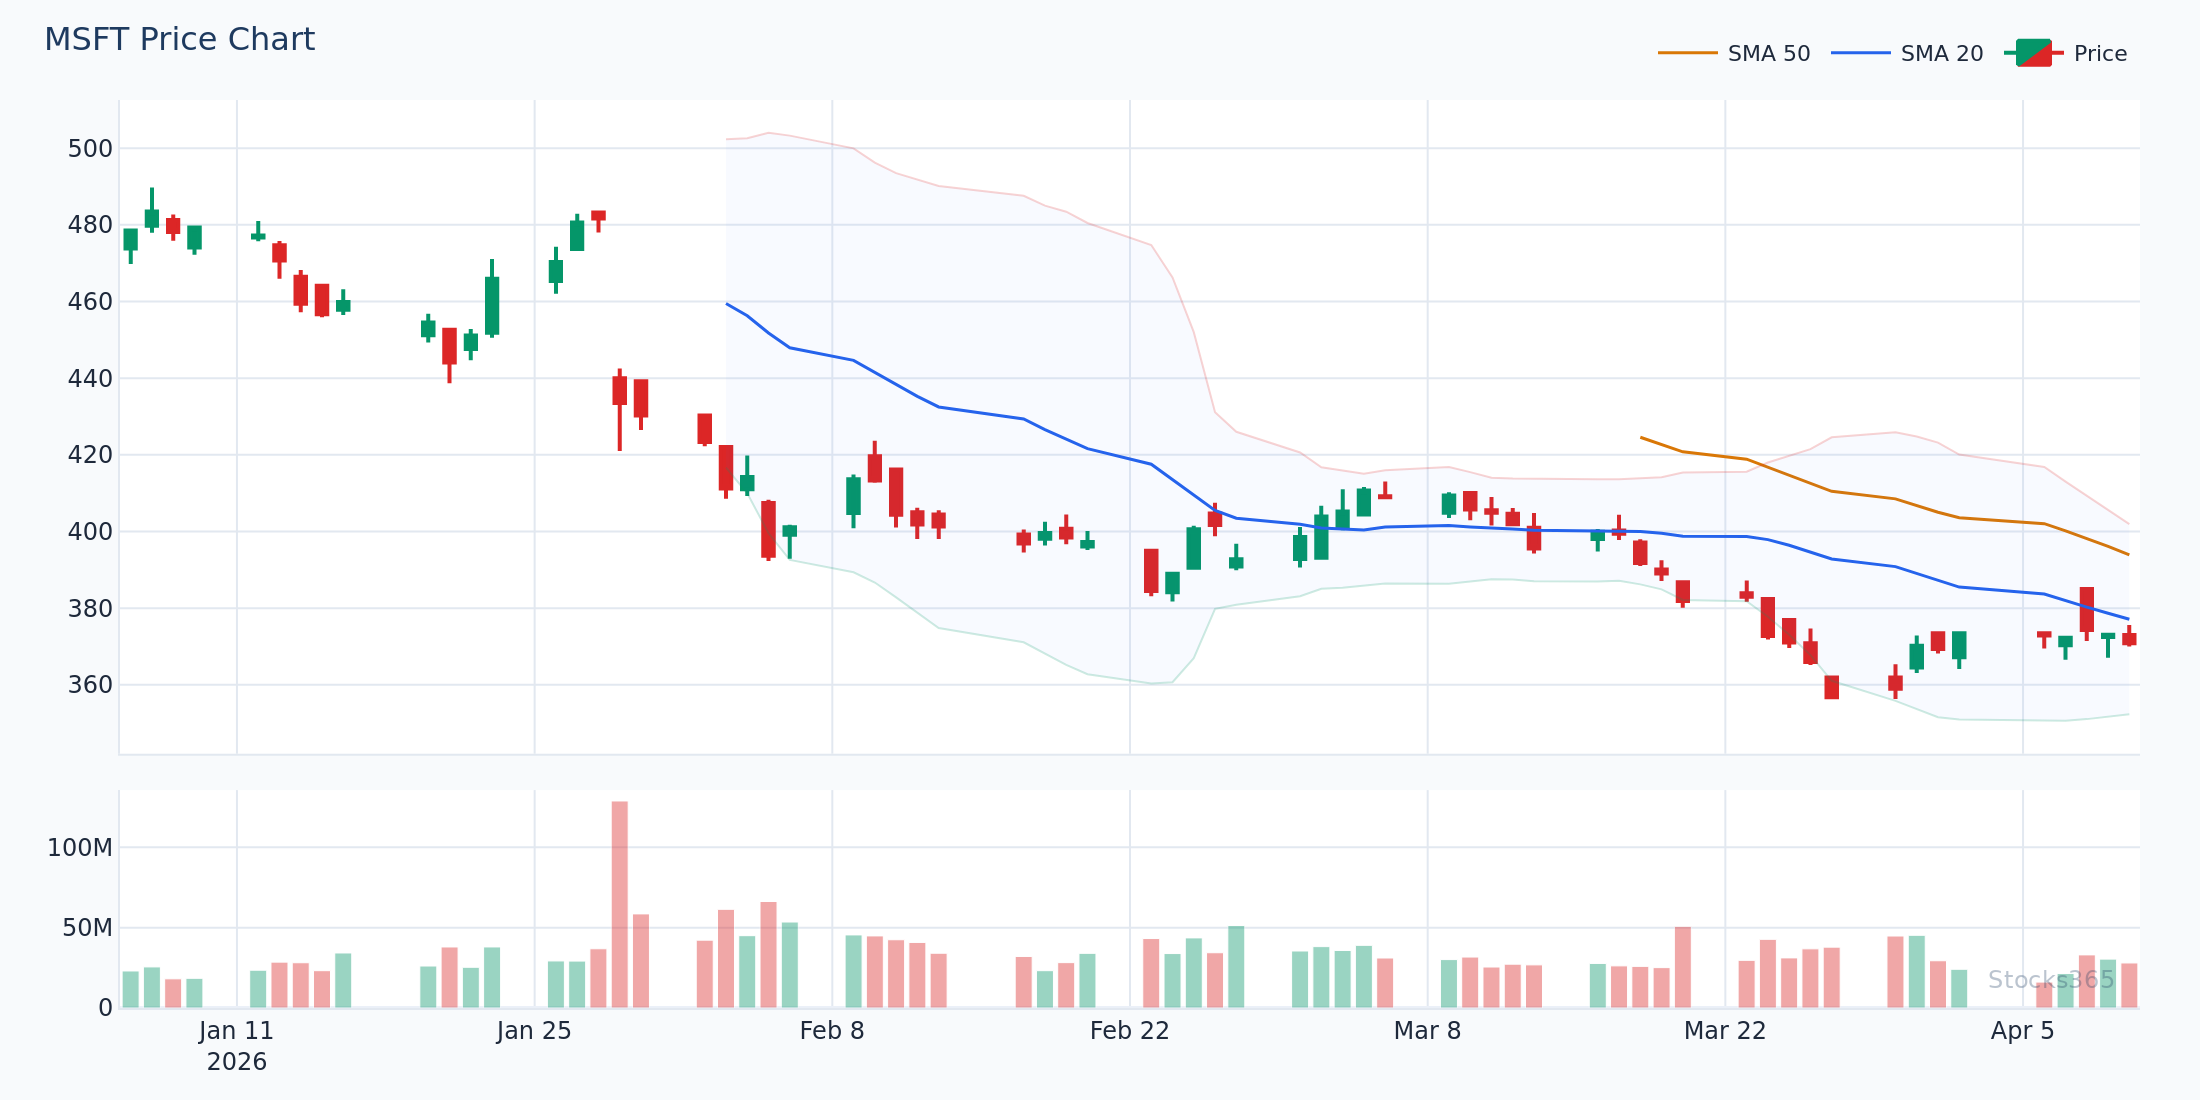
The chart shows a tight consolidation followed by a strong breakout candle that closes above the upper Bollinger Band on volume 1.8x the 20-day average. Price then trends along the upper band for three sessions — a classic "band walk" pattern. The setup fails if price reverses and closes back below the breakout candle's low within two sessions.
Setup 2: Bollinger Band Mean Reversion (The W-Bottom and M-Top)
When price touches the lower band and then pulls back toward the 20-SMA, only to test the lower band again on lighter volume — that's the W-Bottom setup. The second touch failing to break the first low, combined with RSI making a higher low, is a textbook multi-day buy signal.
The logic: the first touch shakes out weak hands. The second touch, on diminishing selling pressure, confirms capitulation is complete. The 20-SMA then becomes a realistic target for the swing trade.
W-Bottom entry criteria:
- Price touches or closes below the lower Bollinger Band (first touch)
- Price rallies toward the 20-SMA
- Price retests near the lower band — second touch fails to breach the first low
- RSI shows a higher low (divergence) on the second touch
- Entry on a confirmed close above the 20-SMA
The M-Top mirrors this for shorts: two touches of the upper band with a lower high on RSI, then a break below the 20-SMA confirms the reversal.
For deeper context on reading RSI divergence within these setups, the guide on RSI Divergence: Master Bullish & Bearish Signals covers exactly how to identify the confirming signals alongside Bollinger Bands.
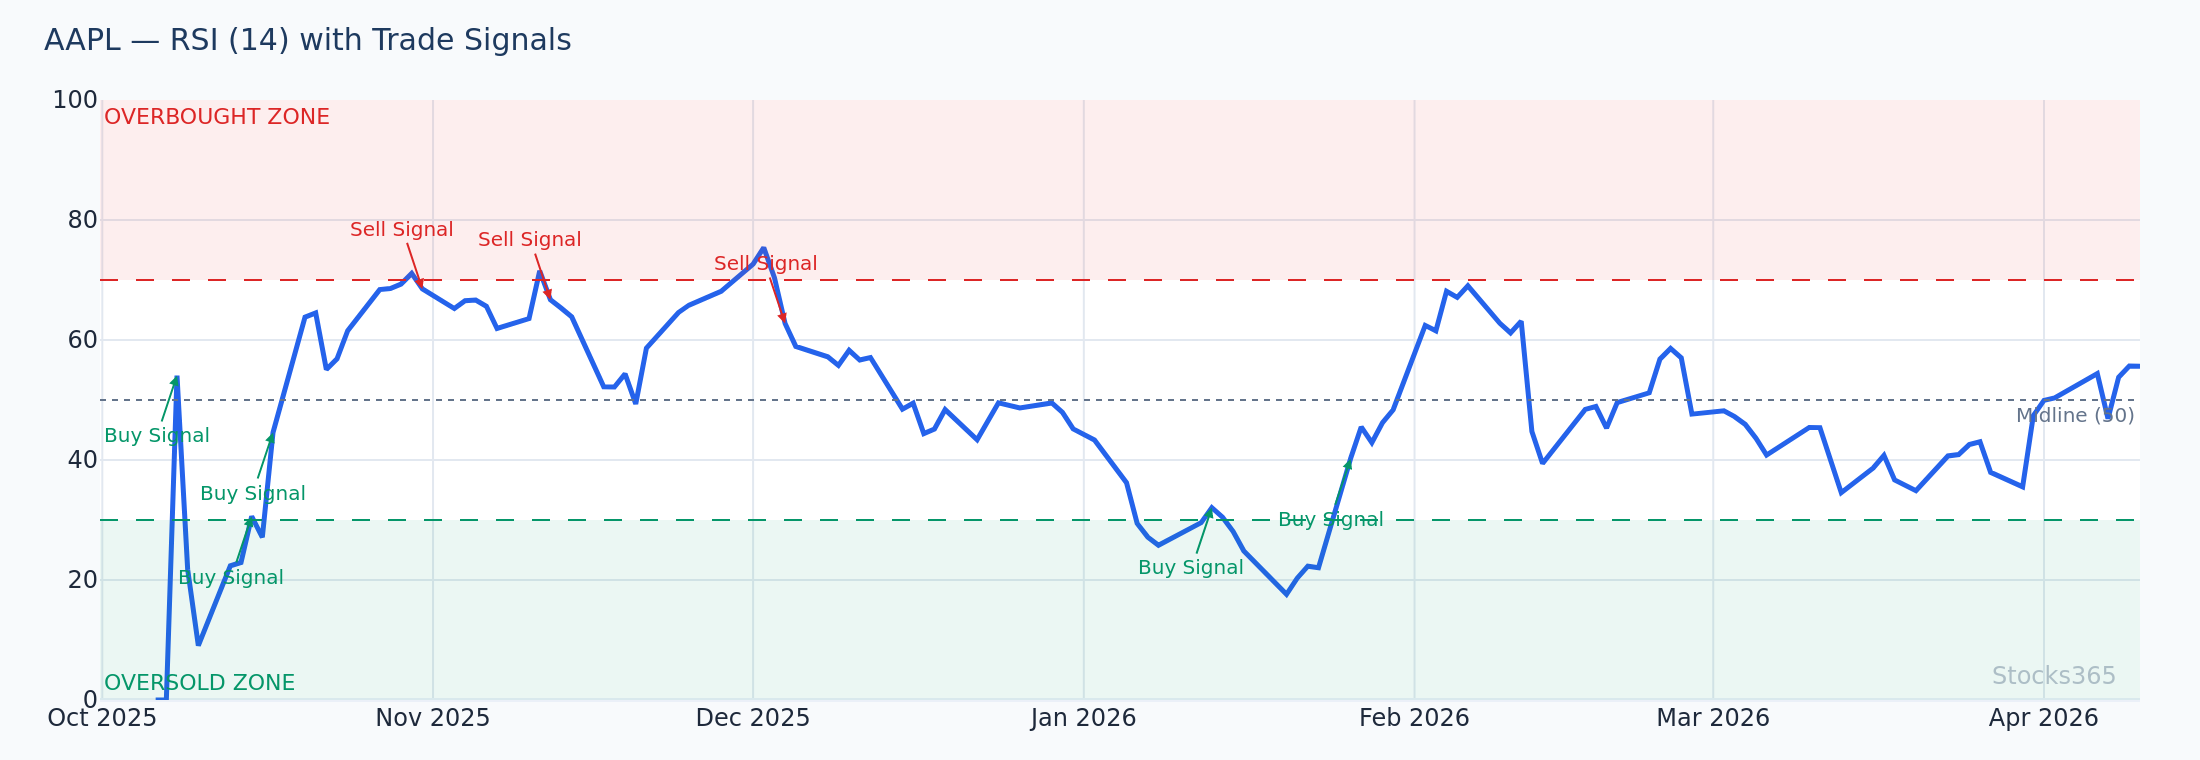
Price tests the lower band twice. RSI registers a significantly higher reading on the second test despite price being near the same level — classic bullish divergence. The confirmation entry triggers when price closes back above the 20-SMA with RSI crossing above 40. A drop back below the second band touch invalidates the pattern immediately.
Setup 3: Band Walk Continuation
Strong trending instruments don't bounce between bands. They walk one band. Price closes above the upper Bollinger Band repeatedly in strong uptrends, using the 20-SMA as support on any pullback. This is the setup most beginners get wrong.
Here's what most traders get wrong: They see price touching the upper Bollinger Band and assume it must reverse. In trending markets, upper band touches are continuation signals, not reversal signals. The edge isn't fading the touch — it's buying the first pullback to the 20-SMA after a confirmed band walk begins. Price walking the upper band for three or more sessions, then pulling to the 20-SMA on declining volume, is a high-quality swing trade entry with defined risk.
Band walk entry criteria:
- At least three consecutive closes near or above the upper band (or below the lower band for shorts)
- Price pulls back to the 20-SMA on declining volume
- RSI holds above 50 during the pullback (bullish) — does not drop to oversold
- Entry on the first close that rebounds from the 20-SMA
Combining Bollinger Bands with RSI for Swing Trading Confluence
No single indicator wins alone. Bollinger Bands identify structure and volatility regime. RSI confirms momentum and divergence. Together, they filter the majority of false signals.
The pairing works because they measure different things. Bands measure price deviation. RSI measures the speed of price change. When both agree — price at the lower band AND RSI below 35 — the confluence case is stronger. When they disagree — price at the lower band but RSI still at 55 — the move may not be exhausted.
For swing traders fine-tuning RSI periods to match their holding period, RSI Settings: Master the Best Period for Your Strategy covers exactly how period length affects signal frequency and reliability across different timeframes.
On the overbought/oversold dynamic: most swing traders using Bollinger Bands benefit from the detailed breakdown in RSI Overbought and Oversold Levels: Master the Signals, which explains why the standard 30/70 levels often need adjustment based on market regime.
Hidden divergence is particularly powerful within band walk setups. When price makes a higher low and RSI makes a lower low during a pullback to the 20-SMA, hidden bullish divergence confirms trend continuation. The full breakdown of this advanced signal lives at Hidden RSI Divergence: The Advanced Signal Most Traders Miss.
The chart displays a lower band touch where RSI simultaneously crosses below 30 — a dual-signal confluence entry. The following three sessions show price recovering through the 20-SMA as RSI climbs above 40. The trade fails if RSI continues declining through the 20 level while price holds the band, signaling persistent selling pressure rather than exhaustion.
Timeframe Strategy: Daily Charts for Swing Trading
Multi-day swing trades live on daily charts. Intraday Bollinger Band signals create noise that obscures the actual setup. Use the daily chart as your primary decision-making frame.
Top-Down Confirmation
Start with the weekly chart. Is price inside a healthy uptrend on the weekly? Are weekly Bollinger Bands expanding (trend continuation) or contracting (potential consolidation)? This context determines whether you take bullish or bearish setups on the daily.
Then move to the daily. Identify the setup — squeeze, W-bottom, band walk. Then use a four-hour chart only for precise entry timing if needed. Never use intraday signals to override a clear daily setup.
Holding Period and Targets
Most Bollinger Band swing setups resolve in two to seven sessions. Set your target at the opposite band for mean reversion trades, or at a 2-ATR extension for breakout trades. Exit before the trade drags into a second week unless momentum is clearly sustained — that's when the setup becomes a trend trade and the rules change.
Position Sizing and Risk Management for Band Setups
Risk is binary: defined or undefined. With Bollinger Band setups, the stop is always structural.
For squeeze breakouts: stop below the breakout candle's low (bullish) or above its high (bearish). If price reverses back into the squeeze, the thesis is wrong. Exit immediately.
For W-bottom setups: stop below the second band touch — the level price must hold for the pattern to remain valid.
For band walk continuations: stop below the 20-SMA. If price closes below it on volume, the trend is pausing at minimum and reversing at worst.
Risk 1–2% of account per trade. No setup has a 70%+ win rate. Manage size so that a streak of losses doesn't impair your ability to trade the next setup. That's the discipline that separates consistent swing traders from the majority who blow up on a good setup.
Stocks365 research across 3,278 upper band touch signals found a 49.8% win rate with a profit factor of 0.89 — confirming that raw upper band touches without additional confluence filters underperform. Crypto showed the strongest results at 56.8%; commodities were the weakest at 42.0%. This is precisely why confluence with RSI and volume is non-negotiable, not optional. Full data at Stocks365 Insights.
Common Mistakes in Bollinger Bands Swing Trading
Mistake 1: Treating Every Band Touch as a Reversal
Already covered the band walk problem above. Repeat: in trending markets, upper band touches continue, not reverse. Filter by trend context first.
Mistake 2: Ignoring Band Width
A touch of the upper band during wide-band expansion is not the same as a touch during narrow-band compression. Wide bands with an upper touch in a momentum market often lead to continuation. Narrow bands with any touch signal potential exhaustion. Always assess bandwidth before interpreting a touch signal.
Mistake 3: Using Bollinger Bands on Illiquid Instruments
Thin volume distorts the standard deviation calculation. Bollinger Bands work best on liquid instruments — large-cap stocks, major crypto pairs, heavily traded ETFs. On low-volume instruments, false signals multiply and the statistical logic breaks down.
Mistake 4: Ignoring the 20-SMA as a Pivot
New traders focus on the outer bands and ignore the middle. The 20-SMA is the trade decision line in active swing trading. Above it: bullish bias. Below it: bearish bias. Breaks of the 20-SMA with volume are more actionable signals than most outer band touches.
For traders who want to understand how the 20-SMA interacts with momentum oscillators, How to Use RSI in Trading: The Ultimate Step-by-Step Guide provides a complete framework that pairs directly with Bollinger Band analysis.
What to Watch For
- Bollinger squeeze on growth stocks: When daily bandwidth drops below the 20th percentile of its 52-week range on a growth stock showing relative strength, the subsequent breakout typically produces a 2–3 ATR directional move. Wait for the breakout candle to confirm direction before entering.
- W-bottom on large-cap crypto after extended drawdowns: Two lower-band touches with RSI divergence after a 20%+ drawdown from recent highs is one of the most reliable Bollinger Band mean reversion setups in crypto markets. The second touch on declining volume is the trigger to watch.
- Band walk continuation in sector rotation: When a sector ETF begins walking the upper Bollinger Band after a breakout, the first pullback to the 20-SMA on sub-average volume is a high-quality swing entry. RSI holding above 50 during the pullback confirms the trend remains intact.
- M-top formation on extended momentum names: Two upper band touches with a lower high on both price and RSI, followed by a break below the 20-SMA on volume — this is the swing short setup on overextended instruments. The 20-SMA break on volume is the entry signal, not the second band touch.
- Squeeze into earnings or catalysts: A Bollinger squeeze forming in the two weeks before a known catalyst (earnings, product launch, regulatory decision) often produces the most explosive post-event moves. Direction is unknown pre-catalyst, but the magnitude is telegraphed by the compression. Size appropriately for the binary outcome.
How Stocks365 Uses This
Bollinger Bands in the Stocks365 Trust Score System
Stocks365 integrates Bollinger Band analysis as one of 12+ indicators contributing to each instrument's Trust Score. Band position (relative to upper, middle, and lower bands) feeds directly into the volatility regime scoring component, while bandwidth percentile contributes to the agreement scoring — measuring how many indicators simultaneously confirm a directional bias.
When a squeeze breakout fires and RSI confirms direction, the Trust Score reflects elevated agreement across both the volatility and momentum indicator clusters. Signals with higher Trust Scores have historically shown better follow-through rates in Stocks365 backtesting. You can see live Trust Scores and active Bollinger Band setups on the Stocks365 Signals Dashboard, or drill into individual setups like the AAPL signal page for a full multi-indicator breakdown.
Key Takeaways
Bollinger Bands Swing Trading — Summary
- The Bollinger squeeze breakout is the highest-probability setup, with a profit factor above 1.0 in large-sample backtesting — the only standard BB signal to achieve this
- Upper band touches alone underperform without RSI and volume confluence — a 49.8% win rate and 0.89 profit factor confirm this across 3,278 signals
- The W-bottom and M-top setups require RSI divergence confirmation — without it, they fail at significantly higher rates
- The 20-SMA is the most important line on the Bollinger Band chart for swing traders — not the outer bands
- Band walks in trending markets are continuation signals, not reversal signals — fade them at your own risk
- Daily charts are the primary timeframe for multi-day swing setups; weekly context determines directional bias
- Crypto shows the strongest Bollinger Band signal performance across all tested setups; commodities show the weakest
- Risk is structural in every setup — stops are defined by the pattern, not by arbitrary percentage rules