
Why Bollinger Bands with MACD Is One of the Most Reliable Combo Strategies
Most indicators lie alone. Together, they tell the truth.
Bollinger Bands measure volatility and price position. MACD measures momentum and trend direction. When both agree, you get something rare in trading — confluence. That confluence is where high-probability setups live.
This guide breaks down exactly how to combine Bollinger Bands with MACD, what patterns to look for, and how to filter out the false signals that destroy accounts. Whether you trade stocks, crypto, or commodities, this strategy applies across markets and timeframes.
Understanding the Two Indicators Before Combining Them
What Bollinger Bands Actually Measure
Bollinger Bands consist of three lines: a 20-period simple moving average in the middle, and two bands plotted two standard deviations above and below it. The bands expand when volatility increases and contract when the market quiets down. That contraction — called a Bollinger squeeze — is one of the most reliable precursors to a major price move.
Price touching the upper band doesn't automatically mean sell. Price touching the lower band doesn't automatically mean buy. The bands define relative extremes, not absolute ones. Context matters enormously.
What MACD Actually Measures
MACD (Moving Average Convergence Divergence) tracks the relationship between two exponential moving averages — typically the 12-period and 26-period EMAs. The MACD line is the difference between them. The signal line is a 9-period EMA of the MACD line. The histogram shows the gap between the two.
MACD excels at identifying trend direction and momentum shifts. A bullish crossover — where the MACD line crosses above the signal line — suggests building upward momentum. A bearish crossover signals the opposite. Histogram bars shrinking toward zero often warn of a trend losing steam before price confirms it.
If you want a deeper foundation on momentum indicators before combining them, the RSI vs Stochastic Oscillator: The Essential Guide covers how momentum tools differ in their construction and best use cases.
The Core Logic: Why These Two Indicators Complement Each Other
Bollinger Bands answer: Where is price relative to recent history? MACD answers: Which direction is momentum pushing? Used alone, each has a blind spot. Bollinger Bands don't tell you if a band touch is a reversal or a continuation. MACD crossovers produce false signals in choppy, range-bound markets.
Combined, they cancel out each other's weaknesses. A MACD bullish crossover near the lower Bollinger Band is a very different signal from a MACD bullish crossover in the middle of the bands. The former suggests oversold conditions with recovering momentum. The latter is noise.
That's the power of the combo. Precision over frequency.
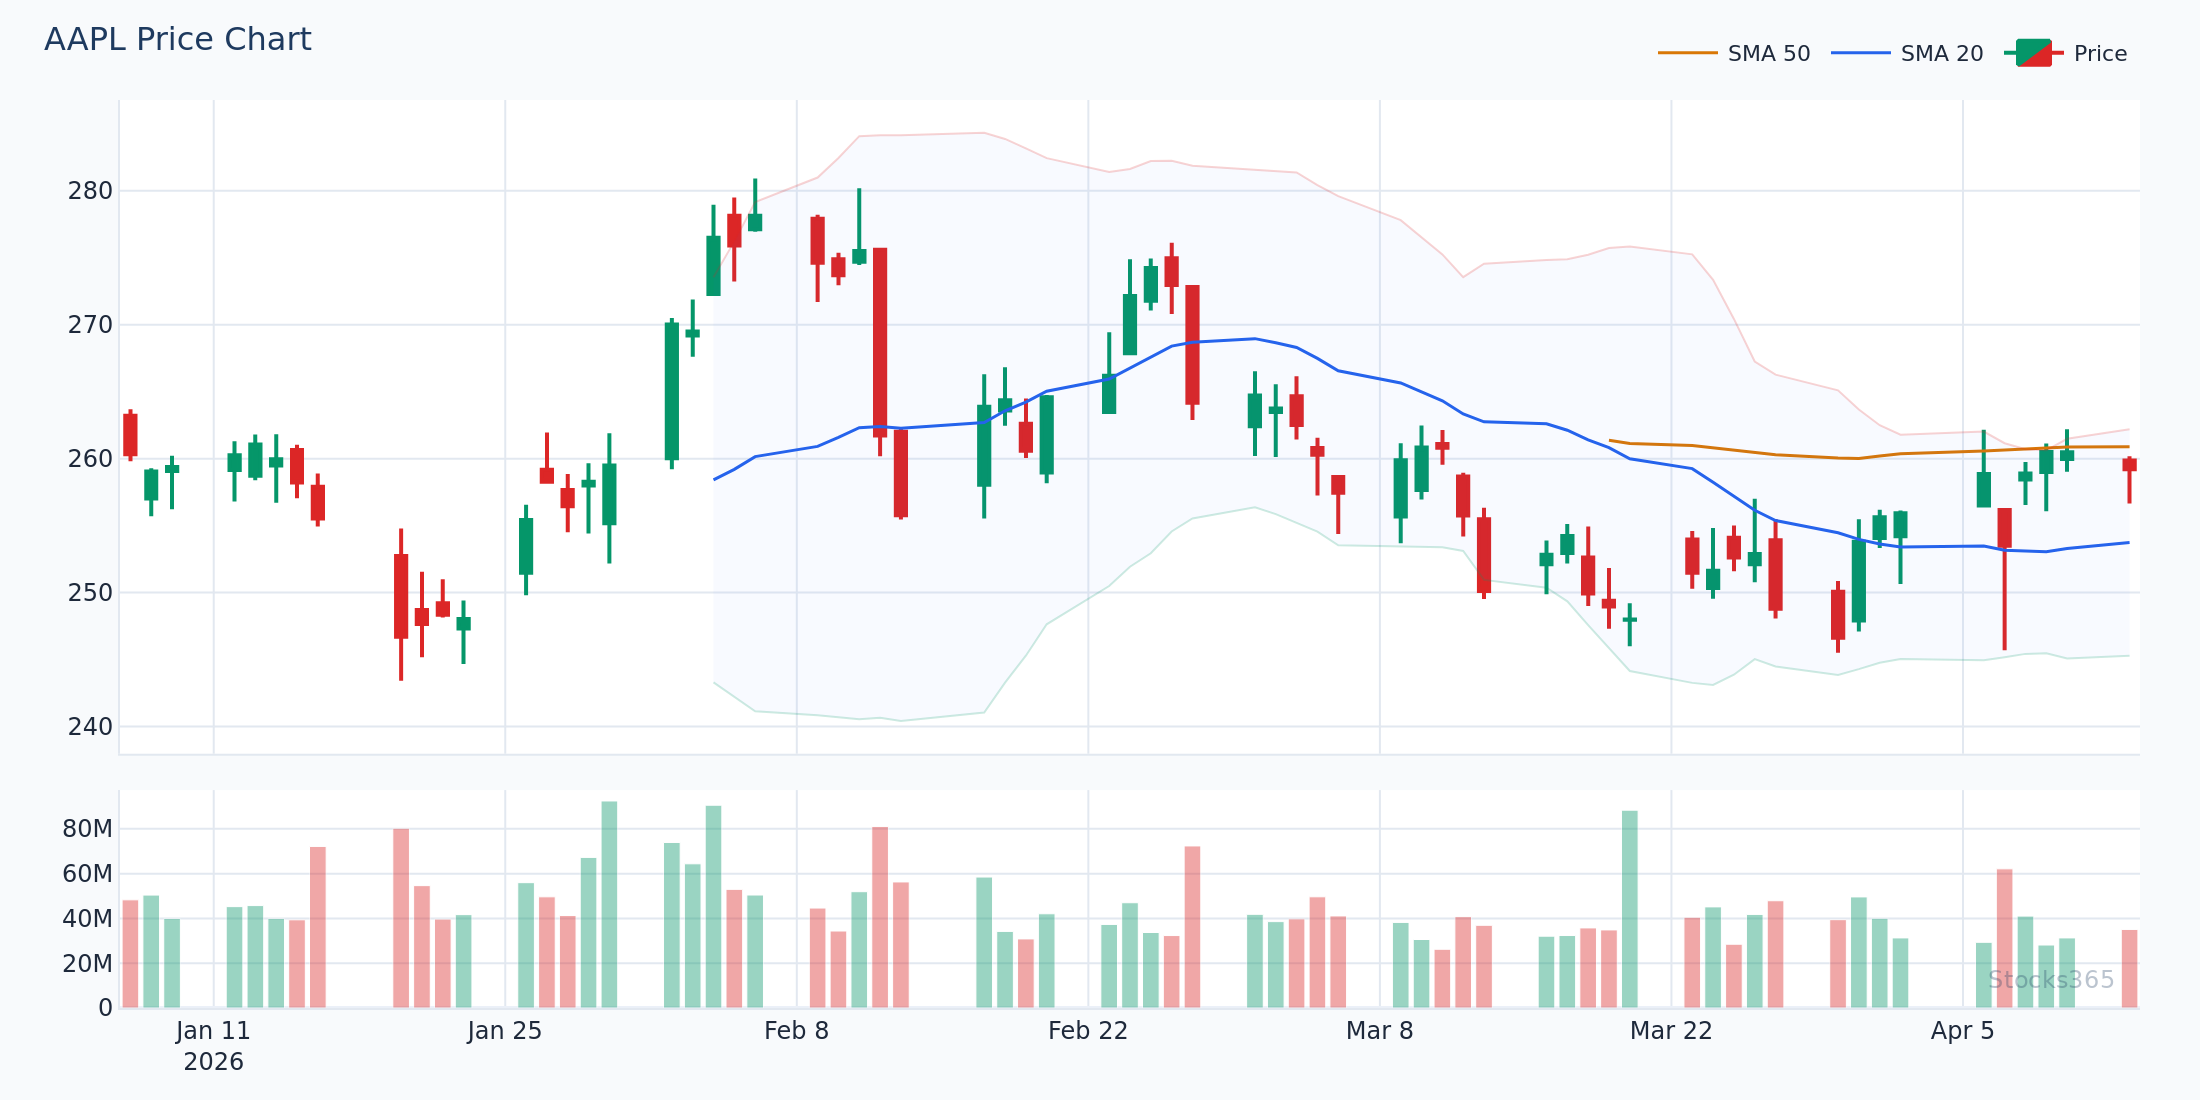
This setup shows price walking down toward the lower Bollinger Band while the MACD histogram begins printing smaller negative bars — a classic early divergence between price and momentum. When the MACD line then crosses above the signal line while price is still near or touching the lower band, the setup is confirmed. A failure of this pattern typically looks like MACD crossing back below the signal line before price recovers the 20-SMA midline.
The Four Key Setups When Using Bollinger Bands with MACD
Setup 1: Lower Band Touch + MACD Bullish Crossover
This is the bread-and-butter long setup. Price reaches or pierces the lower Bollinger Band — signaling that price has stretched to a statistically rare low relative to recent range. Simultaneously, or shortly after, the MACD line crosses above the signal line. The histogram turns from red to green.
Entry: On the candle that closes with MACD crossed bullish while price is still within one ATR of the lower band.
Confirmation: Price reclaims the 20-SMA (middle band) within 3-5 candles.
Invalidation: MACD crosses back below signal before price hits the midline.
Setup 2: Upper Band Touch + MACD Bearish Crossover
The mirror image for short trades. Price pushes into or beyond the upper Bollinger Band while MACD crosses bearish. The histogram turns from green to red. This setup works best after an extended run — not in the early stages of a trend where price can walk the upper band for weeks.
The key word is extended. Counting the MACD histogram peaks can help here. If the histogram has printed progressively lower peaks while price made higher highs, bearish divergence is in play — and the crossover carries more weight.
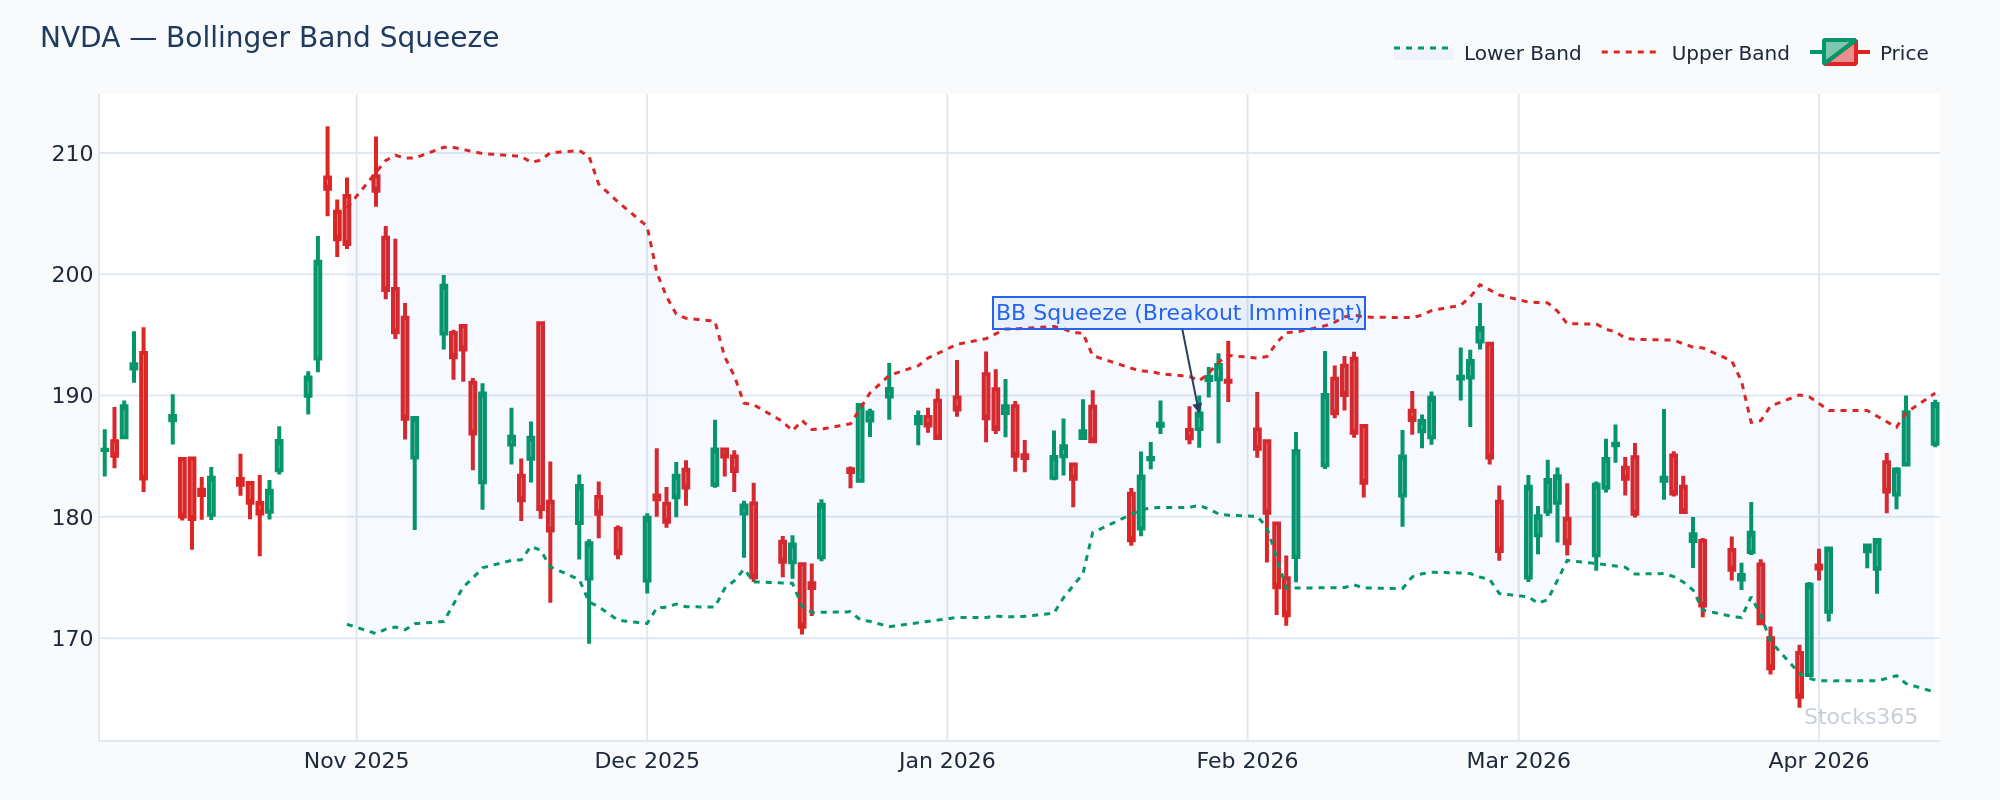
The squeeze shown here is identified by band width compressing to multi-week lows. MACD is hovering near the zero line — neither strongly bullish nor bearish — which is typical before a squeeze resolution. The direction of the MACD crossover after the squeeze determines trade direction: bullish cross favors long, bearish cross favors short. The setup is invalidated if price breaks out in one direction but MACD contradicts with a cross the other way within two candles.
Setup 3: Bollinger Squeeze Breakout Confirmed by MACD
When band width compresses below its 20th percentile (the squeeze), the market is coiling energy. The breakout that follows tends to be explosive — often 2-3 ATR in the expansion phase. MACD acts as the direction filter.
Wait for the squeeze. Watch for the breakout candle. Confirm with MACD. Enter on the next candle open.
This setup produces fewer signals but higher quality ones. It's particularly effective on daily and 4-hour charts where the squeeze has built over multiple sessions.
Setup 4: MACD Zero-Line Cross While Price Holds Above/Below Midline
A MACD zero-line cross — where the MACD line crosses above or below zero — is a stronger momentum signal than a signal-line crossover. When this happens while price is holding above the 20-SMA middle band (bullish) or below it (bearish), it confirms trend continuation rather than just a short-term bounce.
This setup pairs well with the RSI divergence signals that often appear at the same turning points, giving you a third layer of confluence.
Here's What Most Traders Get Wrong
Most traders see price touch the lower Bollinger Band and immediately treat it as a buy signal. They're ignoring MACD entirely. In a strong downtrend, price can walk the lower band — touching and re-touching it for candle after candle — while MACD stays deeply negative. There's no bounce coming. The band touch means price is volatile and oversold relative to recent range, not that it's ready to reverse. The edge is waiting for MACD to confirm with a crossover after the band touch, not entering blindly on the touch itself.
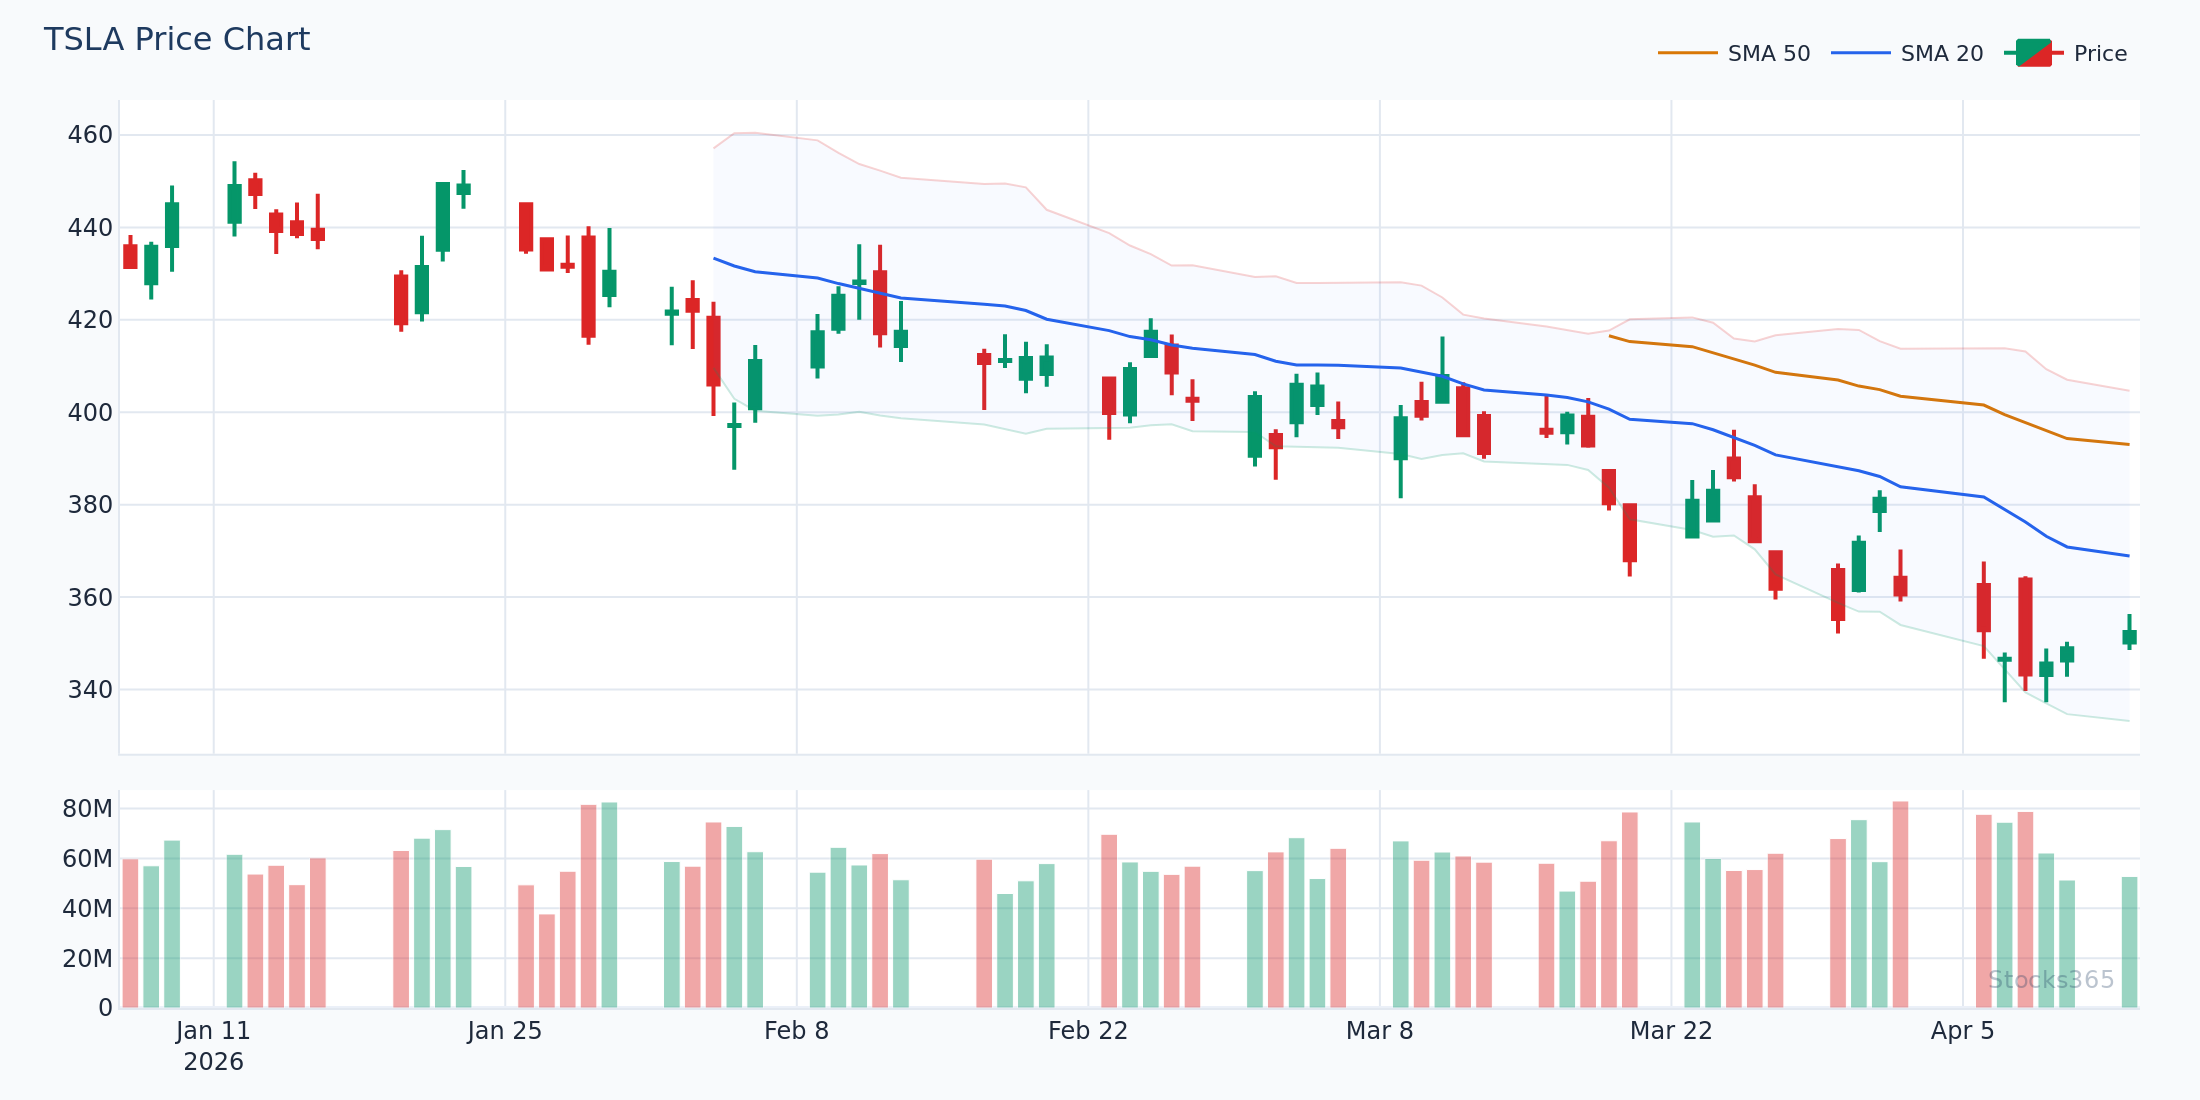
This chart illustrates a textbook upper band rejection setup: price closes above the upper band on elevated volume, then pulls back. The MACD histogram begins shrinking before the bearish crossover prints — an early warning. Once the MACD line crosses below the signal line and price falls back inside the bands, the move lower accelerates toward the midline and often the lower band. The setup fails if MACD re-crosses bullish within two candles and price reclaims the upper band.
Practical Filtering Rules to Improve Signal Quality
The Trend Filter
Apply the strategy in the direction of the higher timeframe trend. If the weekly chart shows MACD in bullish territory (above zero) and price above the 20-week SMA, focus exclusively on lower band touch long setups on the daily chart. Ignore short signals in this environment — you're fighting the trend.
The Volume Filter
Breakout signals from a Bollinger squeeze carry far more weight when accompanied by a volume surge of at least 1.5x the 20-day average. Low-volume breakouts frequently reverse. High-volume breakouts tend to follow through. Add volume as a third confirmation layer.
The RSI Confluence Layer
Adding RSI as a third filter sharpens entries significantly. For long setups: lower Bollinger Band touch + MACD bullish crossover + RSI below 40 (or recovering from oversold). For short setups: upper band touch + MACD bearish crossover + RSI above 60 (or retreating from overbought). The RSI overbought and oversold levels guide explains exactly how to calibrate these thresholds for different market conditions and timeframes.
Three-way confluence is rare. When it appears, pay attention.
This chart aligns all three signals at a single price structure: RSI recovering from below 35, MACD printing a fresh bullish crossover, and price bouncing from the lower Bollinger Band. The triple confluence here reduces false-signal probability significantly. The setup resolves bullishly when price crosses back above the 20-SMA midline within the next 3-5 sessions; a close back below the lower band after entry is the hard invalidation signal.
Timeframe Considerations for This Strategy
The Bollinger Bands with MACD combo works across multiple timeframes, but each has its characteristics. Daily charts produce the cleanest signals with the lowest noise ratio — ideal for swing traders holding 3-10 days. The 4-hour chart works well for active traders who want more setups without diving into scalping territory. The 1-hour chart is viable but requires tighter risk management as false signals increase.
Avoid the 5-minute and 1-minute charts with this combo. MACD lags on very short timeframes, and by the time a crossover confirms on a 1-minute chart, the move is often already over.
What the Data Actually Says
Our analysis of 2,325 MACD bullish cross signals shows a 49.4% win rate with a profit factor of 0.93 over a 10-day holding period. Commodities showed the best performance at 55.0%, while crypto came in worst at 38.4%. These numbers confirm what experienced traders already know: MACD alone isn't enough. The edge comes from adding Bollinger Band context to filter which MACD crossovers carry genuine weight. See the full breakdown at Stocks365 Insights.
Individually, neither indicator has a wide edge. The combination — and the filtering rules applied around it — is where performance improves.
For comparison, Stocks365 research across 3,278 Bollinger upper band touch signals found a 49.8% win rate with a profit factor of 0.89 standalone. Crypto actually led this signal at 56.8% win rate, with commodities lagging at 42.0% — a direct reversal of the MACD data. This divergence between asset classes is a critical insight: the combination of both signals filters out the worst performers in each category, improving overall reliability.
Common Mistakes That Kill This Strategy
Entering on the Crossover Without the Band Context
A MACD crossover in the middle of the Bollinger Bands — with price nowhere near either band and no squeeze in play — has no statistical edge. It's a random coin flip. Only take crossovers that occur in the context of a band touch, a band squeeze, or a significant band expansion.
Using Default Settings Without Adjustment
The standard MACD settings (12, 26, 9) and Bollinger Band settings (20, 2) work well on daily charts. On 4-hour charts, some traders tighten MACD to (8, 21, 5) to reduce lag. On weekly charts, widening the Bollinger Band multiplier to 2.5 reduces noise. Understand what you're adjusting and why. The RSI Settings guide covers the broader principle of period optimization that applies equally here.
Ignoring the Larger Trend
Fighting a strong trend with this combo is account suicide. A lower band touch in a downtrend isn't a buy — it's a rest before the next leg down. Always qualify your setups with higher timeframe context first.
Applying This Strategy with Stocks365 Signals
You don't need to manually scan hundreds of charts for Bollinger Band and MACD confluence. The Stocks365 signals dashboard surfaces pre-filtered setups ranked by multi-indicator agreement. When checking individual stocks like the AAPL signal page, you can see live Bollinger and MACD status alongside trust score components — including whether current momentum and volatility readings are aligned for a trade.
The trust score removes the guesswork. Focus on trading, not scanning.
What to Watch For
- Bollinger squeeze breakouts on high-momentum sectors: When band width drops below the 20th percentile of its recent range on tech or energy stocks, the subsequent expansion often produces a 2-3 ATR move. Wait for a MACD crossover to confirm direction before entering — the breakout candle direction alone isn't sufficient.
- Lower band walks in downtrends: If price has touched the lower Bollinger Band three or more times in succession without MACD turning positive, this is a bearish continuation signal — not a buy setup. The strategy flips to short bias until MACD resets above zero.
- MACD histogram divergence before crossovers: Watch for shrinking histogram bars (negative bars getting smaller) while price makes new lows near the lower band. This momentum-price divergence often precedes the bullish crossover by 2-4 candles, giving early warning to prepare for entry.
- Upper band breakouts with flat MACD: When price breaks above the upper Bollinger Band but MACD is flat or declining, the breakout lacks momentum backing. These setups frequently produce sharp reversals within 3-5 candles — watch for short entries on the reversal candle back inside the band.
- Post-squeeze MACD alignment: After a confirmed Bollinger squeeze (band width at multi-week lows), the first MACD crossover in either direction carries outsized significance. These setups have historically preceded the largest single-candle moves in the subsequent expansion phase.
How Stocks365 Uses This
Stocks365 integrates both Bollinger Bands and MACD as distinct components within its Trust Score system — a composite of 12+ technical indicators that evaluates signal quality before surfacing any trade idea.
Bollinger Band positioning contributes to the volatility regime scoring: whether the market is in a squeeze (low-volatility accumulation phase), an expansion (trending), or at a statistical extreme (band touch). This context flag adjusts how other signals are weighted.
MACD crossovers and histogram direction feed into the momentum agreement score. A bullish MACD crossover increases agreement score weighting. A bearish crossover in an otherwise bullish setup reduces overall trust score, flagging the signal as conflicted.
When both components align — Bollinger Band at a statistical extreme AND MACD confirming direction — the trust score elevates the signal into the high-agreement tier. These are the setups the platform surfaces first. Not every crossover. Not every band touch. Only the ones where the evidence stacks up. Explore current high-trust setups on the Stocks365 dashboard.
Key Takeaways
- Bollinger Bands measure volatility and price extremes; MACD measures momentum direction. Together, they eliminate each other's primary weakness.
- The four core setups are: lower band touch + MACD bullish cross, upper band touch + MACD bearish cross, squeeze breakout confirmed by MACD, and zero-line cross with price holding above/below midline.
- Never enter on a MACD crossover alone — only when it occurs in the context of a band touch, squeeze, or expansion.
- Add RSI as a third confluence layer to sharpen entries and reduce false signals, particularly at oversold/overbought extremes.
- Timeframe matters: daily and 4-hour charts produce the cleanest signals; avoid very short timeframes where MACD lag kills accuracy.
- Trend direction on the higher timeframe determines which setups you take — only trade Bollinger/MACD signals in the direction of the prevailing trend.
- Data confirms no single indicator has a decisive edge alone — the combination and filtering rules are where real performance gains emerge.