
Bollinger Bands in Trending Markets: Why the Rules Change
Most traders learn Bollinger Bands as a mean-reversion tool. Price touches the upper band — sell. Price touches the lower band — buy. Clean, simple, and completely wrong in a strong trend.
In a genuinely trending market, price doesn't bounce back from the bands. It walks them. It hugs the upper band for days, sometimes weeks, while every mean-reversion trader gets stopped out one by one.
Understanding the difference between range-bound and trending Bollinger Band behavior is the dividing line between profitable trend trading and constant frustration.
What Are Bollinger Bands? A Quick Refresher
Bollinger Bands consist of three lines plotted on a price chart: a 20-period simple moving average in the middle, an upper band set two standard deviations above the SMA, and a lower band set two standard deviations below it. John Bollinger designed them to adapt dynamically to volatility — the bands expand when price moves aggressively and contract during quiet, consolidating periods.
By definition, roughly 95% of price action should fall within the bands under normal distribution. But markets aren't normally distributed. And in a strong trend, that statistical expectation breaks down entirely.
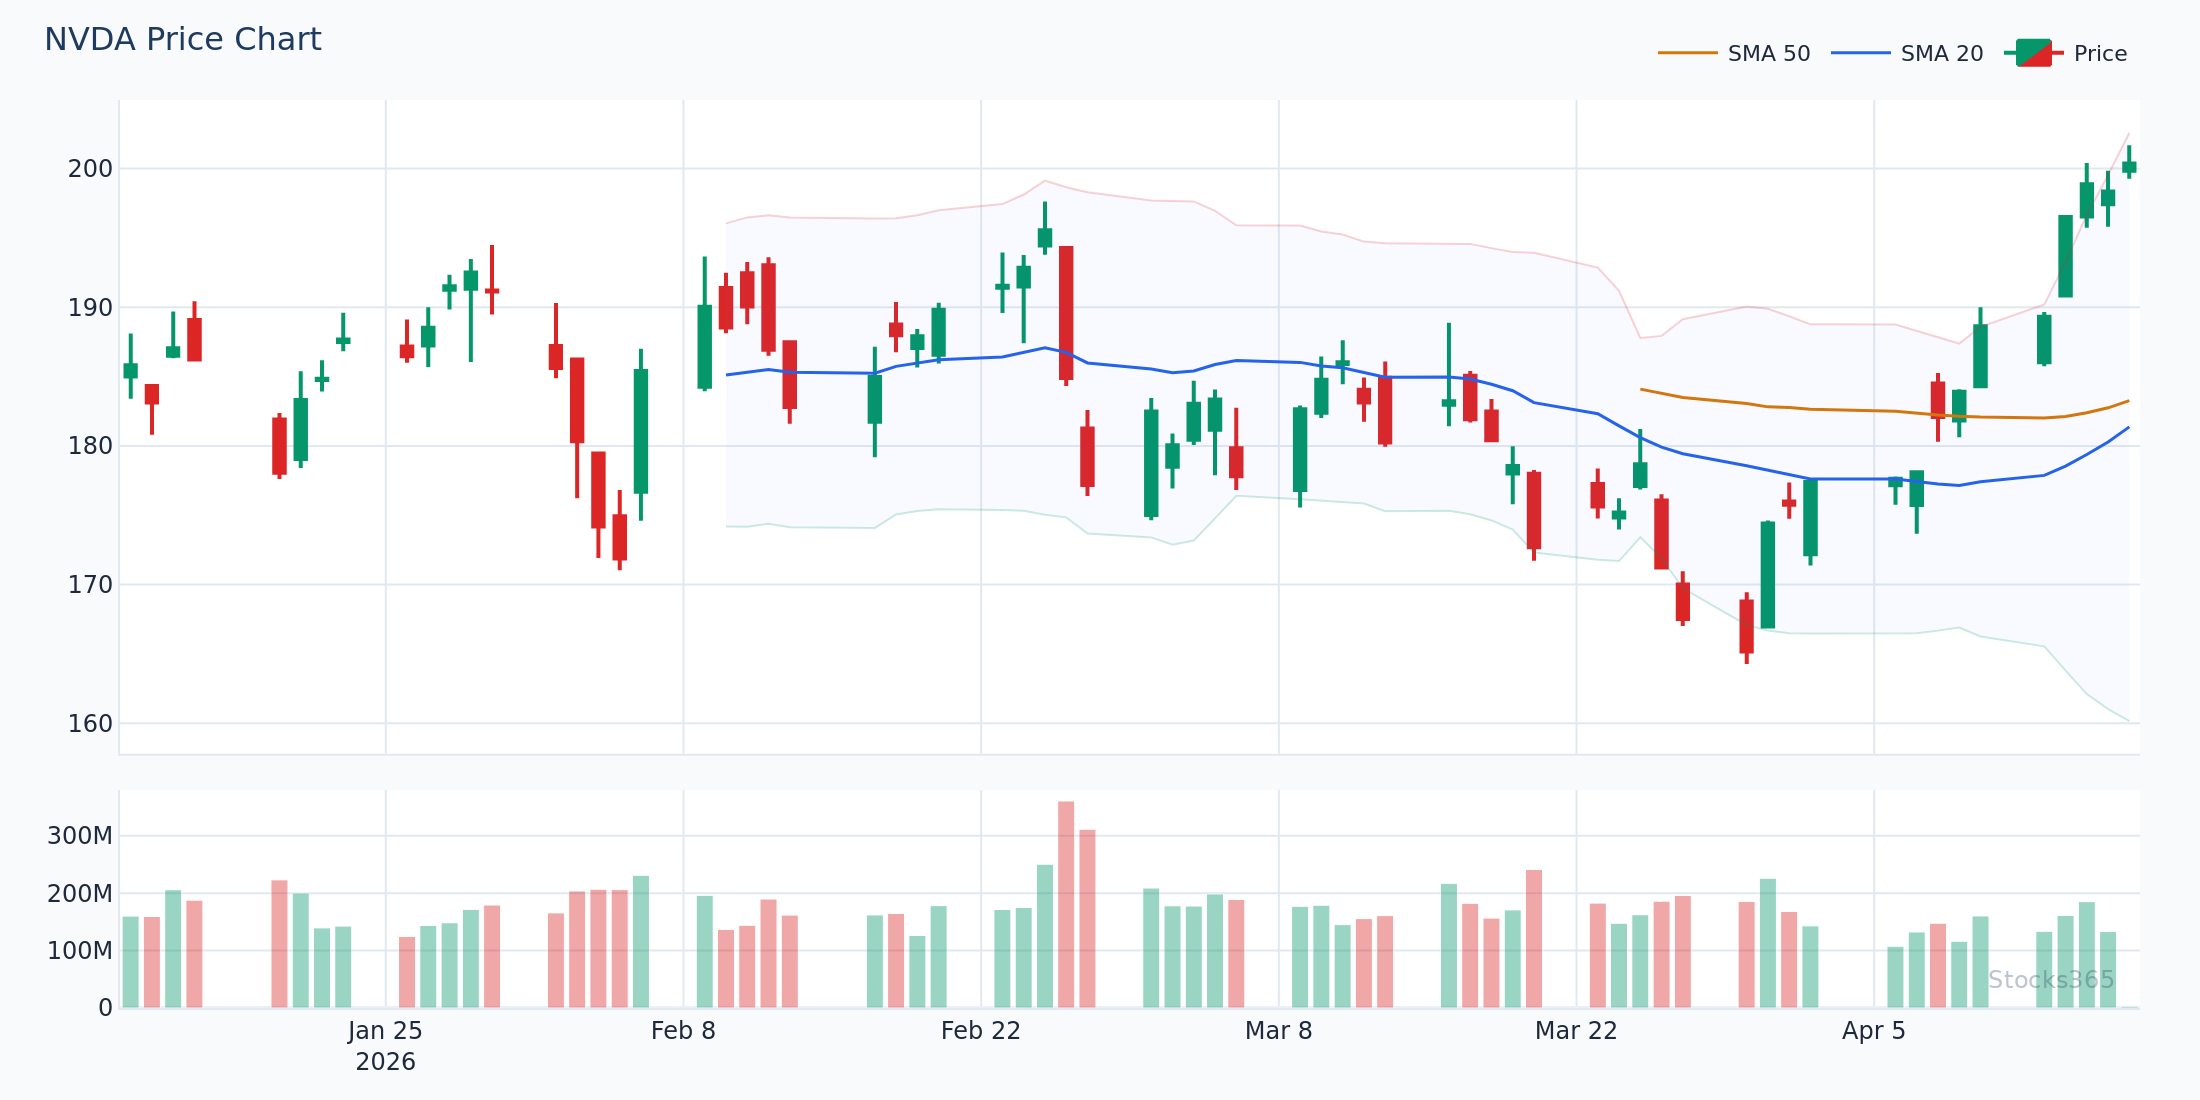
This chart shows price repeatedly closing at or above the upper Bollinger Band across multiple sessions. Each close above the band isn't a reversal signal — it's a confirmation that the trend is intact and momentum is strong. The pattern invalidates if price closes decisively back inside the bands with elevated volume, suggesting distribution rather than continuation.
What It Means to "Walk the Bands"
Band-walking is what happens when momentum is so strong that price consistently closes at or beyond the outer band. In an uptrend, price rides the upper band like a rail. In a downtrend, it slides along the lower band.
This behavior signals one thing above all else: the trend is not ready to reverse.
Here's what walking the bands looks like in practice:
- Price breaks above the upper band with above-average volume
- The upper band itself begins rising, confirming the SMA is tracking the move
- Pullbacks are shallow — price dips toward the 20-SMA but rarely reaches the lower band
- Each new candle closing near the upper band resets the statistical baseline higher
The key insight is directional. When price walks the upper band, the upper band becomes dynamic support on any pullback, not resistance to fade.
Here's What Most Traders Get Wrong
Most traders treat an upper Bollinger Band touch as an automatic sell signal. In a sideways market, that logic has merit — price statistically reverts toward the mean. But in a Bollinger Bands trending market, the upper band touch is confirmation, not a warning.
The edge isn't selling the band touch. The edge is watching price fail to hold the upper band — when the band flattens, when closes start occurring mid-band rather than at the top, when volume dries up on new highs. That's when the trend is exhausting. Not before.
Fighting a band-walk is expensive. Every premature short adds to the trend's fuel as stops get hit and short-sellers are forced to cover.
The Bollinger Band Squeeze: Where Strong Trends Begin
Strong trends don't appear from nowhere. They almost always emerge from a period of compression — the Bollinger Band squeeze.
A squeeze occurs when the bands contract sharply, reflecting a period of extremely low volatility. The 20-SMA goes flat. Price oscillates in a tight range. Volume often drops. Then something changes.
The squeeze resolves with expansion. Bands widen rapidly. Volume surges. And if the breakout direction is up, price immediately begins walking the upper band.
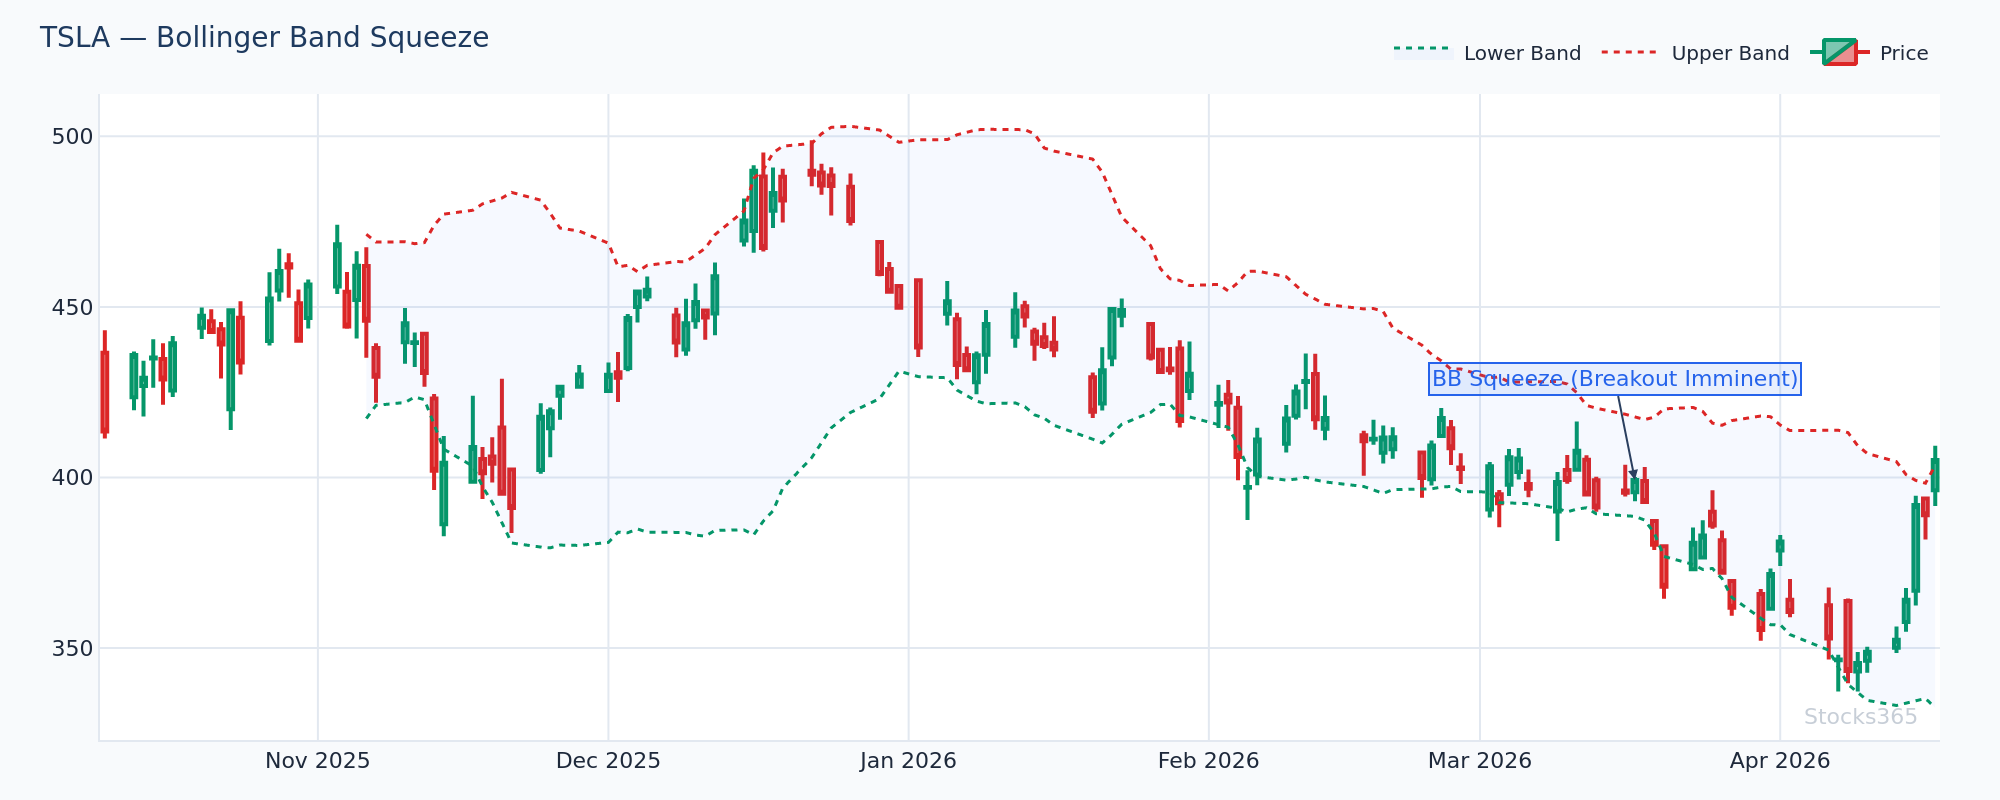
This setup shows the band width compressing to a multi-month low before a sharp expansion. When the breakout candle closes above the upper band with volume running at two times the 20-period average, the squeeze has resolved bullishly. The pattern fails if price breaks the squeeze in one direction and immediately reverses back through the midline — a false breakout that often traps aggressive momentum traders.
Watch for squeeze breakouts on high-beta names. When band width drops below the 20th percentile of its trailing range, the next expansion tends to produce a significant directional move. The breakout direction, confirmed by volume, determines whether to trade long or sit out entirely.
How to Identify a Legitimate Band-Walk vs. a False Break
Not every upper band touch becomes a band-walk. Some are genuine false breaks that reverse hard. Here's how to distinguish the two:
Signs of a Legitimate Band-Walk
- Rising upper band: The band slopes upward alongside price, confirming trend acceleration
- Consecutive closes above the 20-SMA: Price doesn't dip below the middle band during the trend
- Volume confirmation: Each breakout candle shows above-average volume; pullback candles show below-average volume
- Higher lows on pullbacks: Each dip toward the 20-SMA holds at a higher level than the previous dip
Signs of a False Break
- Flat or declining upper band: The band isn't rising with price, suggesting the move lacks momentum
- Long upper wicks: Price reaches the band intraday but closes well below it
- Volume divergence: New price highs occur on declining volume — a classic exhaustion signal
- RSI divergence: Price makes a higher high but RSI makes a lower high — worth cross-referencing with our deep dive on RSI Divergence: Master Bullish & Bearish Signals
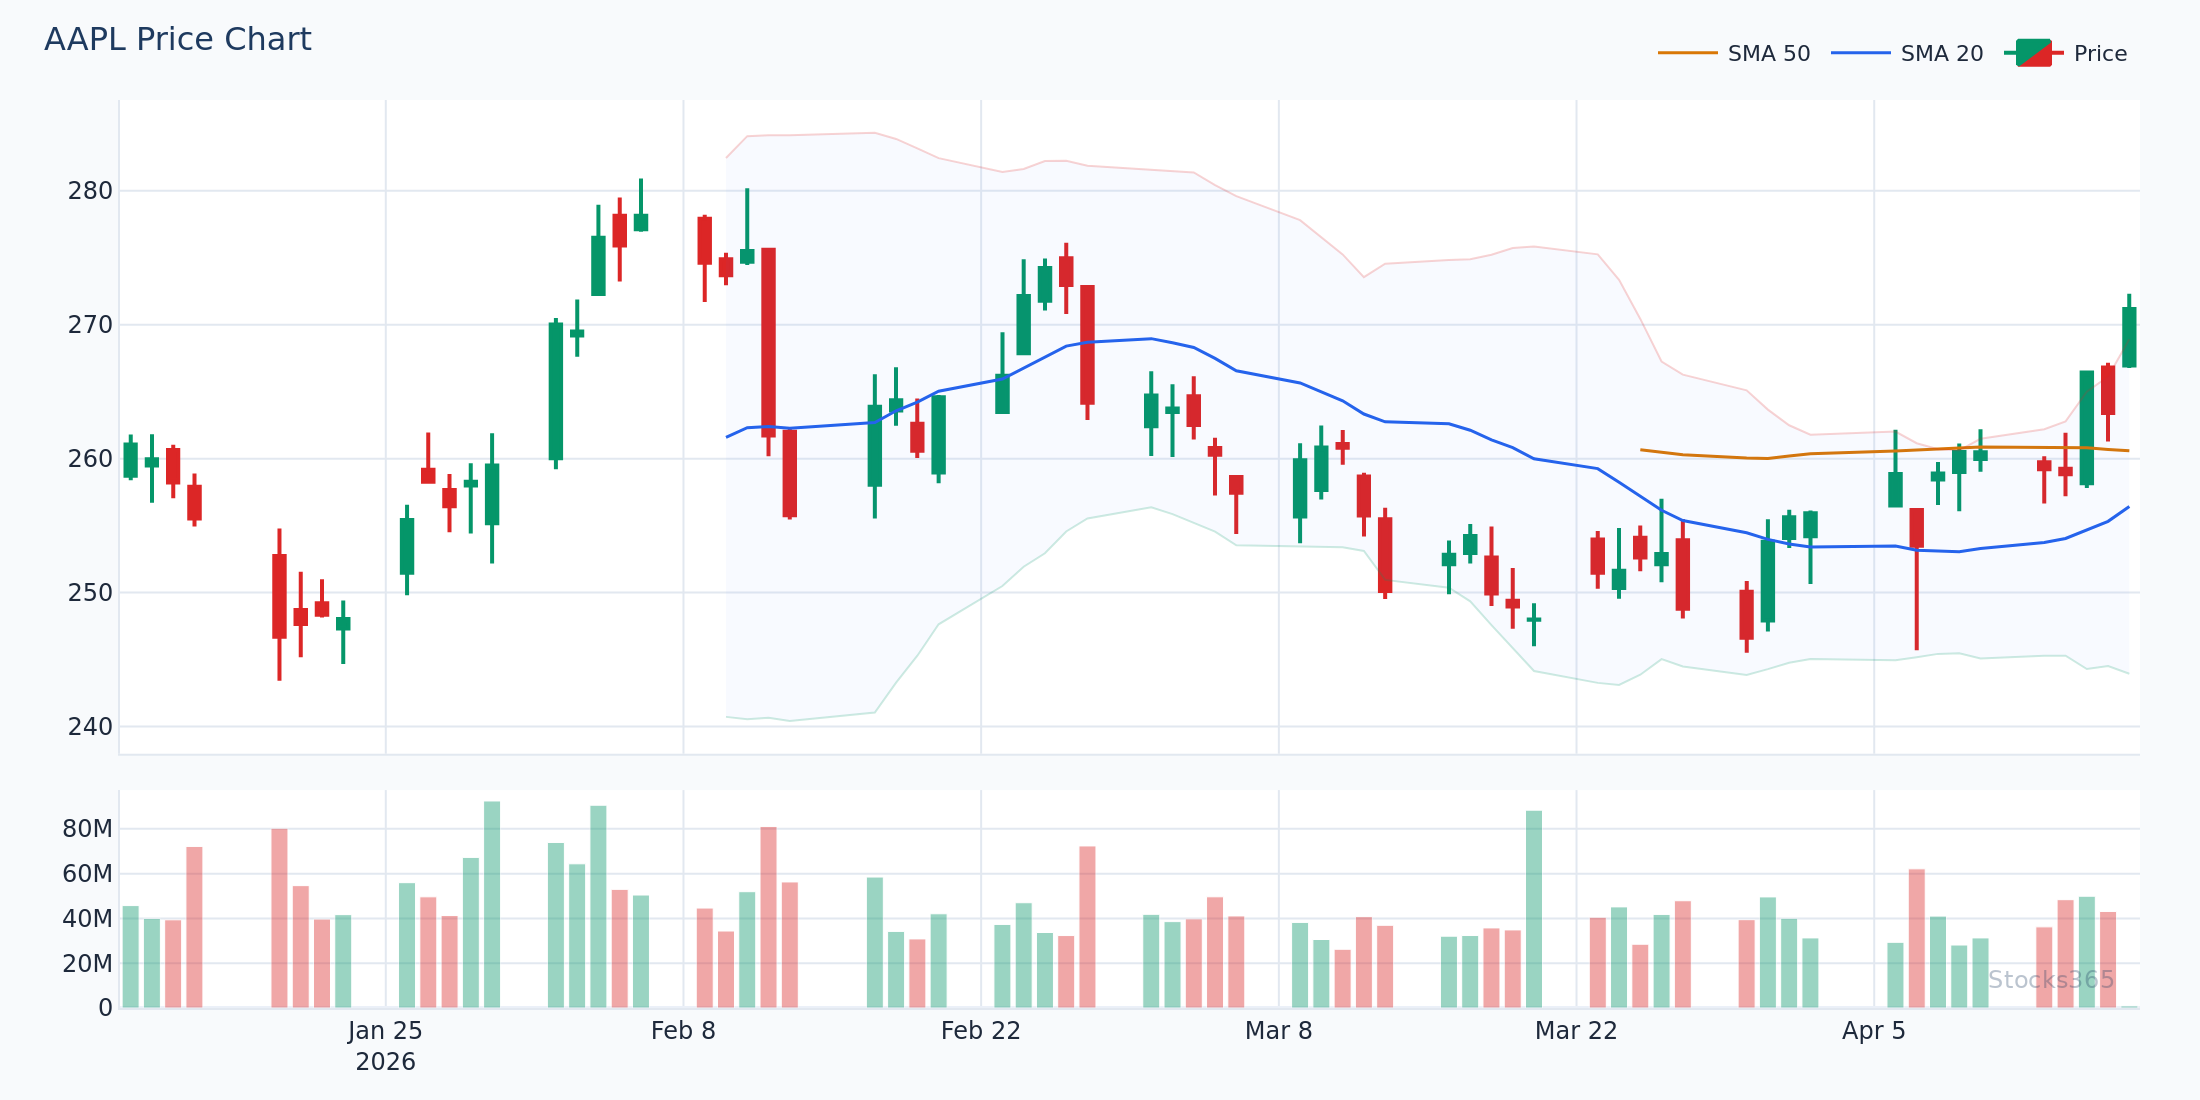
This chart highlights multiple pullbacks during a trend where price dipped to the 20-SMA but immediately resumed higher without ever closing below the middle band. Each touch of the SMA acted as a reload opportunity for trend traders already positioned long. The setup breaks down when price closes two consecutive sessions below the 20-SMA on above-average volume — that's when the band-walk is officially over.
Combining RSI With Bollinger Bands in a Trending Market
Bollinger Bands tell you where price is relative to volatility. RSI tells you how strong the momentum driving that move actually is. Together, they're significantly more powerful than either alone.
In a strong uptrend with an active band-walk, RSI typically holds above 50 — often above 60. It may spike above 70 and stay there for extended periods without a meaningful reversal. This is normal in a trending market.
The signal to watch isn't RSI crossing 70. That's the move you ride. The signal worth acting on is when RSI breaks back below 60 while price simultaneously loses the 20-SMA. That convergence — band-walk ending, RSI weakening, SMA lost — is a genuine trend exhaustion signal.
For a full breakdown of RSI behavior in trending environments, our guide on How to Use RSI in Trading covers entry timing, momentum confirmation, and exit signals in detail.
One more pairing worth understanding: hidden RSI divergence. When price makes a higher low during a brief pullback but RSI makes a lower low, that's often the best re-entry signal in an ongoing trend. We cover this advanced concept in our article on Hidden RSI Divergence: The Advanced Signal Most Traders Miss.
The Role of the 20-SMA During a Band-Walk
The 20-period SMA is the backbone of Bollinger Bands. Most traders ignore it in favor of watching the outer bands, but in a trending market it deserves equal attention.
During a healthy band-walk, the 20-SMA serves three functions:
- Trend filter: Price consistently above the 20-SMA confirms the uptrend. Any signal that requires shorting while price is above it should be treated with skepticism.
- Pullback target: In strong trends, the 20-SMA acts as a magnet during consolidation. Shallow pullbacks that hold the SMA and resume higher are the textbook re-entry setup.
- Trend termination signal: A clean, high-volume close below the 20-SMA during a band-walk doesn't just end the walk — it often signals a broader trend shift.
This chart illustrates how the 20-SMA repeatedly caught pullbacks during an extended band-walk phase. Price dipped to touch the SMA three separate times before each continuation higher. The third touch produced the strongest momentum continuation, as prior failed shorts added fuel to the next leg. The pattern breaks down if a close occurs beneath the SMA on volume that exceeds the 20-period average — at that point, the trend structure has changed.
Band-Walk Entry and Exit Framework
Executing trades during a band-walk requires a different framework than typical breakout or reversal trading.
Entry Approach
The best entries in a band-walk trend aren't on the initial breakout above the upper band — that's often the highest-risk point. The best entries come on the first or second pullback to the 20-SMA after the band-walk has been established.
Look for: price pulling back to the 20-SMA on light volume, a short consolidation candle (inside bar or doji) at the SMA, then a resumption candle closing back near the upper band with renewed volume. That three-candle pattern — pullback, pause, resume — is the band-walk re-entry setup.
Exit Approach
Exits in band-walk trends should be event-driven, not time-driven. Don't exit because price has been trending for two weeks. Exit when the structure changes:
- First close below the 20-SMA on above-average volume
- Two consecutive closes in the lower half of the Bollinger Band range
- Upper band beginning to flatten or slope downward
- RSI divergence confirming weakening momentum — see our full guide on RSI Overbought and Oversold Levels for context on what divergence at extended levels actually means
What the Data Actually Shows About Upper Band Touches
Band-walking sounds compelling in theory. But what does actual signal data say?
Our analysis of 3,255 Bollinger Upper Band touch signals shows a 49.6% win rate with a profit factor of 0.88 over a 10-day holding period — meaning a mechanical upper-band-touch entry strategy, taken blindly, actually loses money over time. Crypto was the best-performing asset class at 56.7%, while commodities were the worst at 41.5%. See the full dataset at Stocks365 Insights.
The takeaway? Touching the upper band alone is not an edge. Context is everything. The same upper band touch in a confirmed band-walk trend with rising band slope and volume confirmation is a completely different trade than a random upper band touch in a ranging, low-momentum market. Filtering by trend structure before acting on band signals is what separates edge from noise.
Trend structure matters enormously. It's not the band touch — it's everything surrounding it.
Bollinger Bands in Downtrends: Walking the Lower Band
Everything above applies in reverse for downtrends. Price walks the lower band in a sustained downtrend. The lower band slopes downward. Bounces toward the 20-SMA fail and reverse. RSI remains below 40 for extended periods.
The mistake traders make here is buying every lower band touch as a value opportunity. In a genuine downtrend band-walk, lower band touches are continuation signals, not bottoms.
The same exit framework applies: when price closes above the 20-SMA on rising volume after a band-walk downtrend, the structure has shifted. That's not a short opportunity — it's a signal to reassess the entire directional thesis.
For a broader look at how momentum oscillators read trend exhaustion in these conditions, our comparison of RSI vs Stochastic Oscillator explains how each handles sustained trending versus mean-reverting environments differently.
What to Watch For
- Bollinger squeeze breakouts on high-beta equities: When band width compresses to the 20th percentile of its trailing 52-week range, watch the breakout direction closely. A close above the upper band with volume two times average often initiates a multi-week band-walk — and the first pullback to the 20-SMA is typically the highest-probability re-entry.
- Rising upper band slope with consecutive closes above the midline: When the upper band slopes upward at a consistent angle and price hasn't touched the lower band in 10 or more sessions, the trend is in full band-walk mode. Mean-reversion setups become low-probability trades until the slope flattens.
- RSI holding above 60 during pullbacks in trending markets: In a confirmed band-walk trend, RSI dipping to 60 and bouncing — rather than falling to oversold territory — confirms the trend is intact. RSI falling below 50 on a pullback is the first warning that the band-walk may be ending.
- Volume divergence at band extremes after an extended run: When price makes new highs at the upper band but volume is declining relative to the prior three sessions, watch for the upper band to flatten. This precedes the transition from band-walk to consolidation — and sometimes a sharper reversal.
- Lower band walks in broad market downturns: During risk-off periods where major indices are walking their lower Bollinger Bands, bounces toward the 20-SMA on light volume are typically distribution, not accumulation. The lower band walk ends when a close above the 20-SMA is accompanied by meaningful volume expansion.
How Stocks365 Uses This
Stocks365 Trust Score Integration
Bollinger Band positioning is one of more than 12 indicators built into the Stocks365 Trust Score system. Specifically, band-walk detection contributes to the trend regime scoring component — which assesses whether a given instrument is in a trending, ranging, or volatile-reversal mode before any signal is evaluated.
When price is walking the upper Bollinger Band with a rising band slope, the Trust Score system upgrades momentum signals and downgrades mean-reversion signals for that instrument. A bullish breakout signal in a confirmed band-walk regime carries a higher agreement score than the same signal in a flat, low-momentum environment.
This regime-awareness prevents the Trust Score from treating all upper band touches equally — because as the data shows, they're not. You can see how this plays out live on the Stocks365 signals dashboard, where each signal includes its regime context alongside the trust score. For individual stock signals that incorporate band-walk regime detection, check out live examples like the AAPL signal page.