
Bollinger Bands vs Keltner Channels: Which Volatility Indicator Actually Works?
Two bands. Same goal. Very different results depending on what you're trading.
Bollinger Bands and Keltner Channels are both envelope-style volatility indicators that wrap around price action. Both use a moving average as the midline. Both expand and contract as volatility shifts. But underneath the surface, they measure volatility in fundamentally different ways — and that difference changes everything about how you use them.
This guide breaks down the mechanics, the edge cases, the setups, and the real-world performance data so you can stop guessing which one belongs on your chart.
How Bollinger Bands Work
John Bollinger introduced Bollinger Bands in the 1980s. The formula is straightforward: a 20-period simple moving average (SMA) forms the midline, and the upper and lower bands are plotted at a set number of standard deviations above and below that average — typically 2 standard deviations.
The critical word is standard deviation. Standard deviation measures how much price deviates from the mean over the lookback period. When price is volatile and swinging hard, the bands widen dramatically. When price consolidates and barely moves, the bands compress into what traders call a squeeze.
This makes Bollinger Bands self-adjusting. They don't care about ATR or average movement — they respond directly to actual price dispersion. A quiet market genuinely produces narrow bands. A chaotic market produces wide ones.
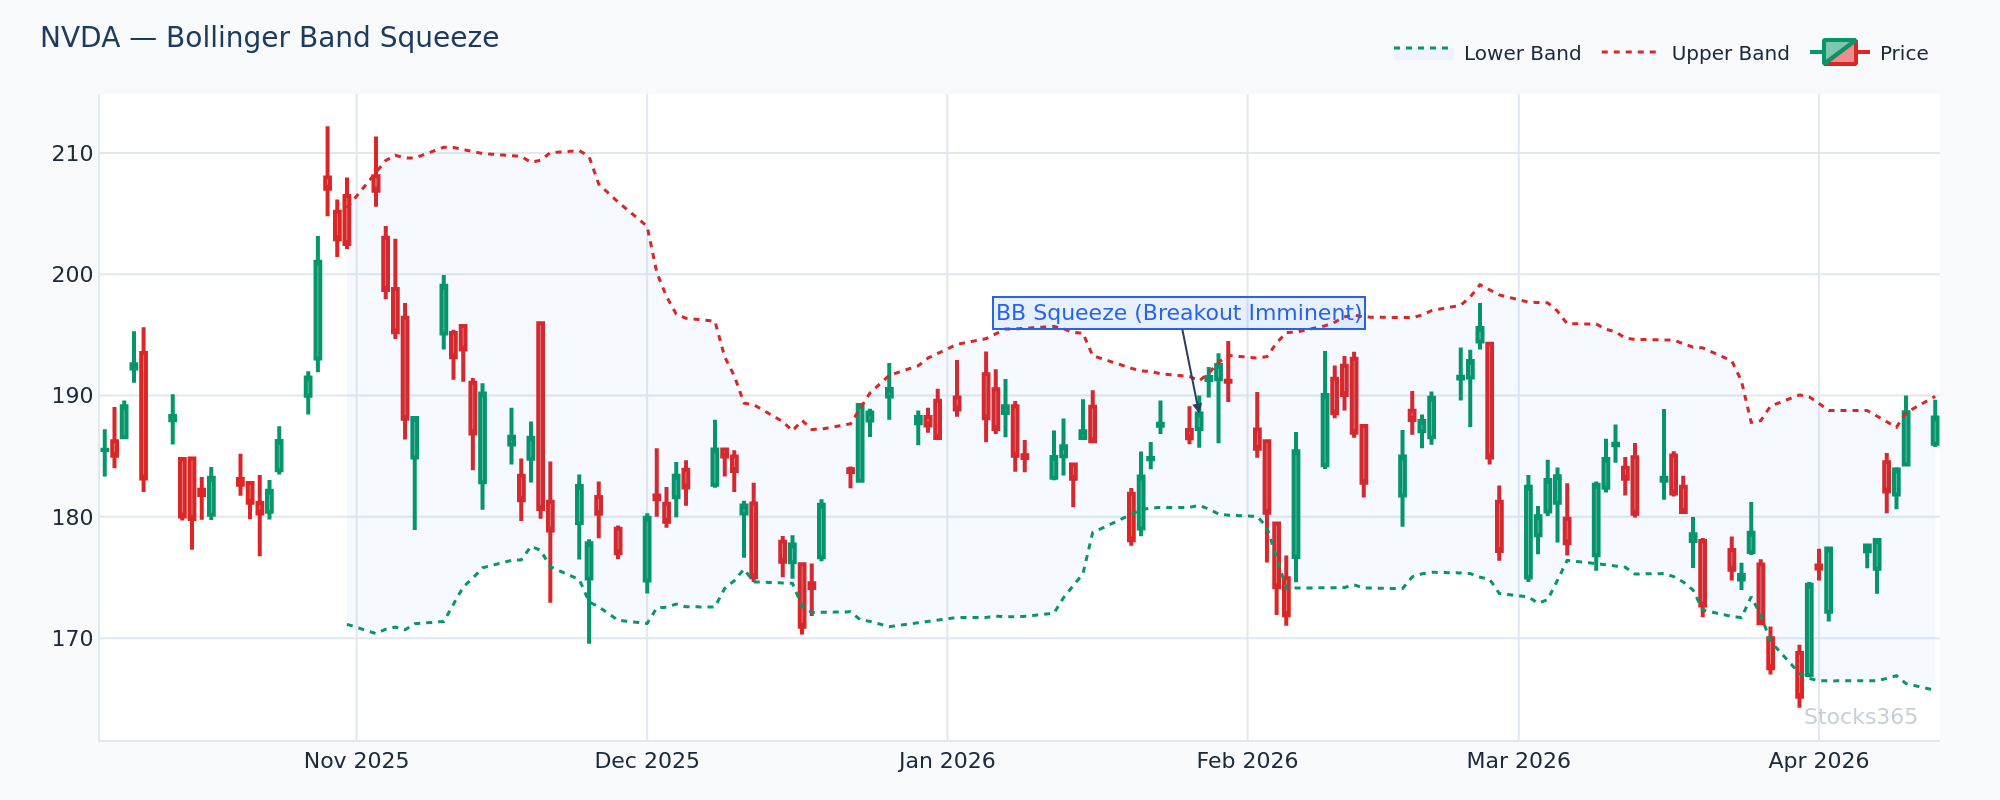
This chart shows NVDA's Bollinger Bands compressing into a squeeze as price consolidates in a tight range. When band width drops to multi-week lows like this, the next directional move tends to be sharp and sustained — often 2 to 3 ATR in the breakout direction. Confirmation comes from a close outside the bands on above-average volume. A failed breakout that immediately reverses back inside the bands invalidates the setup.
Standard Bollinger Band Settings
- Midline: 20-period SMA
- Band width: 2 standard deviations (default)
- Aggressive traders: 1.5 SD for tighter bands
- Long-term traders: 2.5 SD for fewer false touches
How Keltner Channels Work
Chester Keltner developed the original Keltner Channel concept in the 1960s. The modern version, popularized by Linda Bradford Raschke, uses a different volatility measure: Average True Range (ATR).
The midline is a 20-period Exponential Moving Average (EMA) — not an SMA. The upper and lower channels are set at a multiple of ATR above and below the EMA, typically 1.5x to 2x ATR. ATR measures the average range of price movement over recent sessions, including gap behavior.
Because EMA reacts faster to recent price changes than SMA, and because ATR smooths out extreme single-day moves, Keltner Channels tend to be smoother and less reactive than Bollinger Bands. They don't spike wide on a single volatile day the way Bollinger Bands do.
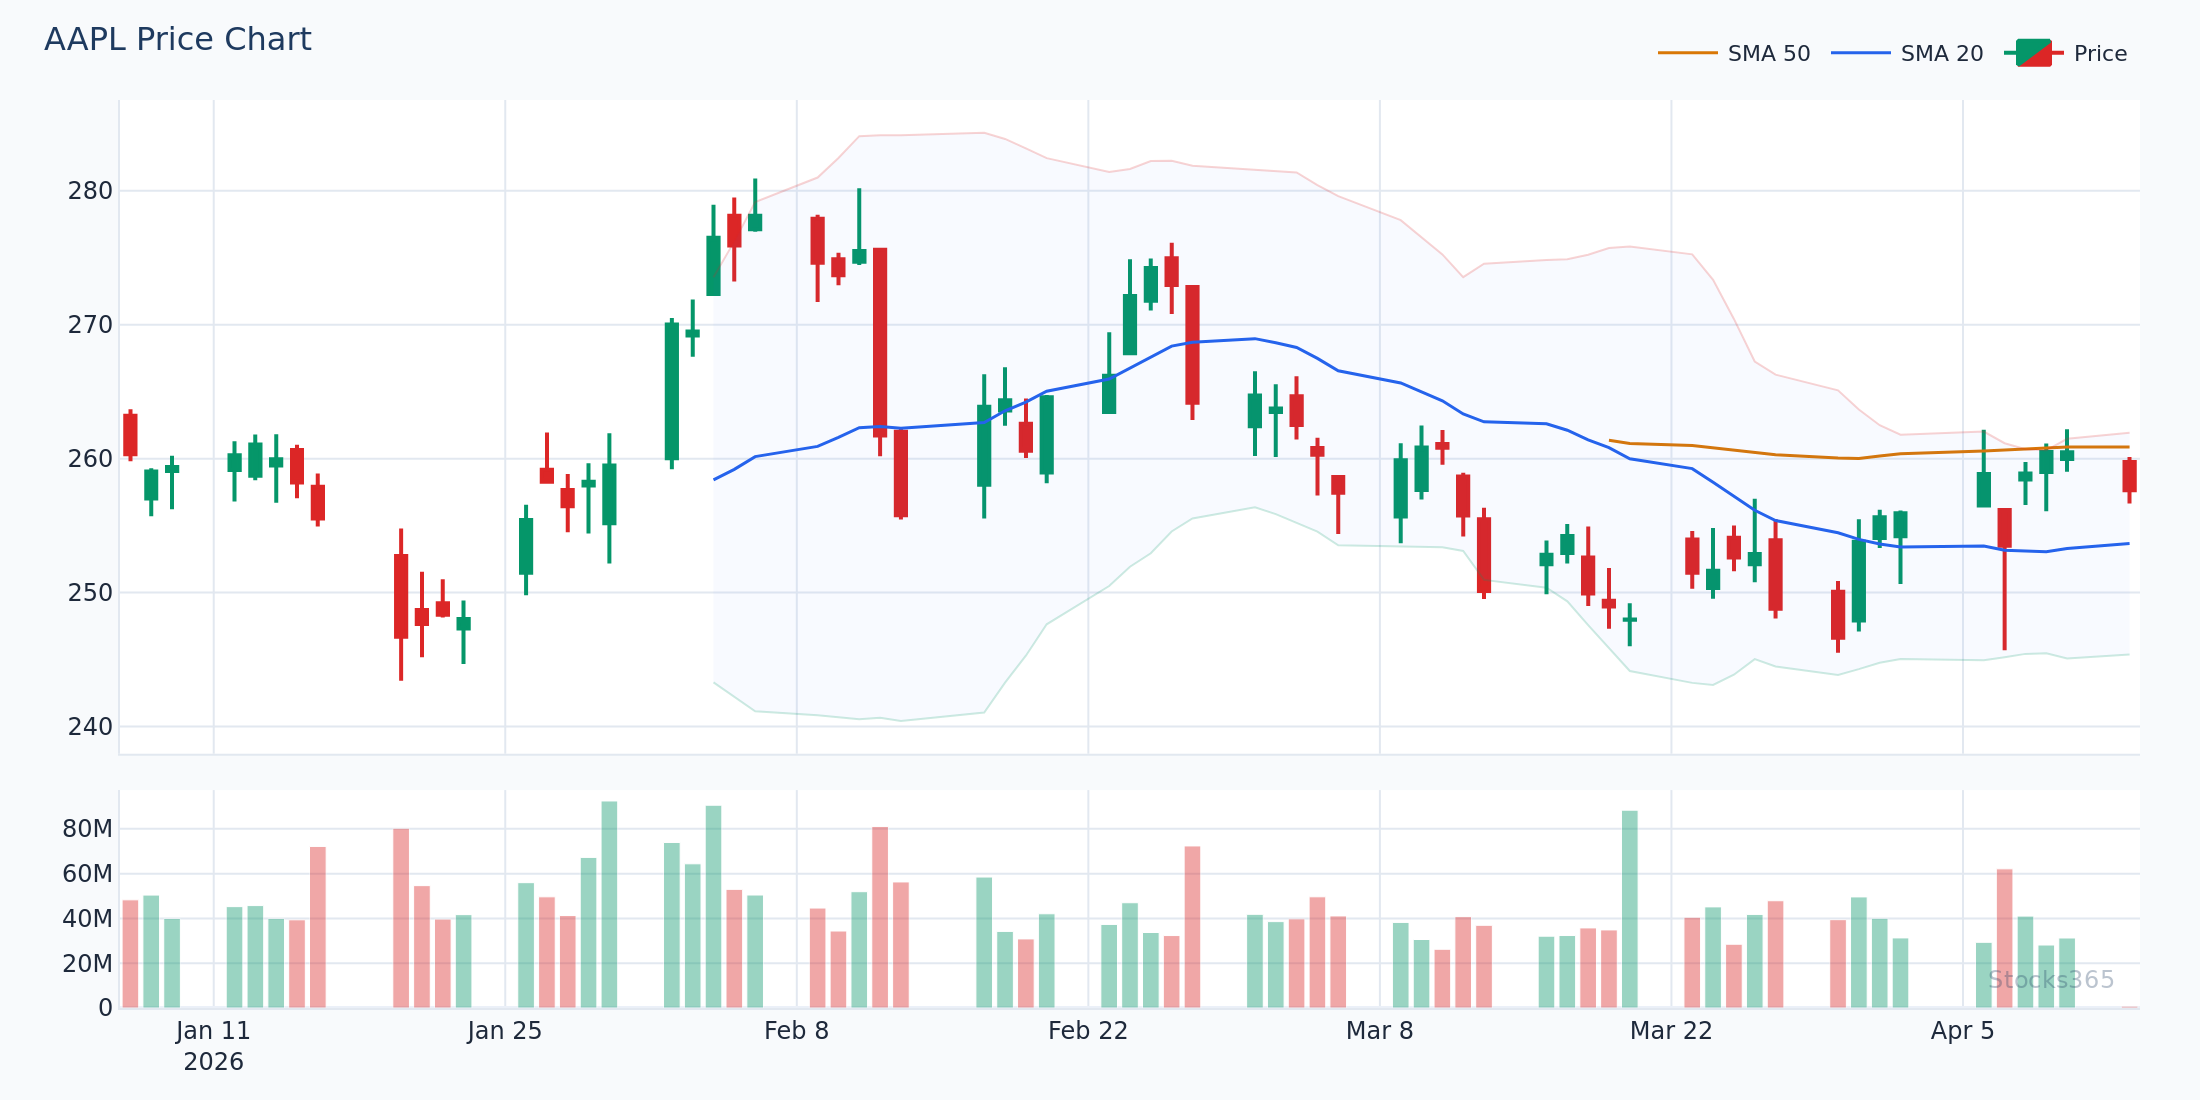
This setup on AAPL shows price tagging the lower Keltner Channel after a multi-day decline while the EMA midline slopes modestly upward — a classic mean reversion configuration. In trending markets, price touching the channel edge without closing outside it often leads to a bounce back toward the midline. The setup is invalidated if price closes convincingly below the lower channel on heavy volume, signaling trend continuation rather than reversion.
Standard Keltner Channel Settings
- Midline: 20-period EMA
- Channel width: 1.5x ATR (tighter) or 2x ATR (standard)
- ATR period: 10 or 14 (shorter = more reactive)
The Core Difference: Standard Deviation vs ATR
Here's the single most important distinction. Standard deviation is sensitive to outliers. ATR is not.
When a single massive candle fires — say, an earnings gap or a macro shock — Bollinger Bands explode wide in response. That spike in volatility is baked directly into the band calculation. Keltner Channels, using ATR, smooth over that spike. They widen, but far less dramatically.
This means Bollinger Bands are better at flagging volatility regime changes in real time. Keltner Channels are better at maintaining a stable reference frame during noisy, headline-driven markets.
"Think of Bollinger Bands as a heart rate monitor during a sprint. Keltner Channels are the resting heart rate baseline. Both are useful. The sprint monitor tells you something happened. The baseline tells you how unusual it really was."
The Squeeze Setup: Where Bollinger Bands and Keltner Channels Converge
The most powerful application of combining both indicators is the Bollinger-Keltner Squeeze. This is where the magic happens.
When Bollinger Bands compress inside Keltner Channels — meaning the BB upper band drops below the KC upper channel and the BB lower band rises above the KC lower channel — the market is in an unusually low volatility state. This divergence signals that a large move is loading.
The squeeze itself doesn't tell you direction. It tells you that energy is coiling. The breakout direction, ideally confirmed by momentum indicators like RSI or MACD, provides the directional bias.
If you want to pair this with RSI to gauge momentum before a squeeze breaks, the How to Use RSI in Trading: The Ultimate Step-by-Step Guide covers exactly how to calibrate RSI for breakout confirmation across different market regimes.
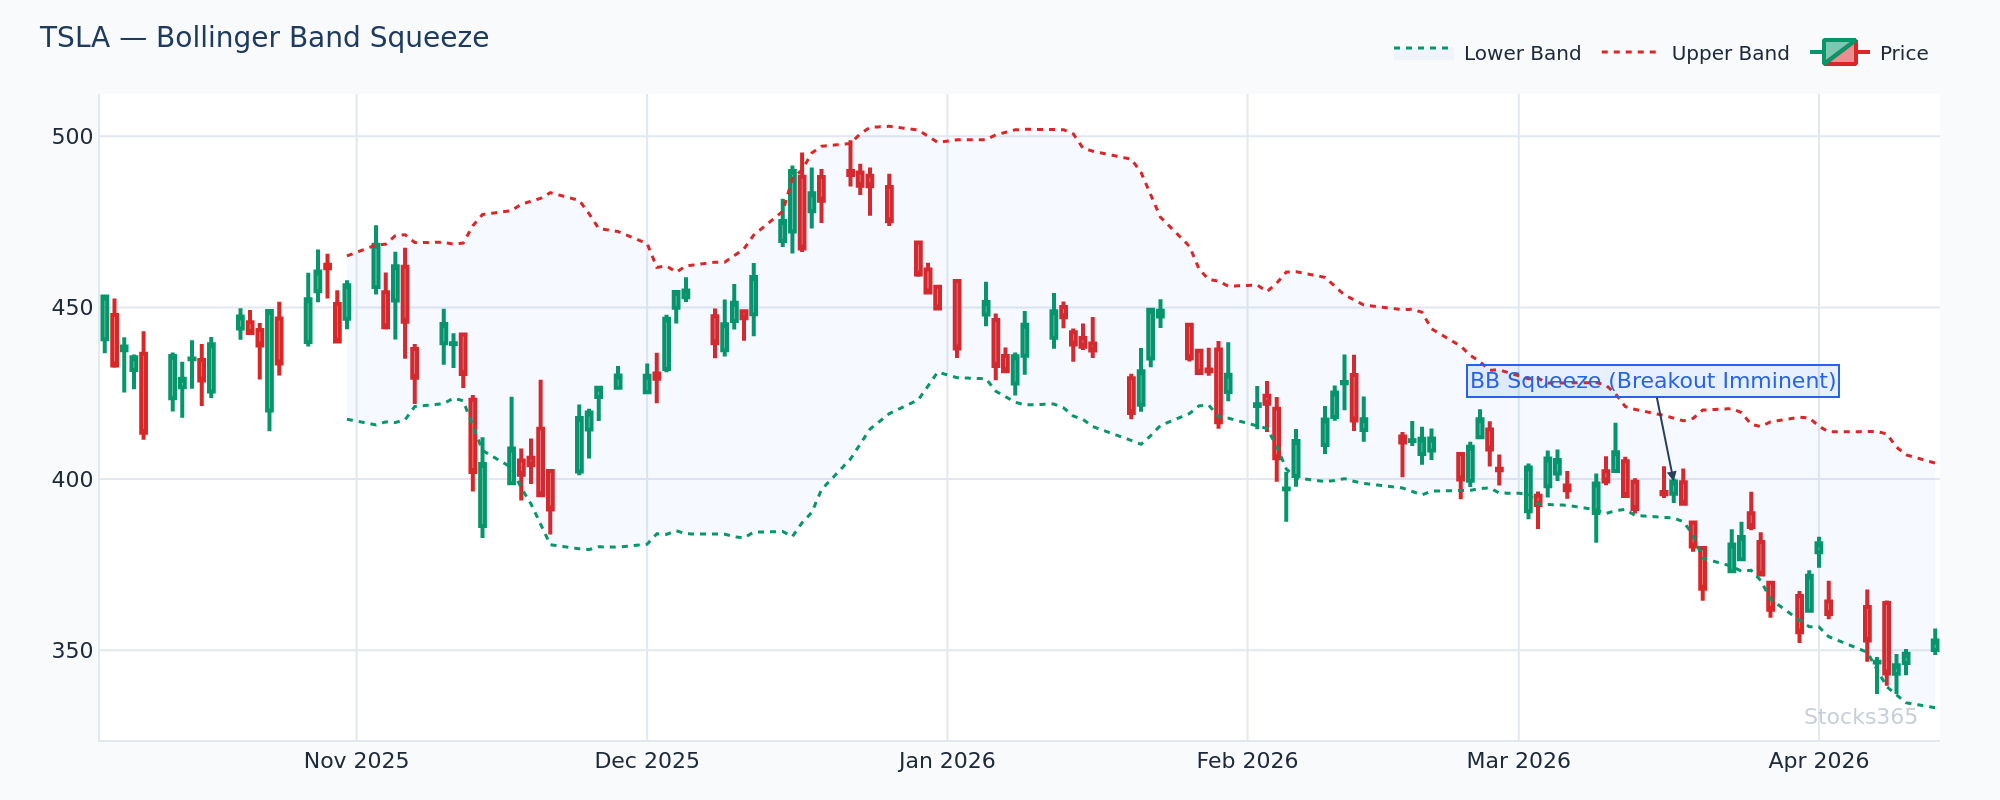
TSLA's chart here shows Bollinger Bands sitting entirely inside Keltner Channels — the textbook squeeze configuration. This compression pattern often precedes explosive directional moves. Watch for the moment BB expands back outside KC: that's the ignition point. A simultaneous RSI reading above 55 favors a bullish break; below 45 favors bearish continuation.
Here's What Most Traders Get Wrong
Most traders use Bollinger Band touches as automatic reversal signals. Price hits the upper band? They short it. Price hits the lower band? They buy it. In a strong trend, this is a losing strategy — and the data confirms it.
Our analysis of 3,278 Bollinger Upper Band touch signals across global instruments found a win rate of just 49.8% with a profit factor of 0.89 — meaning the average upper band touch trade loses money over a 10-day holding period. The edge flips dramatically on the lower band: 2,779 lower band touch signals produced a 57.8% win rate and a profit factor of 1.51. Commodities performed best at 60.5%, while stocks lagged at 56.7%. See the full dataset at Stocks365 Insights.
The lesson? Upper band touches in trending markets are continuation signals, not reversal signals. Lower band touches have genuine mean reversion edge — but upper band touches do not carry the same statistical weight. Trade them very differently.
When to Use Bollinger Bands
Bollinger Bands excel in specific conditions. Use them when:
- Volatility regimes are shifting. The expanding/contracting bands visually telegraph changes in market character before price confirms them.
- You're trading mean reversion. Particularly on the lower band in ranging markets (with the data-backed edge noted above).
- You're monitoring squeeze setups. The self-adjusting standard deviation calculation makes BB the more sensitive squeeze detector.
- Crypto and high-beta assets. Stocks365 research shows crypto performs best across BB signals, with the BB Squeeze Breakout producing a 51.7% win rate across 14,295 signals — its strongest asset class edge.
Bollinger Bands are less reliable in low-volatility grinding trends where price hugs one band for extended periods. In those environments, traders get chopped up trying to fade moves that never reverse.
When to Use Keltner Channels
Keltner Channels win in different scenarios:
- Trend identification. The EMA midline responds faster to trend changes. A consistent slope in one direction is more reliably captured by KC than BB.
- Low-noise trend trading. Because ATR smooths outliers, Keltner Channels give cleaner signals during orderly trending markets without spiking on news events.
- Confirming squeeze breakout direction. After a BB-KC squeeze fires, watch which Keltner Channel the price breaks toward — that channel often acts as the first target.
- Intraday trading. The EMA-based midline makes KC more responsive on short timeframes where SMA lags create problems.
Keltner Channels struggle when volatility is genuinely chaotic and ATR smoothing masks important real-time information. In those environments, BB's sensitivity is the edge.
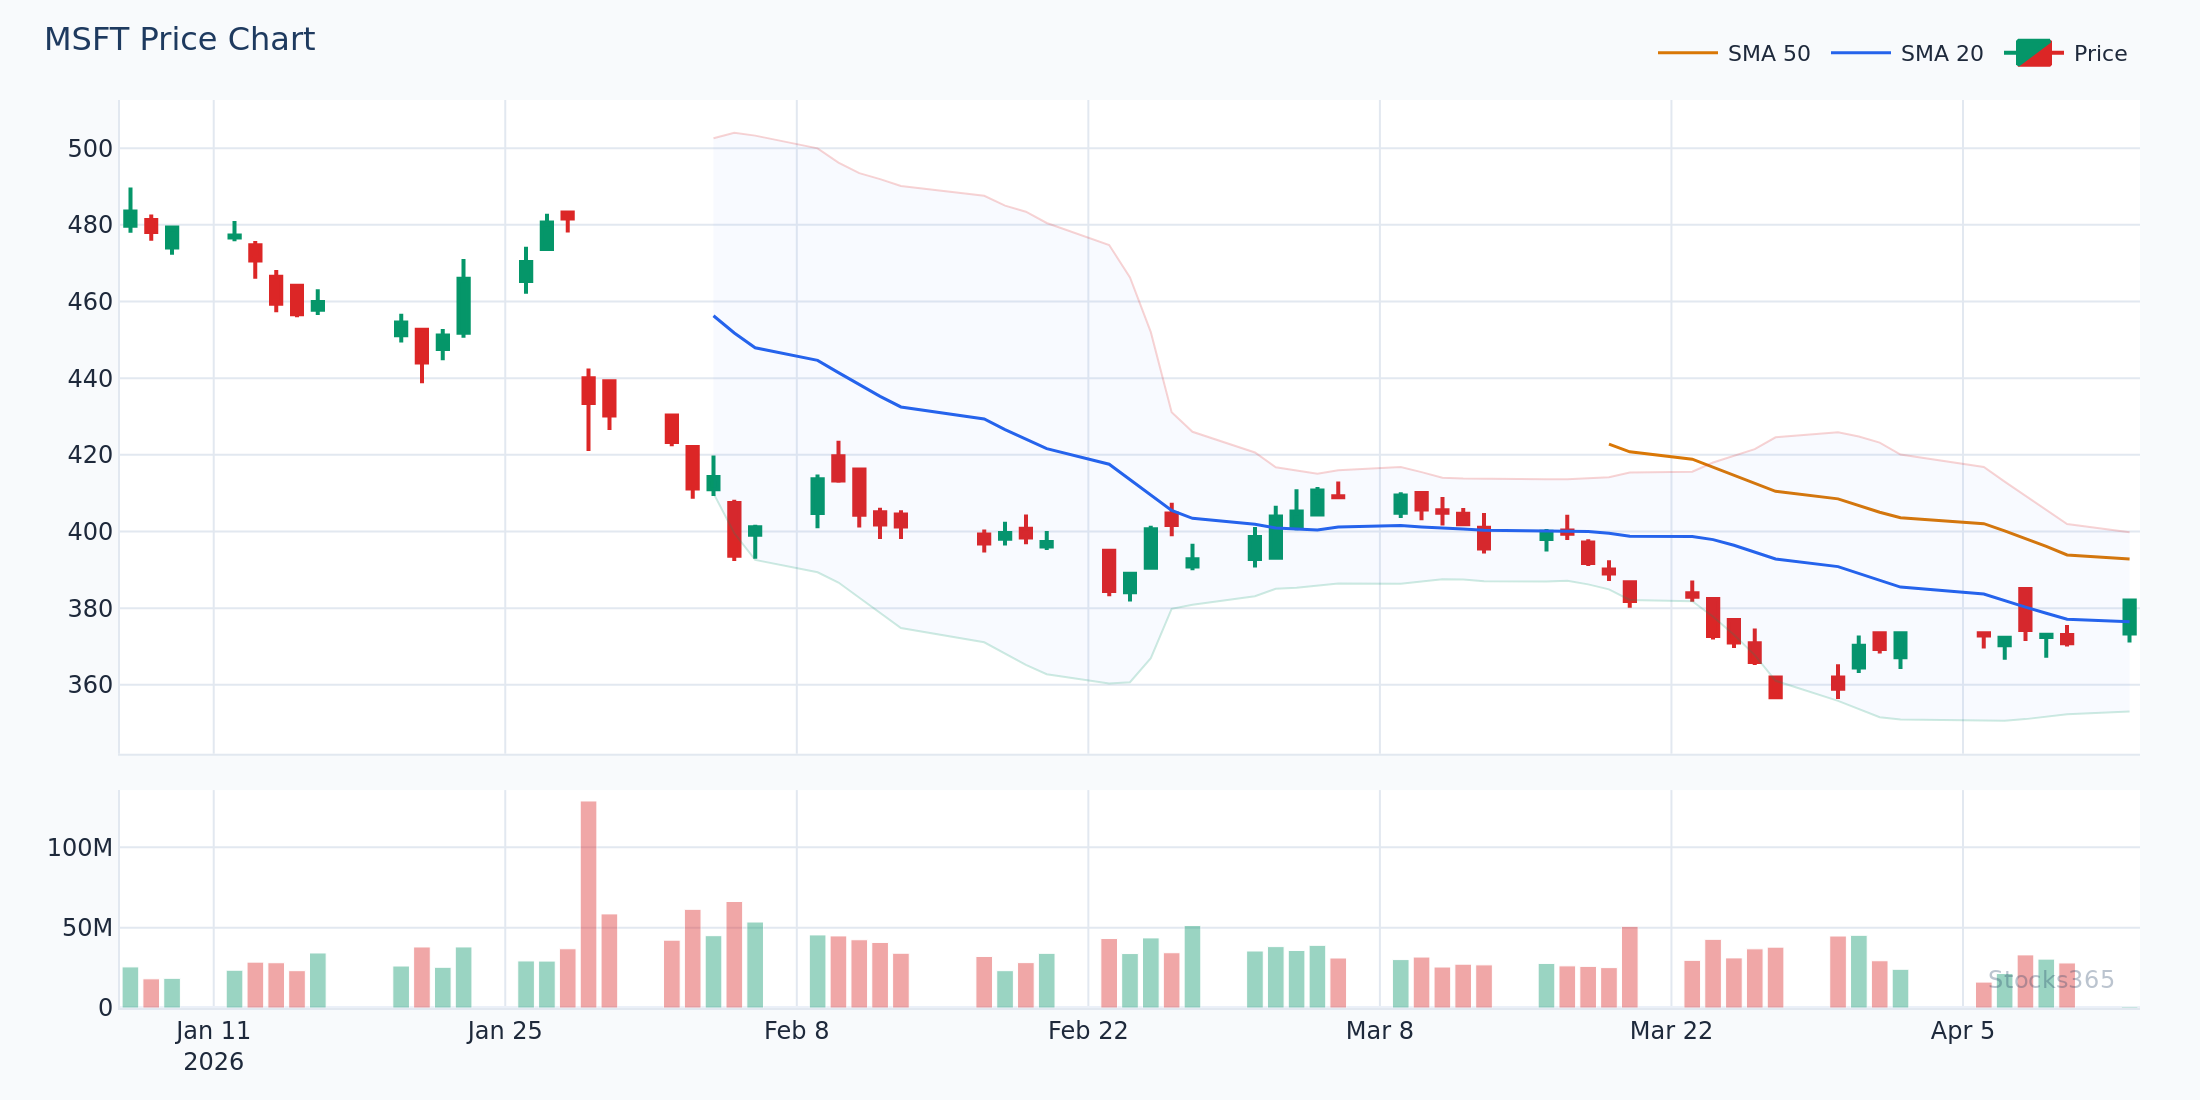
MSFT's chart shows price riding the upper Keltner Channel through an extended uptrend — a classic trend-following setup where the upper KC acts as a dynamic floor for pullbacks. Price touching the EMA midline during an uptrend and immediately bouncing is a high-probability long entry in this configuration. The setup breaks down if price closes below the EMA midline on strong volume, suggesting the trend has exhausted.
Bollinger Bands vs Keltner Channels: Direct Comparison
Volatility Measurement
Bollinger Bands: Standard deviation — highly sensitive, spikes on outliers.
Keltner Channels: ATR — smoothed, absorbs single-day extremes.
Moving Average Base
Bollinger Bands: 20-period SMA — slower to react.
Keltner Channels: 20-period EMA — faster, more trend-responsive.
Band Behavior in Trending Markets
Bollinger Bands: Can flatten or lag in slow trends. Upper band walk is common but confusing.
Keltner Channels: EMA midline slopes clearly with the trend. Channel structure stays more consistent.
Best Use Case
Bollinger Bands: Squeeze detection, mean reversion, volatility breakouts.
Keltner Channels: Trend identification, smoother trend-following, intraday setups.
Best Asset Classes
Bollinger Bands: Strong edge in crypto and volatile equities.
Keltner Channels: Effective across forex and commodities where trends tend to be more sustained.
Combining Both Indicators: The Practical Framework
The most sophisticated traders don't pick one. They use both together — each confirming what the other suggests.
Here's a simple two-step framework:
- Step 1 — Identify the regime with Keltner Channels. Is price trending (hugging one KC band) or ranging (oscillating between both channels)? The KC midline slope tells you the answer quickly.
- Step 2 — Time the entry with Bollinger Bands. In a trend, wait for BB to pull toward the midline during a consolidation. In a range, use BB band touches for mean reversion entries with the data-backed lower band edge.
Add RSI as the momentum filter. For a complete breakdown of RSI settings that complement this framework, see RSI Settings: Master the Best Period for Your Strategy — particularly the section on period selection for different volatility environments.
You can also look for hidden RSI divergence at Keltner Channel midline tests in established trends — this combination identifies pullback entries with high confluence.
Real-World Setup Examples
Setup 1: The Squeeze Breakout with Momentum Confirmation
- Bollinger Bands compress inside Keltner Channels (the squeeze is active)
- Price coils in a tight range for 5+ sessions
- RSI climbs above 55 during the coil (bullish bias building)
- Price closes above the upper Bollinger Band on above-average volume
- Entry on the next open, stop below the squeeze range low
Setup 2: Lower Bollinger Band Mean Reversion in a Range
- Keltner Channel midline is flat — price is in a range, not a trend
- Price drops to the lower Bollinger Band
- RSI reaches oversold territory (check RSI overbought and oversold levels for context)
- A bullish reversal candle (hammer, engulfing) forms at the band
- Entry on confirmation, target the BB midline, stop below the band low
Setup 3: Keltner Channel Trend Continuation Pullback
- Price is riding the upper Keltner Channel — clear uptrend
- Bollinger Bands pull in as price consolidates near the KC midline
- RSI pulls back toward 50 without crossing below it
- Price reclaims the upper half of the KC channel
- Entry on the reclaim, stop below the KC midline
For deeper reading on how RSI divergence enhances these setups, see RSI Divergence Explained: Master Bullish & Bearish Signals.
What to Watch For
- Bollinger-Keltner squeeze on tech stocks: When BB compresses entirely inside KC with band width at multi-week lows, the next expansion typically produces a 2–3 ATR directional move. Watch which KC band price breaks toward for directional bias — and confirm with RSI above or below 50.
- Lower Bollinger Band touches in commodity markets: Stocks365 data shows commodities produce the strongest mean reversion edge on lower BB touches (60.5% win rate). Look for confluence with a flat-to-upward Keltner Channel midline slope before entering.
- Keltner Channel midline reclaims after pullbacks: In strong uptrends, price pulling back to the KC EMA midline and then closing back above it on expanding volume is one of the cleaner trend continuation signals — particularly effective on large-cap equities.
- Bollinger Band upper walk in strong crypto trends: When crypto assets begin walking the upper Bollinger Band session after session, this is a continuation signal, not a reversal. Wait for price to close back inside the band before considering a mean reversion trade.
- Diverging band behavior before earnings or macro events: If Bollinger Bands are widening while Keltner Channels remain flat, a single volatile session drove the BB expansion — not a genuine volatility regime change. Be cautious treating that spike as a true breakout signal.
How Stocks365 Uses This
The Stocks365 trust score system aggregates signals from 12+ technical and fundamental indicators to rank the reliability of any given trade signal. Both Bollinger Band and Keltner Channel readings contribute to the volatility regime scoring layer of this system.
When Bollinger Bands are in a confirmed squeeze inside Keltner Channels, the platform's volatility score flags the instrument as a breakout candidate — increasing signal weight for momentum-based indicators in that regime. Conversely, when BB and KC are both widening simultaneously, the trust score system down-weights mean reversion signals and increases weight on trend-continuation setups.
This adaptive weighting means the Stocks365 signals dashboard doesn't treat all band touches equally. A lower BB touch during a confirmed KC range environment gets significantly higher trust scoring than the same touch during a widening-band, trending market — reflecting the real statistical edge differences between those two scenarios. You can explore individual instrument signal profiles at pages like AAPL signals.
Key Takeaways
- Bollinger Bands use standard deviation — highly sensitive to volatility spikes, best for squeeze detection and mean reversion.
- Keltner Channels use ATR and EMA — smoother, better for trend identification and intraday structure.
- Upper BB touches carry no statistical mean reversion edge (win rate: 49.8%, profit factor: 0.89). Trade upper band touches as continuation signals in trends.
- Lower BB touches have genuine edge (win rate: 57.8%, profit factor: 1.51) — particularly in commodities and ranging markets.
- The Bollinger-Keltner Squeeze (BB inside KC) is one of the most reliable low-volatility precursor patterns across all asset classes.
- Use KC for regime identification, BB for entry timing, and RSI as the momentum filter.
- Crypto assets show the strongest edge on BB squeeze breakouts (51.7% win rate across 14,295 signals).