
Bollinger Bands vs Moving Averages: Understanding the Core Difference
Two tools. One chart. Completely different jobs.
Bollinger Bands and moving averages are both price-based indicators, and they both appear as lines overlaid on a candlestick chart. But they answer fundamentally different questions. Moving averages tell you where price has been trending. Bollinger Bands tell you how volatile that trend is — and whether price is stretched too far from the mean.
Confusing the two is one of the most common mistakes in technical analysis. And it costs traders real money.
What Is a Moving Average?
A moving average (MA) smooths out price data over a defined period. The 20-period simple moving average (SMA), for example, calculates the average closing price over the last 20 candles and plots it as a continuous line. As new candles form, the oldest data drops off and the line shifts forward.
There are two main types used by active traders:
- Simple Moving Average (SMA): Equal weighting across all periods. Clean, stable, widely followed.
- Exponential Moving Average (EMA): More weight on recent prices. Reacts faster to price changes. Preferred by momentum traders.
Moving averages excel at identifying trend direction, dynamic support and resistance levels, and crossover signals between a fast and slow MA. The 20 SMA, 50 SMA, and 200 SMA are the most tracked levels across institutional and retail desks alike.
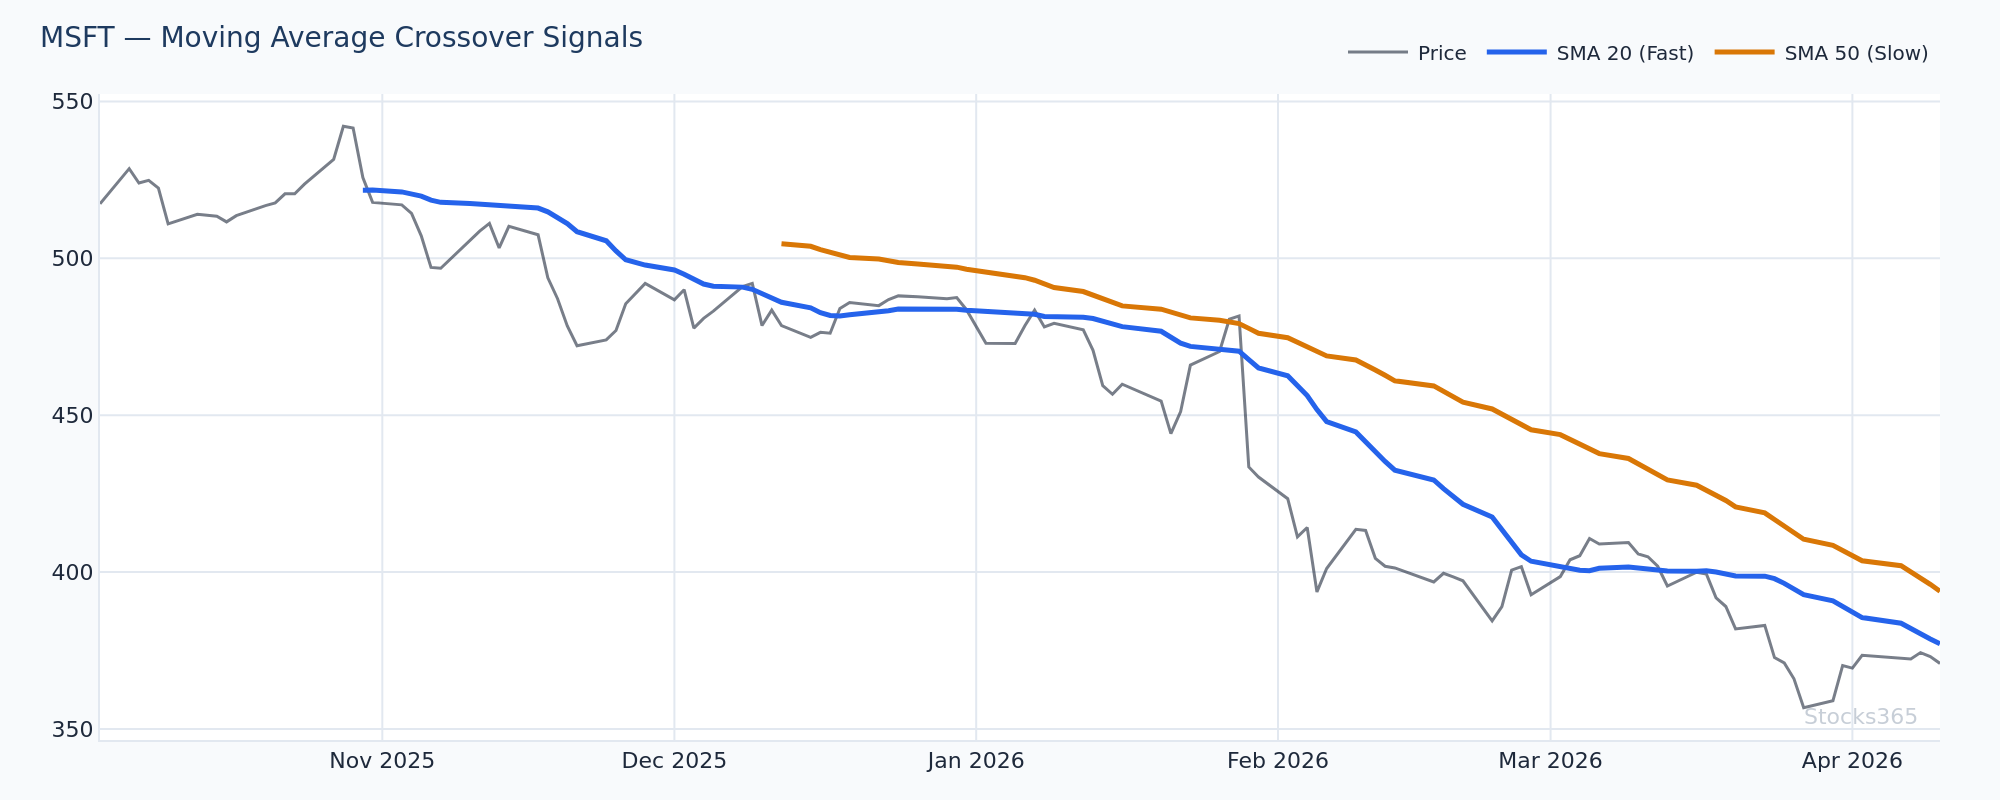
This chart shows price crossing above the 20-SMA after a period of compression below it. When the 50-SMA slopes upward and price reclaims the 20-SMA from below, this typically signals the early stage of a new trend leg. The setup is invalidated if price closes back below the 20-SMA on strong volume within the next two to three sessions.
What Are Bollinger Bands?
Bollinger Bands, developed by John Bollinger in the 1980s, consist of three components built around a moving average — typically a 20-period SMA:
- Middle Band: The 20-period SMA itself
- Upper Band: Middle Band + (2 × standard deviation of price)
- Lower Band: Middle Band − (2 × standard deviation of price)
The bands expand when volatility increases and contract when volatility decreases. That dynamic width is the entire point. Unlike a moving average, Bollinger Bands are a volatility envelope — they tell you not just where price is relative to a trend, but whether the current price move is statistically extreme.
Approximately 95% of price action falls within the bands under normal conditions. When price touches or breaks through the upper or lower band, it's a statistically significant event — not just a trend signal.
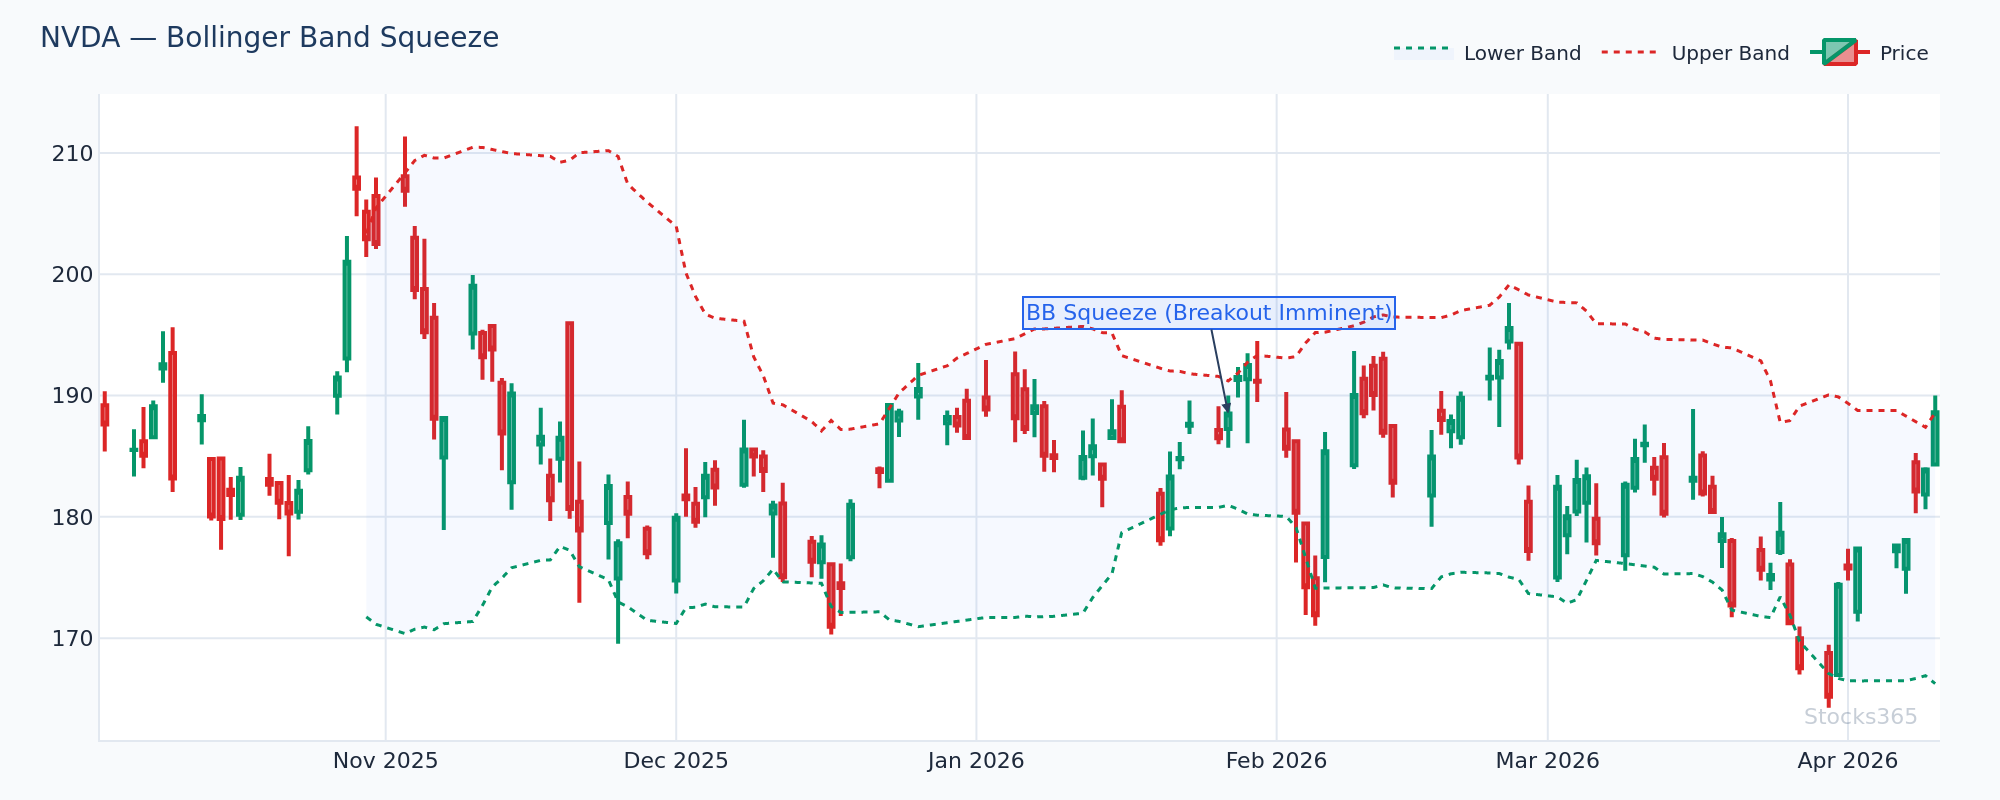
This chart illustrates a Bollinger squeeze — a period where the bands narrow sharply as volatility collapses. This compression often precedes explosive directional moves. The breakout direction is confirmed when price closes outside the band with volume surging above the 20-period average. A failed breakout — where price closes back inside the band within one or two candles — is a powerful fade signal.
Bollinger Bands vs Moving Averages: The 5 Key Differences
1. Static vs Dynamic Width
A moving average is a single line. It has no width. Bollinger Bands are a channel whose width changes constantly based on recent volatility. This is the most fundamental structural difference. Moving averages give you a single price reference point; Bollinger Bands give you a probability range.
2. Trend Following vs Mean Reversion
Moving averages are trend-following tools. They lag price by design. The signal comes after a trend is already developing. Bollinger Bands are primarily mean-reversion tools. Price touching the upper band doesn't mean "buy more momentum" — it often signals overextension. The default assumption is that price reverts to the middle band.
That said, in strong trends, price can walk the upper or lower band for extended periods. Context always matters.
3. Volatility Measurement
Moving averages contain zero volatility information. A 20-SMA looks identical whether the market is calm or in a volatility explosion. Bollinger Bands expand and contract in real time, giving traders an immediate visual read on market volatility regime. A tight squeeze signals low volatility. Wide bands signal high volatility. This information alone changes how you size positions and set stops.
4. Signal Generation
Moving average signals are primarily generated by:
- Price crossing above or below the MA line
- Fast MA crossing above/below a slow MA (golden cross, death cross)
- The slope of the MA changing direction
Bollinger Band signals are generated by:
- Price touching or breaching the upper or lower band (overextension)
- Band width narrowing to a squeeze (volatility contraction)
- Band expansion after a squeeze (volatility expansion / breakout)
- Price failing to reach the band on a new high or low (momentum divergence)
5. Best Market Conditions
Moving averages perform best in trending markets. In choppy, sideways conditions, MA crossovers generate whipsaw after whipsaw. Bollinger Bands perform best in range-bound or transitioning markets — where mean reversion is the dominant dynamic or where a volatility breakout is about to occur. Neither tool works well in all conditions, which is why combining them is often more powerful than using either alone.
The Performance Reality: What the Data Shows
Here's what most traders get wrong: they treat a Bollinger Band upper touch as a sell signal — automatically, every time. In reality, price touching the upper band in a strong uptrend is just price doing what it's supposed to do. The edge isn't the band touch itself. The edge is watching whether price closes back inside the band on the next candle. That re-entry is the actual reversion signal.
Our analysis of 3,278 Bollinger Upper Band touch signals found a 49.8% win rate over a 10-day holding period (profit factor: 0.89). On its own, that's marginally below breakeven — hardly a reliable standalone signal. But the asset-class split reveals something useful: crypto led with a 56.8% win rate on upper band touches, while commodities lagged at 42.0%. Context and asset class matter enormously when applying band signals. Explore the full dataset at Stocks365 Insights.
Similarly, a simple price-crosses-above-20-SMA signal, tested across 3,317 signals, produced a 47.9% win rate overall — but stocks hit 52.3% while crypto lagged at 36.1%. The SMA cross works better on equities with smoother trend behavior, while crypto's volatility erodes its edge significantly.
The takeaway is simple: neither signal is a magic bullet. Both become more powerful when filtered by context.
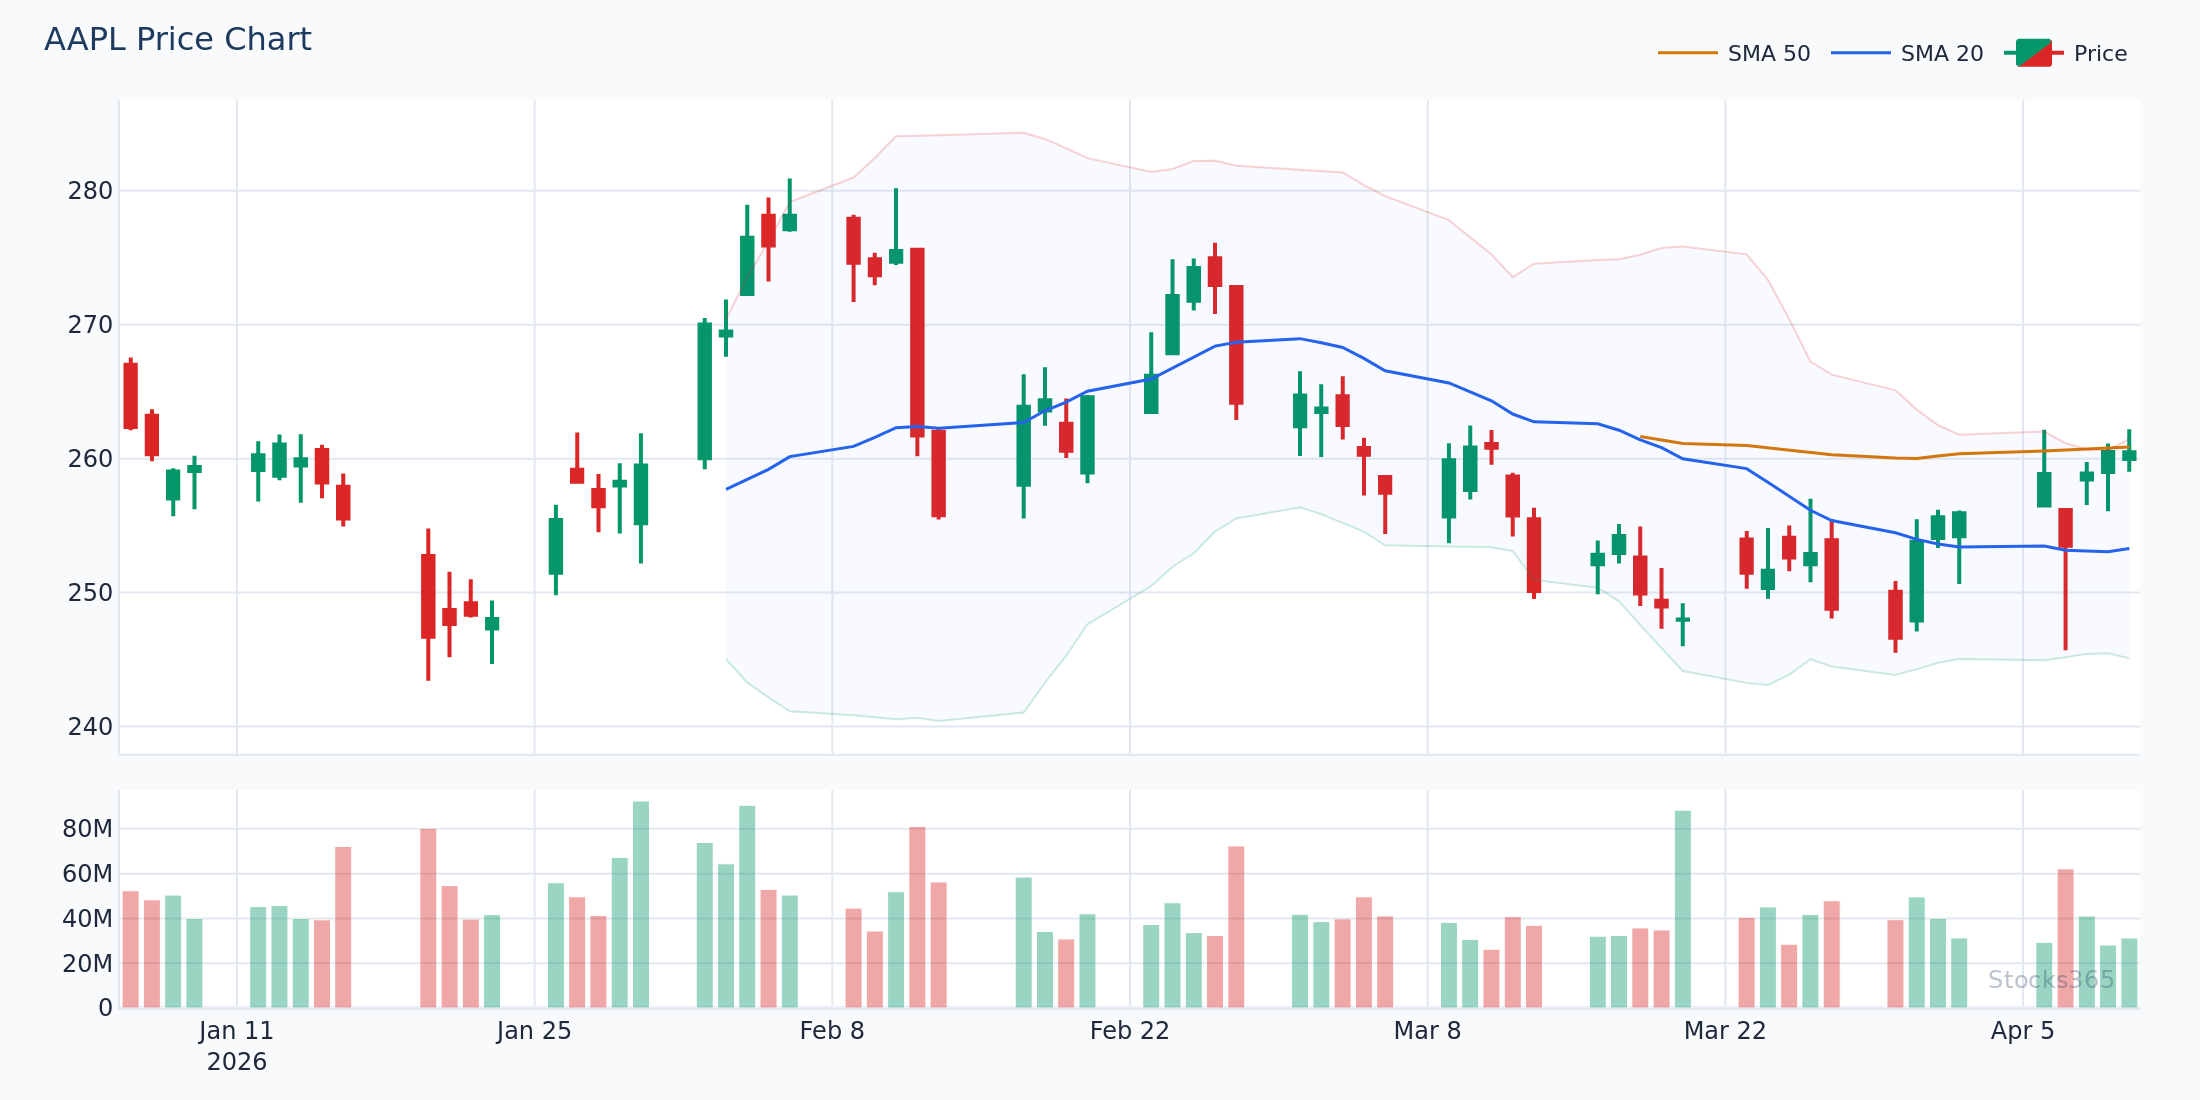
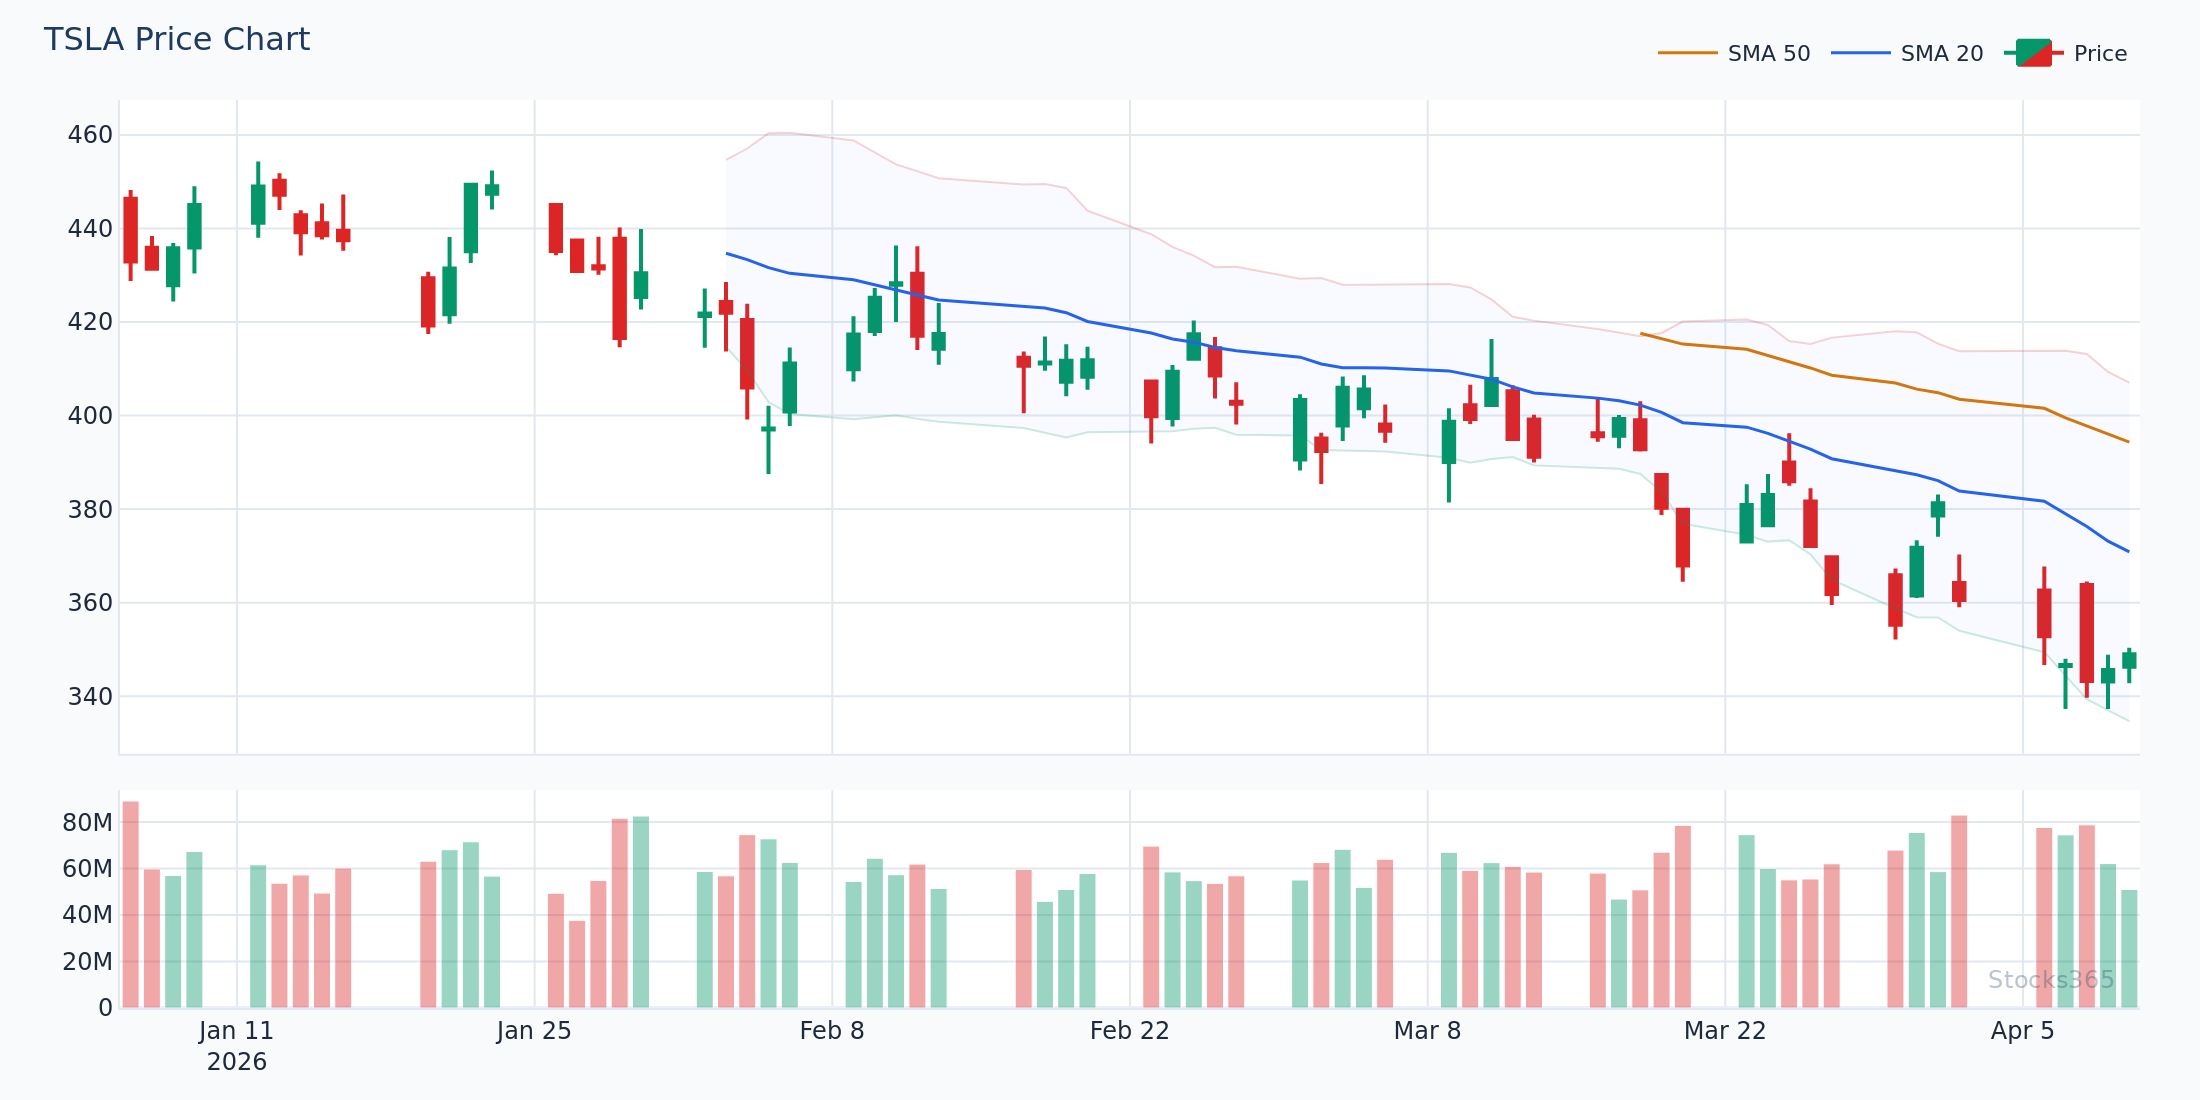
This overlay shows both the 20-SMA (middle band) and the Bollinger Band envelope on the same chart. Notice how band width narrows during consolidation phases and price oscillates around the middle band. When the bands expand sharply and price breaks the upper band with momentum, the middle band becomes the first logical target on any pullback. A close back below the 20-SMA after an upper band breakout often marks the end of that leg.
When to Use Bollinger Bands Instead of Moving Averages
Use Bollinger Bands when you need volatility context — not just trend direction. Specific situations where Bollinger Bands add clear value over a plain moving average:
- Pre-earnings compression: Stocks often show a Bollinger squeeze before major earnings announcements. The bands narrow as the market waits. The post-earnings expansion is violent. The squeeze tells you a move is coming; the direction tells you which side to trade.
- Range trading: In a defined range, fade upper band touches with confirmation (bearish candle pattern, RSI divergence) and buy lower band touches with momentum confirmation.
- Volatility regime identification: When bands are historically narrow, expect expansion. When bands are historically wide, expect contraction. This alone informs position sizing decisions.
- Breakout validation: A breakout that occurs when bands are wide (already expanding) has less statistical significance than one that breaks out of a squeeze.
When to Use Moving Averages Instead of Bollinger Bands
Moving averages are cleaner in trending markets. Use them when:
- Identifying macro trend direction: The 200-SMA slope tells you whether you're in a bull or bear regime. No standard deviation needed.
- Dynamic support/resistance: The 20-EMA and 50-SMA act as bounce zones in trending stocks. Price pulling back to the 20-EMA in an uptrend and holding is a textbook continuation entry.
- Momentum confirmation: When a fast MA (like the 10-EMA) crosses above a slow MA (50-SMA), it confirms trend acceleration — useful for momentum strategies.
- Multi-timeframe alignment: Price above the 20-SMA on the daily, above the 50-SMA on the weekly — that alignment strengthens any long thesis considerably.
Combining Bollinger Bands and Moving Averages: Practical Setups
The real edge comes from using both together. Not because more indicators are better — they're not — but because these two tools measure different things. Used together, they create a more complete picture.
Setup 1: The Band Squeeze + SMA Reclaim
Look for a Bollinger squeeze (band width at or below the 20th percentile for the instrument) while price trades near the 20-SMA. When price breaks above the upper band and simultaneously reclaims the 50-SMA, you have a volatility expansion signal confirmed by trend structure. Volume surging above 1.5× the 20-day average strengthens the setup further.
Setup 2: Moving Average Slope + Band Walk
In a strong uptrend — defined as price above a rising 50-SMA — price can "walk the upper band" for several candles. Each candle closes near or above the upper band while the 20-SMA slopes upward. This is not a sell signal. The setup turns bearish when price closes back inside the band while the 20-SMA begins to flatten. That's the exhaustion tell.
Setup 3: Lower Band Touch + 200-SMA Confluence
When price touches the lower Bollinger Band at the same level as a rising 200-SMA, you have a mean-reversion opportunity with macro trend support beneath it. Add a bullish RSI signal — such as RSI recovering from oversold territory — and the setup becomes high-conviction. For deeper context on RSI signals that complement this setup, see our guide on RSI overbought and oversold levels.
This chart highlights a lower band touch occurring at or near the 200-SMA level, a classic confluence zone for mean-reversion entries. The setup is confirmed when the next candle closes above the lower band with bullish structure (long lower wick, or a full-bodied green candle). It's invalidated if price closes below the 200-SMA on increasing volume, signaling a regime breakdown rather than a reversion.
Pairing With RSI for Better Confirmation
Both Bollinger Bands and moving averages are price-based. Adding a momentum oscillator like RSI creates a genuinely different data dimension — momentum versus price structure. This is where multi-indicator strategies become legitimate rather than redundant.
When price touches the upper Bollinger Band and RSI shows bearish divergence — price makes a higher high but RSI makes a lower high — the odds of mean reversion increase significantly. For a deep dive into that specific signal, read our article on RSI divergence explained.
Similarly, a moving average crossover gains conviction when RSI confirms momentum. A 20-EMA crossing above the 50-SMA while RSI crosses above 50 from below is a much cleaner setup than the MA cross alone. If you're new to RSI and want to understand the mechanics before combining it, start with what RSI is and how it works.
For traders who want to go further, understanding hidden RSI divergence adds another layer — catching trend continuation setups that most traders miss entirely.
Common Mistakes When Choosing Between These Indicators
Wrong tool. Wrong market. Guaranteed losses.
Using a moving average crossover strategy in a choppy, low-trend market will generate endless whipsaw trades. The SMA doesn't know the market is ranging — it just fires signals. Similarly, applying Bollinger Band mean-reversion logic during a trending breakout leads traders to fade moves that keep running for weeks.
The fix is regime awareness. Before applying either tool, identify whether the market is trending or ranging. ATR (Average True Range) expanding signals a trending regime. ATR contracting signals consolidation. Bollinger Band width itself is a volatility regime indicator — use it to determine which strategy context you're operating in before generating any signal.
One more mistake: treating the middle band (20-SMA within Bollinger Bands) as the same signal as a standalone 20-SMA. They're the same calculation, but the context is different. Within the Bollinger Band framework, the middle band is a mean-reversion target. As a standalone MA, it's a trend reference. The interpretation depends on how you're framing the analysis.
For a related comparison of how two momentum indicators stack up against each other, our guide on RSI vs Stochastic Oscillator walks through similar trade-offs.
What to Watch For
- Bollinger squeeze setups on individual equities: When band width drops below the 20th percentile for a given stock's 52-week range, the next expansion typically produces a 2–3 ATR move. The direction of the first close outside the band after the squeeze sets the trade bias.
- 20-SMA reclaim after a pullback in uptrending markets: When a stock in a defined uptrend (price above rising 50-SMA and 200-SMA) pulls back to the 20-SMA and closes back above it on rising volume, this is a high-probability continuation setup — especially in large-cap tech stocks.
- Upper band touches in crypto with RSI below 60: Upper band touches in crypto where RSI has not yet reached overbought territory often signal trend continuation rather than reversion — the band is expanding with the move, not acting as resistance.
- Band width divergence on multi-timeframe setups: When daily bands are squeezing but weekly bands are expanding, the daily compression is a coil within a larger trend. These setups often produce the cleanest directional breakouts.
- Lower band tag + 200-SMA confluence on pullbacks: In stocks with strong fundamental backing and an established uptrend, this confluence zone has historically been a reliable long entry when confirmed by a momentum indicator turning up from oversold.
How Stocks365 Uses This
Stocks365 integrates both Bollinger Band signals and moving average data into its Trust Score system, which aggregates 12+ technical indicators into a single confidence rating for each signal generated on the platform.
Bollinger Band width contributes directly to the volatility regime component of the Trust Score — a tight squeeze increases the volatility alert weighting, flagging that a breakout scenario is building. Moving average alignment (price relative to 20, 50, and 200 SMAs across multiple timeframes) feeds into the trend agreement component, measuring how many timeframes are in directional consensus.
When a signal fires on a stock like AAPL and both the band setup and MA alignment agree, the Trust Score reflects that multi-indicator confluence with a higher rating. Signals without MA and band agreement receive lower Trust Scores — flagging them as lower-conviction setups that require additional confirmation before acting. You can see these signals in real time on the Stocks365 dashboard.
Key Takeaways
- Moving averages = trend direction. They identify where price is trending but contain no volatility information.
- Bollinger Bands = volatility envelope. They show whether price is statistically overextended from its mean, and whether the market is in a high or low volatility regime.
- Neither is universally better. Moving averages outperform in trending markets; Bollinger Bands shine in ranging or transitioning markets.
- The middle Bollinger Band is a 20-SMA — but its role is different depending on whether you're using it as a trend tool or a mean-reversion target.
- Data confirms both signals hover near coin-flip odds in isolation. The edge comes from confluence — combining band setups, MA alignment, and momentum indicators like RSI.
- Asset class matters. Bollinger Band signals work better in crypto; SMA cross signals work better in equities. Apply accordingly.
- Stocks365 combines both into its Trust Score system — volatility regime from band width, trend agreement from MA alignment — to produce higher-confidence signal ratings.