
Why Learning How to Calculate Moving Averages by Hand Still Matters
Every serious trader uses moving averages. But most traders let their platform do all the work — and never understand what the number actually means. That's a problem.
When you know how to calculate a moving average by hand, you stop treating it like a black box. You understand why the line reacts the way it does. You spot nuances that casual traders miss entirely.
This guide walks you through every major moving average type — Simple, Exponential, and Weighted — with clean step-by-step calculations, real trading context, and practical setups to apply immediately.
Bottom line: Understanding the math behind your indicators makes you a sharper, more confident trader. Let's build that foundation.
The Three Main Types of Moving Averages
Before calculating anything, know what you're working with. There are three moving average types used widely in trading:
- Simple Moving Average (SMA) — Equal weight to every data point in the period
- Exponential Moving Average (EMA) — More weight on recent prices, faster to react
- Weighted Moving Average (WMA) — Linear weights, most weight on the latest price
Each has a different formula. Each behaves differently on a chart. Choose the wrong one for your strategy and you'll get late signals — or false ones.
How to Calculate a Simple Moving Average (SMA)
The SMA is the easiest to calculate. It's just an average of closing prices over a set number of periods.
SMA Formula
SMA = (Sum of closing prices over N periods) ÷ N
Step-by-Step SMA Calculation Example
Let's calculate a 5-day SMA using a sequence of closing prices:
- Day 1: 42
- Day 2: 44
- Day 3: 43
- Day 4: 46
- Day 5: 45
Step 1: Add all five closing prices: 42 + 44 + 43 + 46 + 45 = 220
Step 2: Divide by the number of periods: 220 ÷ 5 = 44.0
Your 5-day SMA is 44.0. On Day 6, you drop Day 1 and add Day 6's close. That's the "rolling" part.
The Rolling Nature of an SMA
Say Day 6 closes at 48. Your new 5-day SMA uses Days 2–6:
44 + 43 + 46 + 45 + 48 = 226 ÷ 5 = 45.2
The average shifts forward one day at a time — always using exactly N periods. Simple. Clean. But slow.
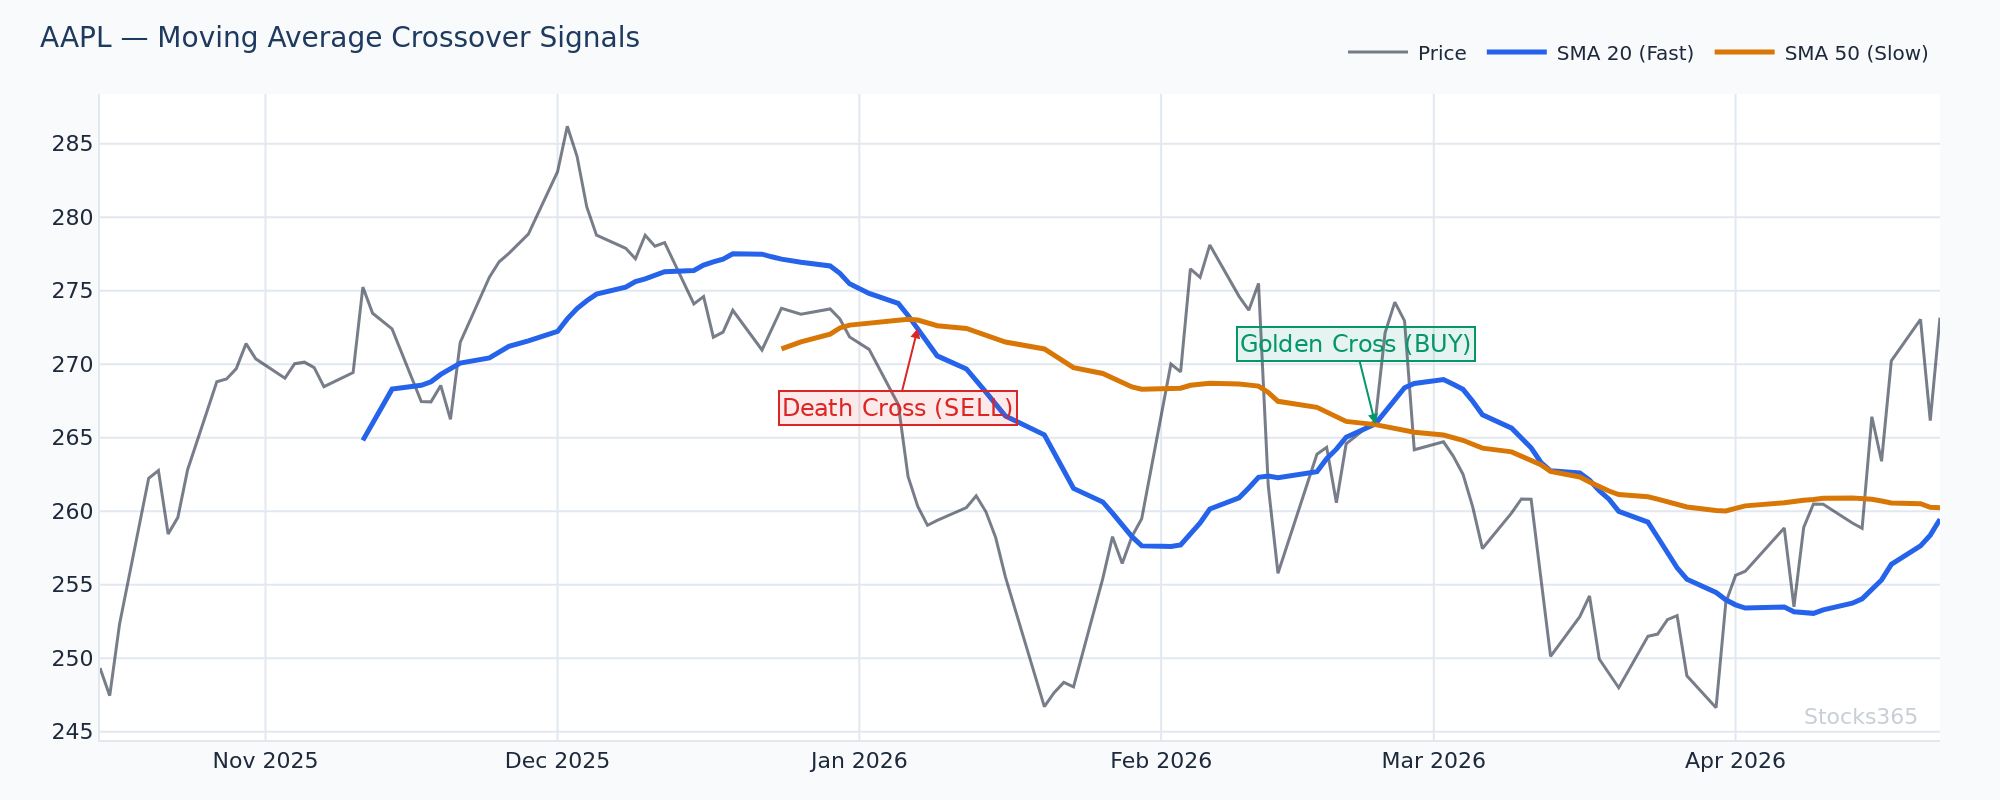
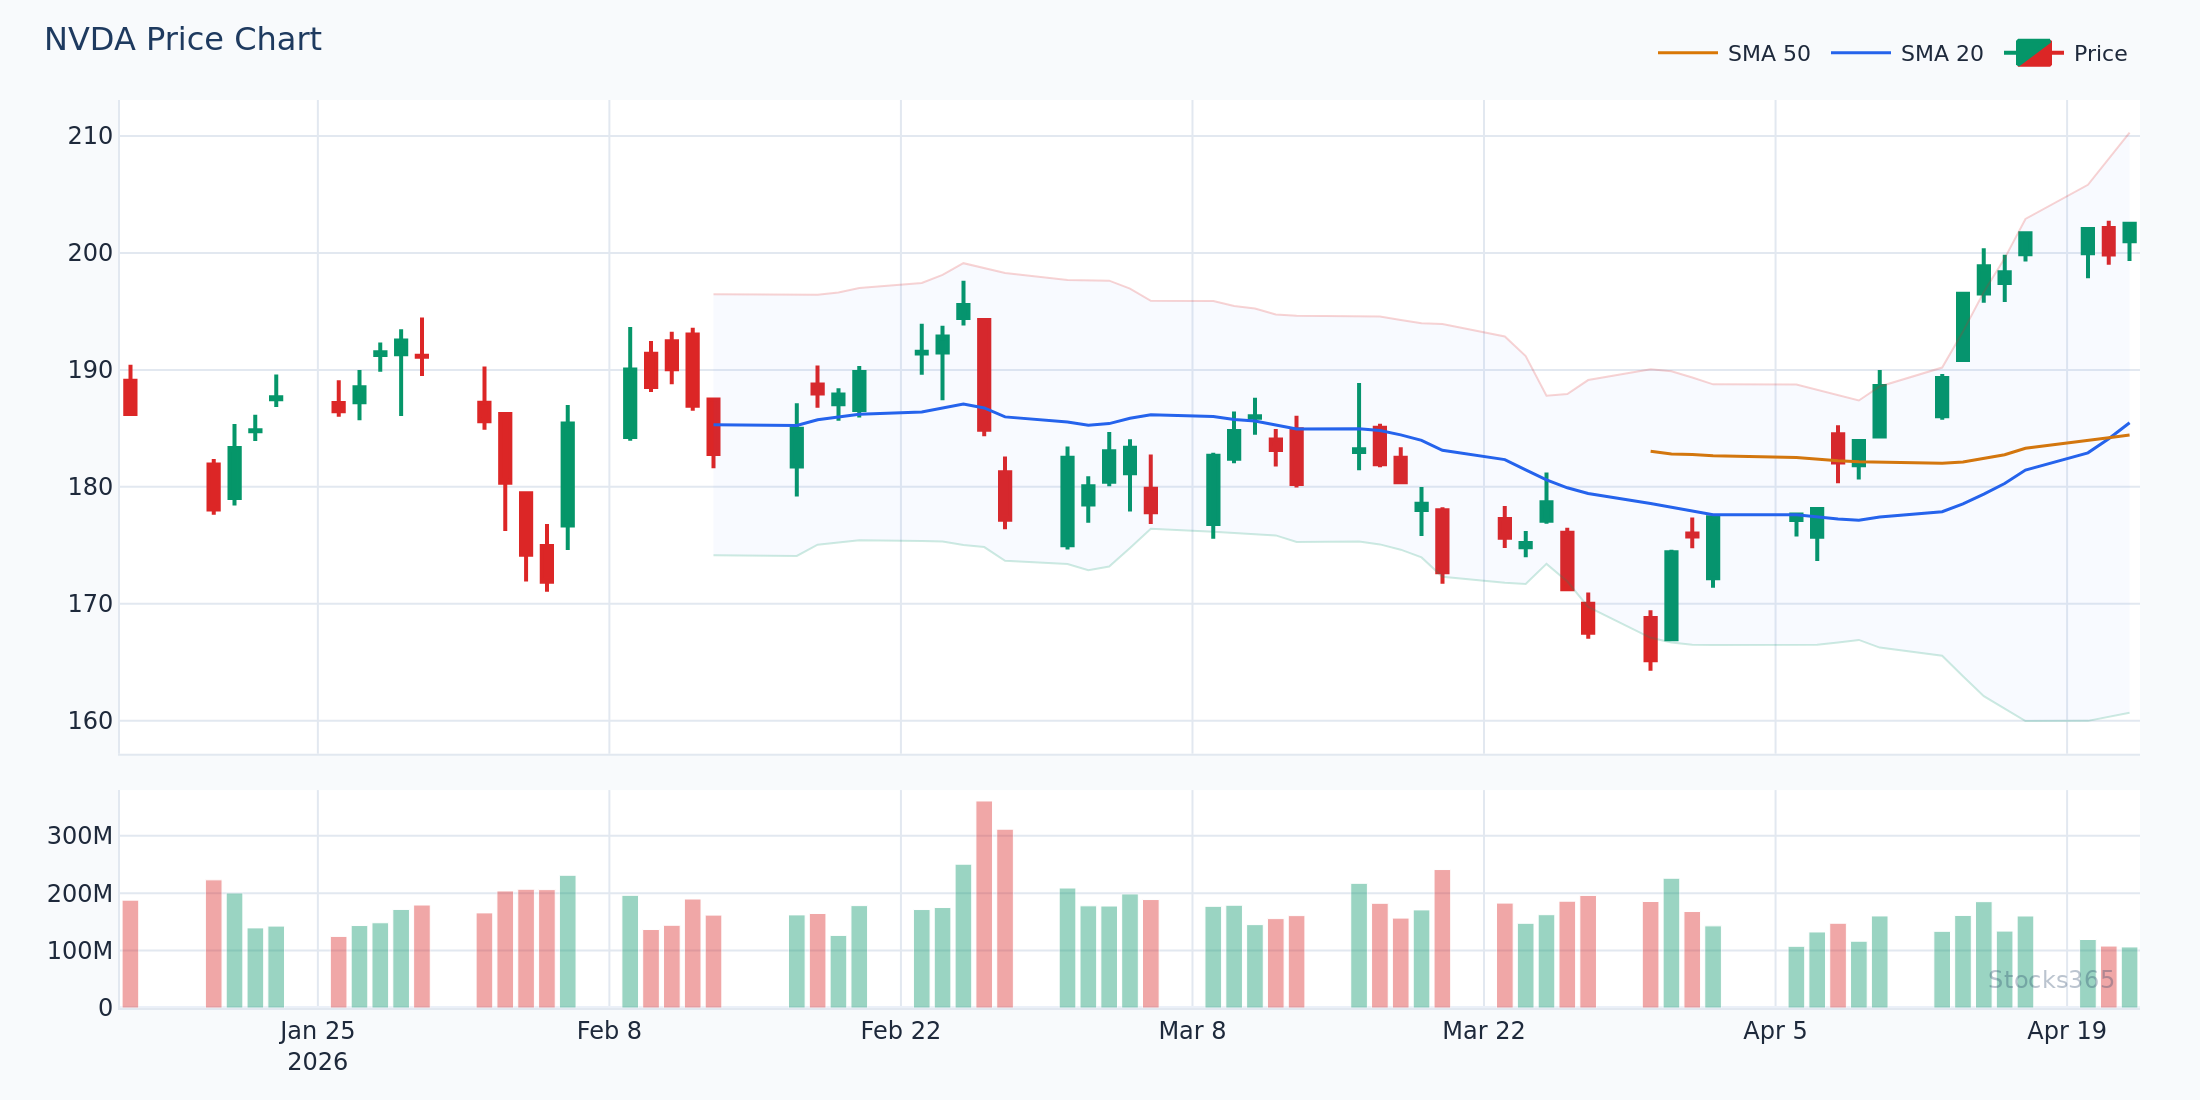
This chart shows a classic SMA crossover setup where the shorter-period average crosses above the longer-period line after a period of consolidation. When the crossover holds for two or more consecutive closes, momentum often accelerates in the crossover direction. A failure to hold — where the shorter SMA quickly reverses back below — invalidates the setup and signals choppy, indecisive price action.
The Big Misconception About Simple Moving Averages
Here's what most traders get wrong: they treat every SMA cross as a buy or sell signal. A 5-day SMA crossing above a 20-day SMA looks clean on a chart — but in ranging markets, this produces a graveyard of false entries. The SMA doesn't know whether the market is trending or chopping. You have to make that determination first. Use the SMA cross as a confirmation tool, not a trigger. The edge isn't the cross itself — it's the cross following a period of compression or a clear trend continuation pattern.
How to Calculate an Exponential Moving Average (EMA)
The EMA is more complex — but far more responsive to recent price action. That's why short-term traders and day traders prefer it.
EMA Formula
EMA = (Current Close × Multiplier) + (Previous EMA × (1 − Multiplier))
Where: Multiplier = 2 ÷ (N + 1)
Step-by-Step EMA Calculation Example
Let's calculate a 5-period EMA. We need a starting point — the first EMA value is simply the first SMA of the same period.
Sample closing prices:
- Day 1: 42
- Day 2: 44
- Day 3: 43
- Day 4: 46
- Day 5: 45
- Day 6: 48
- Day 7: 47
Step 1 — Calculate the Multiplier:
Multiplier = 2 ÷ (5 + 1) = 2 ÷ 6 = 0.3333
Step 2 — Seed the first EMA (Days 1–5 SMA):
42 + 44 + 43 + 46 + 45 = 220 ÷ 5 = 44.0 (this is your Day 5 EMA)
Step 3 — Calculate Day 6 EMA:
EMA = (48 × 0.3333) + (44.0 × 0.6667)
EMA = 16.0 + 29.33 = 45.33
Step 4 — Calculate Day 7 EMA:
EMA = (47 × 0.3333) + (45.33 × 0.6667)
EMA = 15.67 + 30.22 = 45.89
Notice how the EMA is already higher than the SMA equivalent because it weighted the recent surge on Day 6 more heavily. That's the EMA's edge in fast-moving markets.
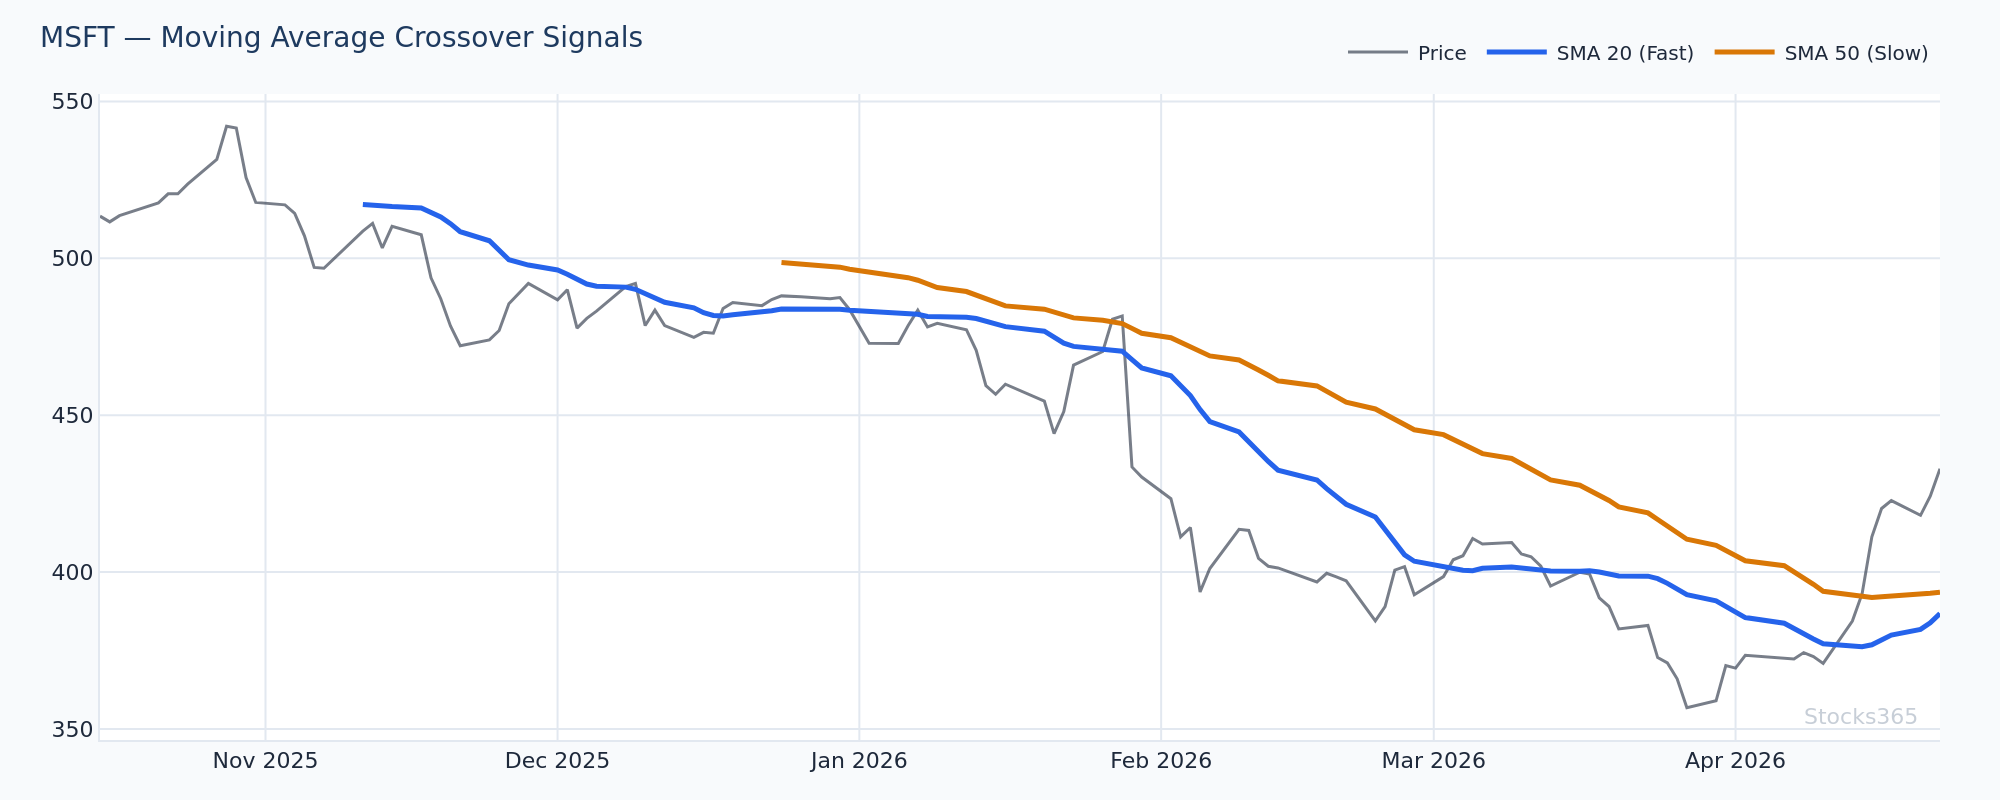
This chart illustrates price repeatedly testing the EMA from above during a bullish trend, with each pullback to the EMA line acting as a dynamic support level. The pattern is valid as long as each bounce produces a higher low relative to the previous test. A clean close below the EMA on expanding volume typically signals the trend is weakening and warrants caution on long positions.
Why Traders Prefer the EMA Over the SMA
In trending conditions, the EMA hugs price more tightly. It reacts faster to breakouts. It also exits losing setups faster when price reverses. For active traders tracking momentum stocks or crypto, the EMA is almost always the preferred tool.
That said — the SMA is smoother and better for identifying macro trend direction. Many traders use both: EMA for entries, SMA for trend context.
How to Calculate a Weighted Moving Average (WMA)
The WMA applies a linear weighting — the most recent close gets the highest weight, and each prior period gets progressively less.
WMA Formula
WMA = Σ(Price × Weight) ÷ Σ(Weights)
For a 5-period WMA: weights are 5, 4, 3, 2, 1 (most recent gets 5, oldest gets 1).
Step-by-Step WMA Calculation
Using the same 5 closing prices: 42, 44, 43, 46, 45 (Day 5 is most recent)
- Day 1 (weight 1): 42 × 1 = 42
- Day 2 (weight 2): 44 × 2 = 88
- Day 3 (weight 3): 43 × 3 = 129
- Day 4 (weight 4): 46 × 4 = 184
- Day 5 (weight 5): 45 × 5 = 225
Sum of weighted prices: 42 + 88 + 129 + 184 + 225 = 668
Sum of weights: 1 + 2 + 3 + 4 + 5 = 15
WMA = 668 ÷ 15 = 44.53
Compare that to the SMA of 44.0. The WMA is slightly higher because it emphasizes the more recent — and slightly higher — closing prices. Small difference here, but in volatile markets, these gaps widen and matter.
This comparative chart highlights how each moving average type responds to a sudden price breakout. The WMA reacts first, the EMA second, and the SMA last — demonstrating the speed trade-off between responsiveness and smoothness. Traders looking for early entries often favor the EMA or WMA, while those prioritizing trend confirmation lean on the SMA to filter out noise.
SMA vs EMA vs WMA — Which One Should You Use?
When to Use the SMA
- Identifying long-term trend direction (50-SMA, 200-SMA)
- Swing trading where lag is acceptable
- Markets with lower volatility where smoothness helps
When to Use the EMA
- Day trading and short-term momentum plays
- Fast-moving assets like growth stocks and crypto
- Crossover strategies where speed of signal matters
When to Use the WMA
- When you want even faster reaction than the EMA
- Scalping strategies on tight timeframes
- Experimental strategies testing linear-weighted approaches
No moving average is universally "best." The right choice depends on your timeframe, asset class, and whether you prioritize speed or smoothness.
Common Moving Average Periods and What They Measure
Knowing the math is only half the picture. You also need to know which periods traders actually use — and why.
- 9 EMA / 10 EMA — Very short-term momentum; popular with day traders
- 20 SMA / 21 EMA — Short-term trend; widely used for swing trading entries
- 50 SMA — Medium-term trend benchmark; institutional reference level
- 200 SMA — Long-term trend filter; bull vs. bear regime definition
The 20 SMA deserves special attention. It's one of the most-watched levels in the market.
Our analysis of 3,332 signals found that price crossing below the SMA 20 produces a 50.9% win rate with a profit factor of 1.06 over a 10-day holding period — with crypto performing best at 66.8% and forex worst at 42.5%. That's a narrow edge, which means context and confirmation are everything. See the full dataset at Stocks365 Insights.
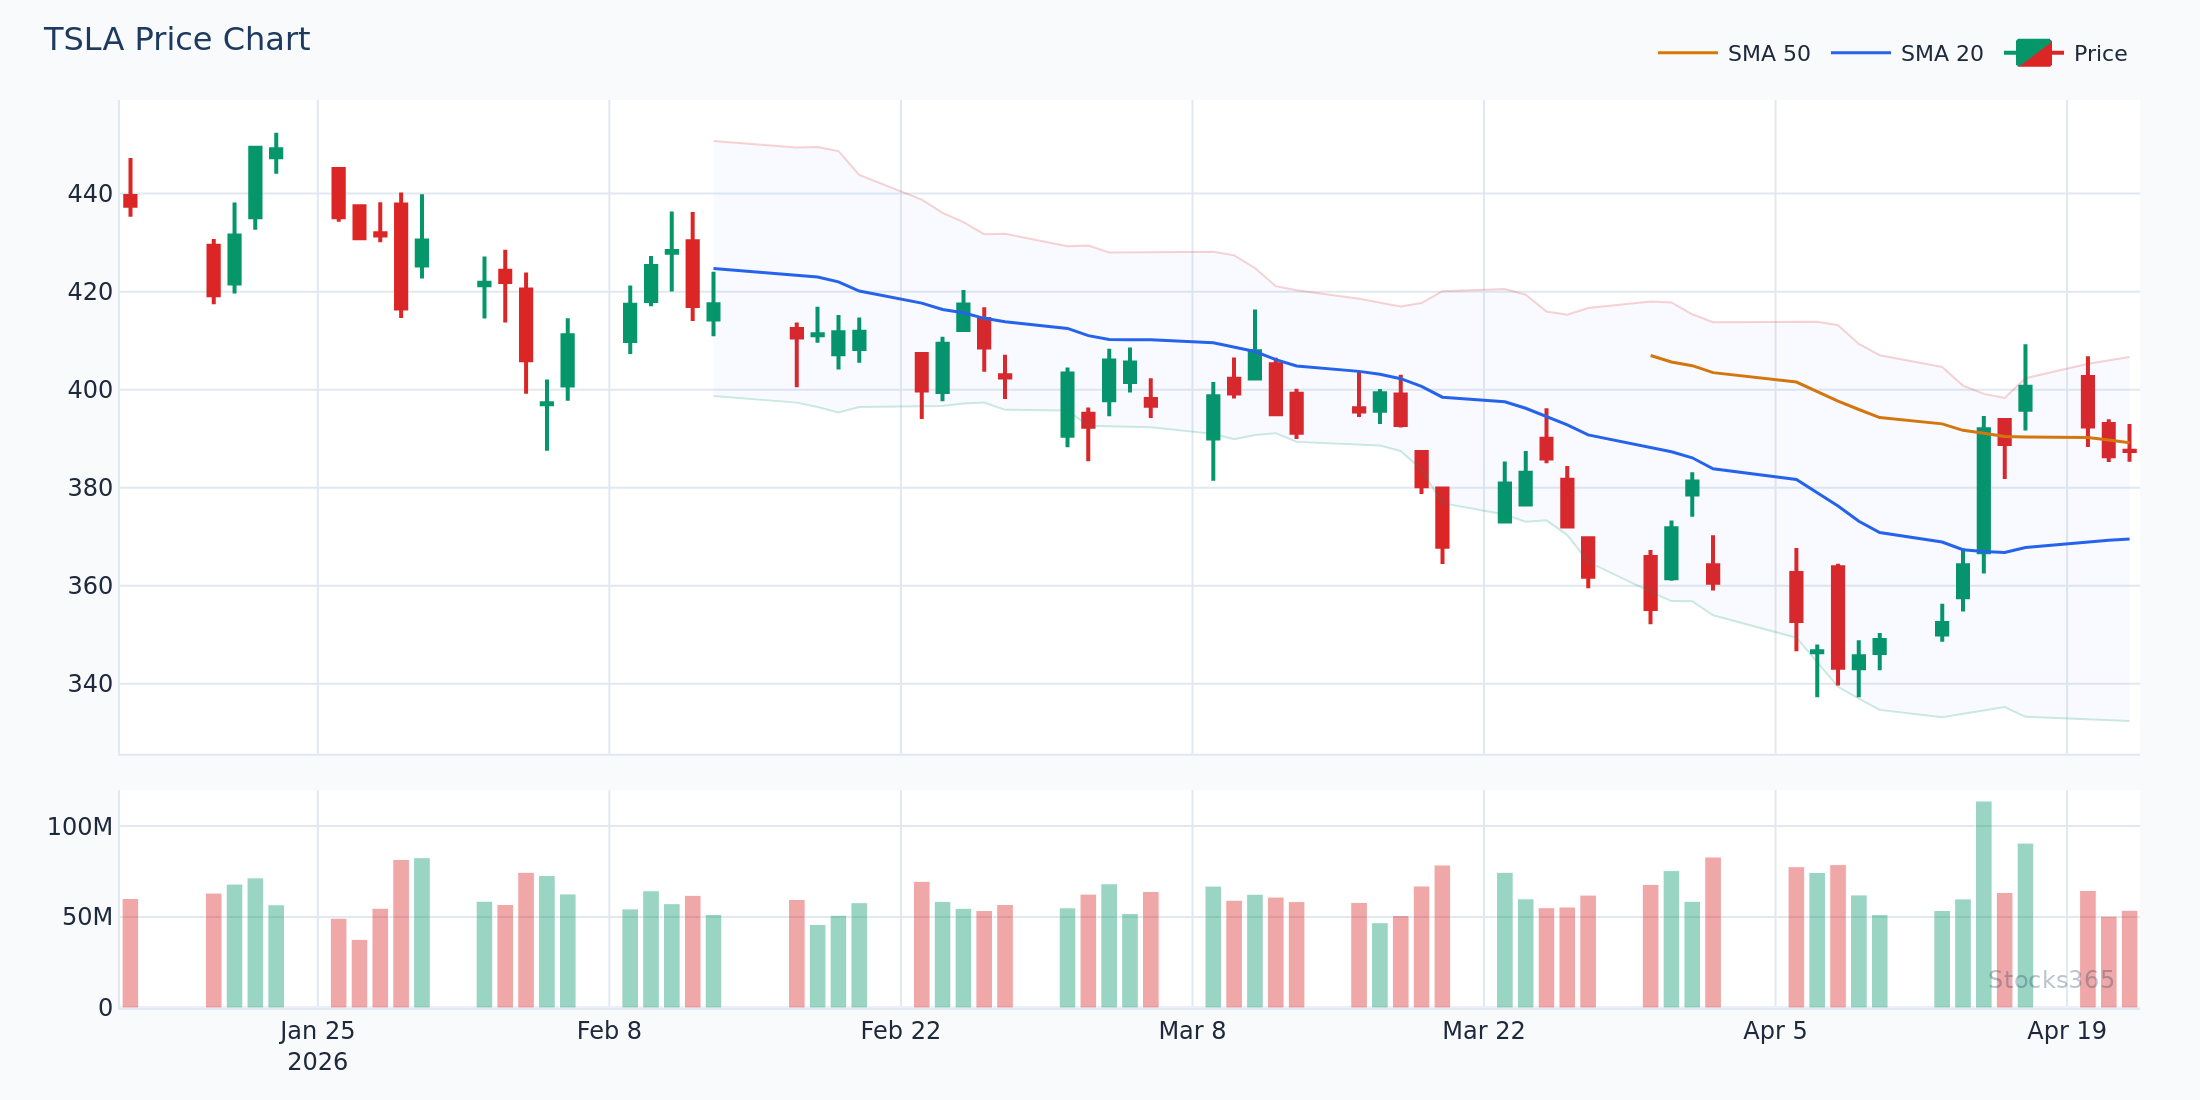
This setup shows price pulling back to test the 20-SMA after an extended move higher, then closing back above with a bullish candle pattern. When volume on the recovery candle exceeds the average of the prior five sessions, the continuation signal gains credibility. A daily close back below the 20-SMA on volume would invalidate the setup and suggest the pullback is becoming a deeper correction.
How Moving Average Crossovers Work in Practice
The crossover is the most popular moving average signal. Two averages — one shorter, one longer — interact. When the shorter crosses above the longer, it's a bullish signal. When it crosses below, bearish.
The Golden Cross and Death Cross
The most famous crossovers are the Golden Cross (50-SMA crossing above 200-SMA) and the Death Cross (50-SMA crossing below 200-SMA). These are macro signals — used by institutional traders to define broad market regimes, not individual trade entries.
Don't use the Death Cross to time precise entries. Use it to understand context.
Short-Term Crossover Strategies
More actionable for active traders: the 9/21 EMA crossover on a 15-minute or hourly chart. When the 9 EMA crosses above the 21 EMA after a period of consolidation — especially with a rising RSI — momentum setups emerge. Combine with volume confirmation and you have a high-quality filter.
Speaking of RSI — moving averages and RSI work best together. If you're not pairing them, you're leaving signal quality on the table. Check out How to Use RSI in Trading: The Ultimate Step-by-Step Guide to see how these tools complement each other.
Integrating Moving Averages With Other Indicators
Moving averages alone don't tell the full story. They're trend-following tools — they confirm what's already happening. For timing, you need oscillators and momentum indicators alongside them.
Moving Averages + RSI
One of the most reliable combinations. Use the 20 or 50 SMA to define trend direction, then use RSI to identify pullback entry points. When price is above the 50-SMA and RSI dips toward the 40 level before bouncing, that's a higher-probability long setup than just trading the crossover alone.
If you want to understand exactly how RSI is constructed — the way this article has shown you moving averages — read How RSI Is Calculated: Formula Explained Step by Step. The math behind indicators is always worth knowing.
Moving Averages + Volume
Price crossing above a key moving average on volume that is 1.5x to 2x the 20-period average volume is significantly more reliable than a crossover on thin, low-conviction volume. Volume confirms participation. No volume, no conviction.
Moving Averages + RSI Divergence
When price makes a new low below a moving average but RSI forms a higher low, you have bullish RSI divergence at a key technical level. That combination — divergence at a moving average — is one of the higher-quality reversal setups in technical analysis.
Stocks365 research across 3,289 signals found that price crossing above the SMA 20 produces only a 48.3% win rate with a profit factor of 0.88 — barely above random for most asset classes, and actually negative expectancy in crypto at 36.9%. This is exactly why combining the SMA cross with additional confirmation (volume, RSI, divergence) is not optional — it's essential. Explore the full breakdown at Stocks365 Insights.
Practical Moving Average Setups to Apply Right Now
Setup 1 — The 20-SMA Pullback Entry
In a clear uptrend, price pulls back to test the 20-SMA. Watch for a bullish candlestick pattern (hammer, engulfing, inside bar breakout) at the SMA. RSI should be between 40 and 55 — recovering but not overbought. Enter on the candle close. Stop below the SMA low.
Setup 2 — The EMA Crossover With RSI Confirmation
On a daily or 4-hour chart: 9 EMA crosses above the 21 EMA. Simultaneously, RSI crosses above 50 from below. That dual confirmation filters out many false signals that would trap traders in choppy conditions. For deeper understanding of RSI thresholds, RSI Overbought and Oversold Levels: Master the Signals is required reading.
Setup 3 — The 200-SMA Reclaim
After an extended downtrend, price reclaims the 200-SMA on a weekly close with above-average volume. This is a macro regime shift signal. Not a day-trade entry — a position trade trigger for weeks to months. The first successful retest of the 200-SMA from above is often a clean long entry.
You can track live moving average signals and setups directly on the Stocks365 signals dashboard — or drill into individual stocks like AAPL signals to see how these indicators are firing in real time.
What to Watch For
- 20-SMA pullback rejections in trending markets: When price pulls back to the 20-SMA during an established uptrend and forms a bullish rejection candle (hammer or bullish engulfing), with RSI holding above 45, the continuation rate is notably higher than random — especially in large-cap equities.
- EMA crossovers following a Bollinger Band squeeze: When band width compresses to multi-month lows and then the 9 EMA crosses above the 21 EMA on the expansion breakout, the momentum move typically extends further than average — often 2 to 3 ATRs from the breakout candle.
- Death Cross setups in crypto during risk-off regimes: When the 50-SMA crosses below the 200-SMA in major crypto assets while broader market sentiment is negative, the subsequent trend extension tends to be prolonged. Use hidden RSI divergence on lower timeframes to identify short-term counter-trend bounces within the larger decline.
- 200-SMA first retest after reclaim: The first time price pulls back to test the 200-SMA from above — after a confirmed weekly close above it — historically produces a high-probability bounce setup, particularly in equities. Watch for RSI holding above 40 on the retest to confirm trend health.
- SMA compression zones before earnings or catalysts: When the 20-SMA, 50-SMA, and 200-SMA compress into a tight range simultaneously, volatility expansion is typically imminent. The direction of the first SMA crossover after the compression often defines the dominant move for the following 4 to 8 weeks.
How Stocks365 Uses This
📊 How Stocks365 Integrates Moving Averages Into Its Intelligence System
Moving averages are a core component of the Stocks365 trust score system, which aggregates signals from 12+ technical indicators to assess trade quality and directional agreement.
Specifically, the Stocks365 engine evaluates moving average alignment — whether price is above or below key SMAs and EMAs, and whether short-term averages are positioned above or below long-term averages — as part of its trend regime scoring. When multiple moving averages align in the same direction across timeframes, the trust score reflects high directional agreement. When averages conflict — short-term bearish, long-term bullish — the system flags the signal as mixed and reduces conviction scoring accordingly.
The SMA 20 cross signals analyzed in our research data feed directly into this system, informing both the agreement component and the asset-class regime overlay that adjusts signal weight for crypto, equities, and forex differently.
This is why raw crossover signals are never presented in isolation on Stocks365 — every signal you see on the dashboard already reflects multi-indicator confirmation, including moving average context, before it reaches you.
Key Takeaways
📌 Key Takeaways: How to Calculate Moving Averages
- The SMA is the sum of N closing prices divided by N — simple, smooth, slow
- The EMA uses a multiplier (2 ÷ N+1) to weight recent prices more heavily — faster and more reactive
- The WMA applies linear weights — the most recent close gets the highest weight, producing the fastest reaction of the three
- Your first EMA value is always seeded from a simple average of the same period
- Moving average crossovers have narrow statistical edges on their own — confirmation from RSI, volume, or divergence significantly improves signal quality
- The 20 SMA, 50 SMA, and 200 SMA are the most widely-watched levels; understanding the math behind them helps you use them with conviction
- Pair moving averages with RSI for the most actionable trade setups — trend direction from MAs, timing from RSI